Tag: database monitoring

  • New Monitoring Features in PostgreSQL 13

    New Monitoring Features in PostgreSQL 13

    Every monitoring solution is limited by the information the system allows to be collected. PostgreSQL DBMS provides many metrics reflecting its internal state, running queries and background processes, and each release brings the community more monitoring-related features. PostgreSQL 13, which was released in September of 2020, added key improvements, including query sampling, improved WAL usage statistics and new system views. Let’s look at the benefits of each of these new features.

    Query Sampling

    Those who regularly monitor database queries are familiar with the following parameters:

    log_statement controls what SQL statements are logged
    log_min_duration_statement enables logging of statements that ran for at least the specified amount of time.

    These parameters help users track down unoptimized queries in applications. However, it is important to recognize that excessive log traffic may impact performance, especially when analyzing workloads with a lot of short queries. To help address this, PostgreSQL 13 introduced two new GUC parameters to allow logging of sampling statements.

    log_statement_sample_rate controls the sample rate (0.0 – 1.0). That is, it allows users to control the percent of queries that are logged.
    log_min_duration_sample defines the minimum required statement duration of queries to sample

    Only statements with a duration exceeding log_min_duration_sample are considered for sampling. Because of this, to enable sampling, both GUCs need to be set correctly. Further, the existing log_min_duration_statement GUC has a higher priority than log_min_duration_sample, so statements with a duration exceeding log_min_duration_statement will always be logged, no matter how the sampling is configured. This means that only configurations with log_min_duration_sample < log_min_duration_statement actually sample the statements, instead of logging everything. Note that only superusers can change these settings.

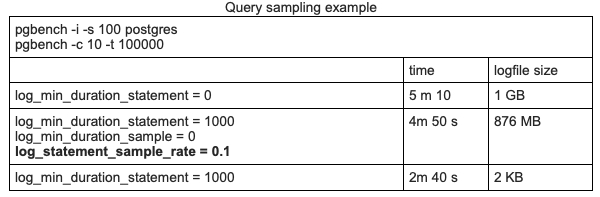
    Consider the following synthetic query sampling test using pgbench on a laptop.

    PostgreSQL 13

    • 1st Row: No sampling. All queries are logged
    • 2nd Row: Log all queries longer than 1 second, plus 10 percent of all other queries
    • 3rd Row: Log all queries longer than 1 second

    In this example, sampling improves timing slightly, but since the test was run on a personal laptop, this measurement does not signify much.

    However, the size difference is very interesting. Sampling helps make the logfile size approximately 10 times smaller. We can figure out that most of the queries in this test lasted less than 1 second. And if we log only long queries, the logfile remains almost empty (third row). The difference here is significant. Even if disk space consumption isn’t a concern, sampling can help speed up tools that analyze PostgreSQL logs.

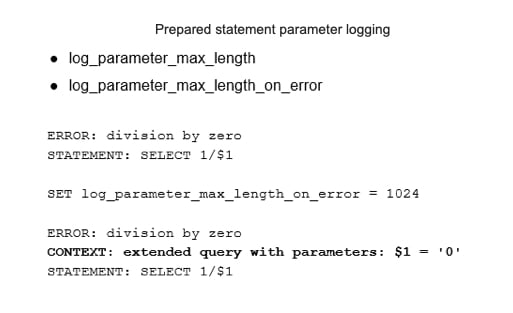
    PostgreSQL 13 also introduced settings to improve control over prepared statement parameter logging.

    If log_parameter_max_length is set, bind parameter values will be trimmed to this many bytes.
    log_parameter_max_length_on_error adds context for the failure of parameterized queries.

    Previously, prepared statement parameters were never logged during errors. Note, since these logging features can impact performance, they should be used with care.

    PostgreSQL 13

    Write-Ahead Log Usage Statistics

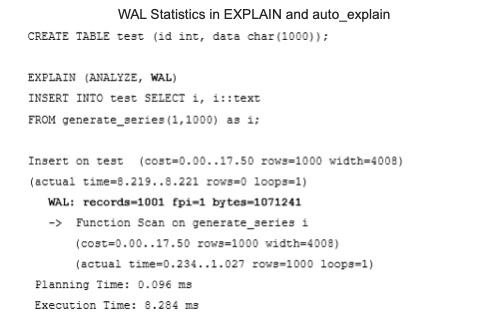
    A write-ahead log (WAL) is crucial to database system durability, and is also used for physical replication. This makes monitoring the WAL important. PostgreSQL 13 allows users to explore WAL usage per query using the EXPLAIN command. The following example shows that the insertion of a thousand rows generates 1001 records and takes about 1 Mb of space. Note that auto_explain also shows this statistic.

    PostgreSQL 13

    It is also possible to find WAL usage statistics in autovacuum log messages. However, this works only when autovacuum logging is enabled with the log_autovacuum_min_duration parameter.

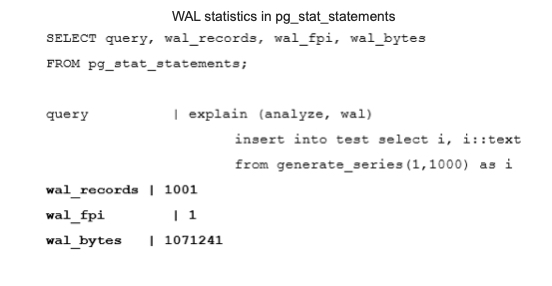
    Probably the most useful place to see WAL statistics for a monitoring plugin is in pg_stat_statements. PostgreSQL 13 has new columns that show WAL usage statistics per query.

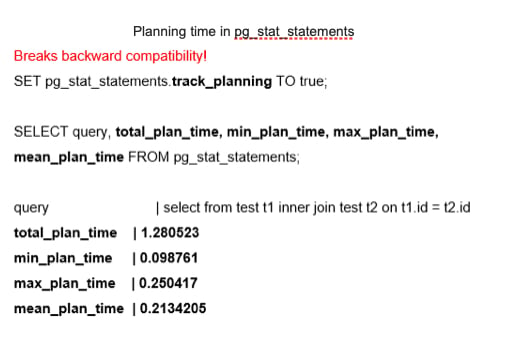
    Another addition to pg_stat_statements is a group of fields to track planning time. This feature is disabled by default because it can cause a noticeable decrease in performance. When enabled, it shows total, minimal, maximal and mean planning time. The pg_stat_statements.track_planning parameter enables this feature. It is important to note that this feature breaks backward compatibility. Previously, existing “time” fields — min_time, max_time, total_time and mean_time — had their suffixes changed from “time” to “exec_time.” As a result, all monitoring tools that rely on pg_stat_statements should be adjusted accordingly.

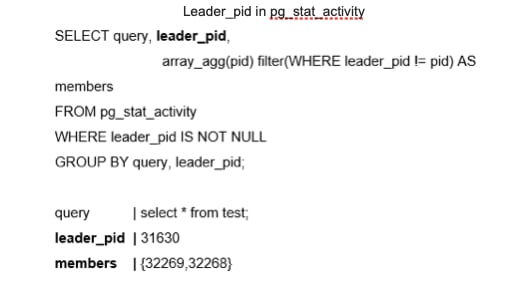
    The next feature provides more information about parallel queries. In the past, parallel queries did not reveal which back end was related to the parallel query or provide easy insight into all the processes involved in a query. It is now possible to show the parallel group leader information, at the SQL level, using the leader_pid in the pg_stat_activity system view.

    New System Views

    PostgreSQL 13 offers new system views that can be used for PostgreSQL monitoring. The first group improves progress reporting.

    pg_stat_progress_basebackup helps to estimate the progress of a base backup of a PostgreSQL cluster.
    pg_stat_progress_analyze shows information about backends running the ANALYZE operation, including autovacuum workers. It can help administrators understand how long it will take to collect statistics.

    Another group of new system views helps answer the following question: “How does Postgres spend its allocated memory?” These views will be mostly useful for DBMS admins and low-level support engineers who inspect bottlenecks and optimize memory usage.

    pg_shmem_allocation can be enabled for a deeper inspection of how shared memory is used for internal DBMS structures, including a lock table, process array, data about various background processes and so on.
    pg_stat_slru is related to the inspection of SLRU caches. SLRU is a special buffer cache where non-user data is stored, such as the state of each transaction, as well as information about subtransactions. Asynchronous notifications also use SLRU.

    Wait Events Changes

    PostgreSQL 13 introduced the renaming of various wait events to improve consistency. The brief reference to this in the release notes does not do justice to the importance of this change. Wait events were added in Postgres 9.6, and are usually needed to diagnose bottlenecks that occur because of interprocess locks. Previously, wait events were named in all possible styles. Now, the naming is more consistent, and the wait events are better documented and, hopefully, more understandable. However, admins need to update any monitoring scripts that use wait events, including the following:

    Hash/Batch/Allocating → HashBatchAllocate
    ControlFileLock → ControlFile
    clog → XactBuffer
    AsyncCtlLock → NotifySLRU

    Several new wait events were also introduced in PostgreSQL 13, including:

    VacuumDelay
    BackupWaitWalArchive, RecoveryPause
    RecoveryConflictSnapshot, RecoveryConflictTablespace

    Upper Limit for the track_activity_query_size Parameter

    One final small improvement in PostgreSQL 13 is worth noting: an updated upper limit for the track_activity_query_size parameter. This parameter specifies the amount of memory reserved to store the text of the command. The previous maximum was 100 KB, which could be too small when monitoring applications that generate large SQL queries.

    The new upper limit is 1 MB. However, keep in mind that the database allocates the amount of memory specified in track_activity_query_size in advance for all potential sessions. Thus, higher values can increase memory consumption.

    The Importance of These Features

    These significant updates in PostgreSQL 13 are vital for admins that run the database and want to tune the system, optimize applications, forecast system growth and do resource planning. However, the new features are also extremely important for DBMS developers who need to gather more information and collect real production statistics about various parts of PostgreSQL in order to find bottlenecks and opportunities to make improvements. As always, we look forward to even more great new features in future releases of PostgreSQL.

  • Financial Services Rise Above in Database DevOps

    Financial Services Rise Above in Database DevOps

    Financial services, pat yourselves on the back. A new study from Redgate shows financial services have superior database DevOps and database monitoring compared to other sectors.

    Financial IT appears to outperform other industries with high-quality database monitoring benchmarks consistently. For example, financial services on average are far quicker to detect and remediate failed deployments.

    Below, we’ll cover the main takeaways from Redgate’s latest 2020 State of Database Monitoring in Financial Services report, and bring in Grant Fritchey, Product Advocate at Redgate, to better understand why the financial sector is performing so positively in database DevOps.

    2020 State of Database Monitoring in Financial Services

    Redgate has released a special financial services edition of its 2020 State of Database Monitoring Report, a study that surveyed 971 database professionals across a wide range of sectors. This financial segment report highlights how database monitoring practices within banking, investment and insurance groups compare to other industries. Here are the main takeaways:

    Frequency and Remediation

    Financial services deploy more frequently and detect and resolve issues more rapidly.

    Financial services are quickly updating their databases. Sixty percent of financial services deploy once a week, whereas 43% of other sectors deploy once a week and some (10%) only update their databases once per year.

    Financial services are quicker to detect issues and respond. For example, 49% of financial institutions detect failed deployments within 10 minutes, compared to 39% across other sectors. The average Mean Time to Recovery (MTTR) is less than 10 minutes for 32% of financial services compared to 24% for different sectors.
    [su_note]Want to learn more about DevOps in Financial Services? Join us Thursday, Dec. 3, for FinConDX, a daylong virtual event dedicated to the latest in DevOps, DevSecOps and Digital Transformation practices and tools to help FinServ companies thrive. Register today![/su_note]

    It is impressive that financial services deploy more frequently yet still maintain higher Mean Time to Detection (MTTD) and MTTR than other sectors.

    Growth and Tools

    Financial services have a larger data footprint and a higher demand for database monitoring tools.

    The survey also demonstrates significant growth in overall database footprints, reflecting the sheer accumulation of data year after year. Whereas 26% of other sectors have 50 to 500 database instances, 36% of financial services have this many. Large financial data estates with more than 1,000 instances have grown 8 percentage points year over year.

    To help track these data estates, 66% of financial services use paid database monitoring tools. In other sectors, only 39% use paid database monitoring tools. The report predicts ongoing cloud migration and hybrid cloud modes will push these rates higher.

    Sixty-eight percent of customers report general satisfaction with database monitoring solutions. Yet, financial services cite a lack of features and time-consuming processes as top drawbacks, reflecting a need for financial services to utilize advanced functions and innovate quickly.

    Database Usage

    Financial professionals perform more tasks and grant more non-IT members database access.

    Working with more rigid security benchmarks, database professionals at financial services are often responsible for an increased number of tasks.

    Across all sectors, performance optimization and backups are the most common tasks performed by 70% and 60% of database professionals, respectively. However, if we look at financial services, tasks such as optimization, availability checking, user permissions management, patching and auditing are more common, all 8% to 11% higher.

    The report also found financial service databases, on average, are more widely accessed across the whole business, including database admins, management and business teams. According to the report, this could reflect a higher skill standard across the board at financial organizations.

    Issues

    Human error spikes moderately as financial IT innovates.

    Human error, capacity problems, bad deployments and software failure are top database issues across sectors. However, human error raises slightly within financial services, to 27% from 23%.

    “This spike [in human error] is just showing how fast our financial services institutions are changing to meet the needs of a changing business environment,” said Fritchey. Though there is a high demand to fill roles with data management skills, there is a talent shortage. “Recruitment is one of the biggest challenges,” he noted.

    That said, financial services do report fewer issues in other areas. For example, database access management is handled more efficiently at financial services. Whereas ad hoc user access issues have doubled in other sectors, financial services reported no significant change.

    Looking to the future, respondents indicate cloud migration, migrating to new server versions and improving performances as the top three impending challenges.

    Why Do Financial Services Outperform?

    Data demonstrates financial services on a superior overall curve when it comes to database DevOps. But why is this?

    “The answer is pretty simple,” said Fritchey. “Finance is driven by data. Therefore, they’ve always put the time and effort into protecting that information, and monitoring your systems is a fundamental aspect of data protection.”

    The financial sector is also prone to more security exploits and data privacy issues. Such concerns amplify the need for quality monitoring.

    “Organizations with good monitoring in place either also have better security or can spot vulnerabilities faster,” said Fritchey. With such measures in place, if a breach does occur, such organizations can react rapidly.

    International regulations such as GDPR or PSD2 mean financial services must meet stringent compliances. For Fritchey, active investment in quality database monitoring is part of this process.

    “The need to be able to operate across borders means that your systems must meet multiple compliance regimes. It simply makes sense to set the most stringent standards to ensure you can easily operate in the international sphere,” he said. “Monitoring is a fundamental aspect of meeting these compliance requirements.”

    The Future of Database Monitoring

    Financial services inherently require greater fault tolerance, and database monitoring is helping such services reach bank-grade security. As most respondents estimate their deployment frequency to increase in the next year, a greater focus on database integrity will be essential to keep pace.

    The financial services sector appears to be well-positioned for continued growth. With a shorter MTTD and a faster MTTR, financial IT is significantly more advanced than other sectors when it comes to database change frequency and issue remediation.

    “The fact that those with monitoring in place are also those who can more quickly deliver value through some type of DevOps process should cause people to pay attention,” added Fritchey. “All of this combines to make for a better overall organization who does more for their clients.”

  • Cloud Confessions: Full Stack APM Is a Necessity

    Cloud Confessions: Full Stack APM Is a Necessity

    IT environments have become more dynamic and complex, which has created the need for robust monitoring tools. As a result, companies are increasingly adopting more than one platform, catapulting us into the multi-cloud era. Technology professionals are also embracing and acknowledging the need for comprehensive, full-stack application monitoring and management, bringing application performance management (APM) into the mainstream.

    The recent SolarWinds survey Cloud Confessions 2020 reveals even though APM has become mainstream (with a majority of tech pros using APM tools regularly), there’s still work to be done to move beyond troubleshooting. This finding is consistent with last year’s study, in which nearly half of the respondents said troubleshooting was a top-three task they managed daily.

    Tech pros have an opportunity to fully leverage the benefits of APM across the entire application stack, not just for troubleshooting. They should enable tech pros at any stage in their APM journey to realize the value and richness of end-to-end optimization with APM.

    In 2020, implementing solutions to achieve integrated application performance and availability management for any type of organization will become increasingly important.

    The Cloud Confessions survey showcases how application owners, developers and support teams currently use APM tools. It also shows areas where tech pros feel they need more education and support to confidently utilize APM solutions.

    Cloud Confessions Key Findings

    This survey explores how extensively technology professionals are using APM tools, whether on-premises or for SaaS-based application management and how they monitor these environments. It also showcases areas where tech pros feel confident in their APM tools and strategies, as well as challenges and avenues for building confidence.

    The key findings show:

    1. Tech pros are using APM tools, employing a nearly even mix of SaaS and on-premises to support the three architectures most often found in modern environments. Despite this, confusion around which tools are ideal for specific IT environments is consistent across application owners, developers and support team roles.

    • Nearly nine in 10 tech professionals are using APM tools in their environments.
      • 59% are using APM for monolithic (traditional on-prem) app development architectures.
      • 40% are using APM for N-tier service-oriented architectures.
      • 39% are using APM for microservices.
    • The top three most commonly deployed tools in support of APM strategies are:
      • Database monitoring (64%).
      • Application monitoring (63%).
      • Infrastructure monitoring (61%).
    • Two-fifths of tech pros face challenges due to lack of awareness of what APM solutions are currently offered and confusion over which currently offered APM solutions are best for their needs (respectively).

    2. Overall, tech pros are confident in their ability to manage and monitor applications on-prem, in hybrid environments and in the cloud; this confidence mostly sits within their ability to troubleshoot.

    • Over eight in 10 (84%) respondents are confident in their ability to successfully manage application and infrastructure performance.
    • Two-fifths (40%) of tech pros surveyed are most confident troubleshooting application issues and monitoring application availability and performance (respectively) given their existing skillset, followed by one-third (32%) of tech pros confident in collaborating with team members.
      • Troubleshooting and monitoring as the top two areas where tech pros have the most confidence is consistent with last year’s findings—in 2019, troubleshooting app issues was the number one activity tech pros spent their time on, with 48% of respondents choosing this as a top three task.

    3. The largest challenges tech pros face when monitoring and managing application and infrastructure performance relate to an existing knowledge and skills gap. As a result, tech pros have continued to deal with the troubles of troubleshooting, despite nearly all using some type of APM tool in the last 12 months.

    • When ranking the challenges, tech pros said:
      • Lack of training for personnel was the top challenge (57%), followed by lack of awareness of what APM solutions are currently offered (44%) and confusion over which currently-offered APM solutions are best for our needs (42%).
      • All other challenges were at, or under, the 30% rate.
    • Nearly eight in 10 (78%) tech pros report spending less than 10% of their time proactively optimizing their environments (vs. reactively maintaining).
      • In 2019, 77% of respondents reported spending the same amount of time on proactive optimization.

    4. Tech pros value the business insights delivered from APM tools, but greater skills development is needed in establishing KPIs and communicating IT performance to the business.

    • The top three business insights tech pros gain from APM tools include:
      • Ability to prevent applications outages (73%).
      • Ability to prevent app slowdown related to performance and/or capacity (63%).
      • Ability to improve user/customer experience (62%).
    • Tech pros are collecting these business metrics, but there’s a need to bridge the gap between business metrics collected and tech pros’ confidence in their ability to communicate performance to the business.
      • 34% of tech pros feel they need to improve their current skillset/ability to track impact across key business metrics to more confidently manage their organization’s IT environment, followed by 30% of tech pros who feel they need to improve their current skillset/ability to troubleshoot application issues, improve the performance of application code (29%) and manage/ensure/improve end-user performance (29%) (respectively).

    The key findings uncover the importance of knowing which combination of APM elements are right for your environment. Today’s environments are highly complex and distributed, involving microservices, N-tier, monolithic and commercial off-the-shelf (COTS) applications. This means the potential benefits of APM are even greater in modern contexts, as long as tech pros take time to educate themselves on the right tools for their environments.

    While APM tool usage is widespread, it’s not nearly as effective as it could be—an important distinction to business leaders in charge of digital transformation efforts. When we understand the APM world beyond troubleshooting, the possibilities for application performance optimization open up across the stack and across previously siloed teams.

    APM, when used to its potential, can be the great unifier of tech pro teams all working toward the goal of having highly available, well-performing applications and it can change the way modern businesses operate in the age of performance.

    — David Wagner

  • SolarWinds Acquires VividCortex for Database Monitoring

    SolarWinds Acquires VividCortex for Database Monitoring

    SolarWinds announced this week it is extending its portfolio of DevOps tools with the acquisition of VividCortex, a provider of tools for monitoring a wide range of databases that is delivered as a set of software-as-a-service (SaaS) applications.

    Company president and CEO Kevin Thompson said the acquisition of VividCortex adds a database monitoring platform capable of monitoring so-called cloud-native databases such as MySQL, PostgreSQL, Amazon Aurora, MongoDB and Redis, complementing the company’s existing tools for monitoring databases to support legacy applications.

    In addition, Thompson noted the VividCortex tools are highly extensible; support for a new database can be added within 90 days.

    VividCortex claims to have nearly 300 customers today, including Etsy, GitHub, SendGrid, DraftKings and Yelp. SolarWinds, meanwhile, boasts more than 300,000 customers.

    Thompson said the number of databases organizations need to monitor is increasing as open source alternatives gain ground on proprietary databases. The result is a hybrid computing environment that requires tools to manage centrally since it’s not practical to try and master each set of monitoring tools provided for each database platform, added Thompson.

    SolarWinds VividCortex

    IT organizations also want to be able to compare and contrast the cost of deploying workloads on databases running in different environments, he added. Many IT organizations have already discovered that the cost of deploying certain types of workloads on public clouds is more expensive than anticipated.

    Thompson said it’s not really feasible to observe an application without being able to monitor the underlying database on which that application depends. In this respect, VividCortex adds a critical capability for DevOps teams, he said. SolarWinds intends to integrate VividCortex with a growing portfolio of DevOps tools that already includes a range of application performance management (APM) and infrastructure management tools. As is always the case, Thompson said IT organizations should also expect SolarWinds to drive the cost of employing database monitoring tools lower.

    As IT continues to evolve Thompson said SolarWinds believes many more organizations will embrace best DevOps practices. Much of that effort will involve retraining existing staff, because there are not enough college graduates to fill a rapidly expanding skills gap within IT organizations.

    It’s not clear to what degree lowering the cost of tools will accelerate the transition DevOps. Many organizations already rely on open source tools. However, the total cost of setting up and maintaining those tools often winds up being higher than a SaaS platform. In addition, all the upgrades to the SaaS platform are handled by the provider of the service.

    In many cases, developers wind up embracing open source tools to lower the cost of building an application, which the IT operations team then manages using commercial tools once that application is deployed in a production environment. In some cases, however, open source tools embraced by developers also end up being employed in the production environment. In either case, IT organizations now have more tools to choose from than ever.

    — Mike Vizard

  • The Impact of DevOps on Database Monitoring and Management

    The Impact of DevOps on Database Monitoring and Management

    The rise of DevOps has broken down silos and brought database administrators (DBAs) and application developers closer together to deliver software faster and in a more agile manner. This near-constant change driven by DevOps is reflected in the results of the Redgate 2019 State of SQL Server Monitoring Report.

    It reveals that 73% of organizations now deploy database changes multiple times per month, and 15% deploy multiple times per day, driven by DevOps. Yet, this is just one of the challenges DBAs face today. The research also identified the size of database estates is growing–45% said they will have more to manage over the next year, with 43% remaining the same.

    Additionally, they are increasingly looking to migrate their databases to the cloud (cited as their biggest challenge by 22%) and are seeking to solve performance issues. Perhaps unsurprisingly, given these greater workloads and more frequent changes, human error is the largest cause of issues (22%), ahead of capacity problems and bad deployments.

    Managing in a DevOps World

    The database is now a core part of DevOps for many organizations and DBAs need to work more closely with their developer colleagues, adopting new technologies and tools to ensure business success.

    This essentially involves DBAs focusing on the following distinct areas.

    Standardizing Approaches Across DevOps Processes

    The monitoring report highlighted human error as the biggest cause of problems for DBAs–and with larger DBA and developer teams now working on databases together, adopting standardized processes is vital to flagging issues early and preventing later problems. Otherwise, what starts as a minor issue can swiftly escalate to become a significant business crisis.

    As well as standardizing processes, organizations should look at rolling out industry-standard coding tools across the entire team. This will ensure a consistent approach, not matter who is writing, reviewing or editing code. Introducing a team style for database code, rather than having the code written in many different ways, for example, will make the code base consistent and clear and minimize the confusion that lead to errors. At the same time, merging code early and often with version control tools will ensure you have a known, shared codebase on which to work, and provide a single source of truth that can always be relied on.

    Automating for Speed and Consistency

    Developers who have adopted DevOps already see the value automated processes such as continuous integration, continuous delivery and continuous deployment provide. Automation not only speeds up development, avoids manual errors and reduces laborious work, but also provides a full audit trail for regulatory compliance.

    Extending this to the database can deliver major benefits for hard-pressed DBAs. Every time a change is committed to version control, for example, a continuous integration process can be triggered to test the change and flag up any errors in the database code. The errors can be fixed immediately and tested again, before the change is then passed along to a release management tool where it can be reviewed before being deployed to production.

    Overall, automation dramatically brings down time to market, but organizations need to ensure they have the right tools and processes in place if it is to be truly effective.

    Stepping Up Monitoring to Drive Continual Improvement

    One of the mantras of DevOps is continual improvement, and that applies equally to database DevOps. Monitoring is a key part of this. On one level, monitoring tools highlight potentially disruptive performance issues (cited by DBAs in the research as a major challenge), enabling them to be fixed quickly.

    Beyond this, they also deliver the insights and trends companies need to improve, helping them optimize operations moving forward. Thanks to a combination of DevOps and the growing importance of the database to business success, many organizations are already sharing this information. For example, 40% give developers access to their monitoring data, according to the research, which helps to enhance performance by highlighting opportunities for improvement.

    Guarding Personal Data and Ensuring Regulatory Compliance

    We’ve all seen the spread of data privacy regulations across the globe. Over 60% of the world’s population is likely to be covered by more stringent legislation in the near future, with California joining the EU in enforcing new regulations from January 2020. Organizations need to realize they are now data guardians, not data owners, when it comes to personal information.

    At the same time, developers like to have realistic information in order to successfully create and test new code. That means organizations need to adopt tools for data masking and anonymization that can protect confidential and personal information, while still providing realistic and usable data for development and testing. This also gives a full audit trail for regulatory requirements, balancing speed and compliance.

    DevOps has broken down the traditional silos between DBAs and developers and the importance of information has put the database center stage. As the latest Redgate research shows, DBA workloads are increasing, meaning they need to adopt new technology and collaborate more closely with developers if they are to successfully manage in a DevOps world.

    — Matt Hilbert