Tag: data

  • How to Build a Data Platform for Self-Service, Ad-Hoc Analytics

    How to Build a Data Platform for Self-Service, Ad-Hoc Analytics

    In a digital world, data is often the differentiator between success and failure. Whether it’s defending against cybersecurity threats, improving application performance, or resolving full-blown outages, data is critical to the modern DevOps team.

    In fact, there are plenty of situations where DevOps engineers, SRE teams and other observability-focused departments need to explore reams of data rapidly and flexibly. An SRE trying to figure out the root cause of latency may need to dissect the movement of data across endpoints to find the malfunctioning one. Another engineer may need to compare historical and current performance to find anomalous behavior. Lastly, a DevOps engineer may have to dissect user performance metrics to understand the scope of a slowdown—whether it is global or regional.

    Every use case requires dashboards that can provide detailed data through a wide variety of visualizations, including choropleth maps, stack areas, pie charts and bar graphs. Ideally, a dashboard will enable teams to isolate dimensions, apply filters, and dive into data for deeper insights.

    Unfortunately, not all dashboards can support this type of fast, flexible analysis. Many still utilize outdated technologies, which lack the flexibility, agility and scalability required to seamlessly explore data. Many were also designed without the urgency that today’s data requires—after all, in previous years, most uses for dashboards (such as internal reporting) were not time-sensitive.

    Other dashboards are constrained by templates, which offer a finite array of widgets, tools and drill-down capabilities. These dashboards may feel unwieldy and sluggish, unsuited for a rapidly evolving situation like an application outage.

    Requirements

    To truly fulfill the promise of self-service, ad-hoc analytics across huge datasets, teams need to work in real-time—and so they need a database capable of timely responses.

    When an application goes down, an SRE may not know what to look for and, hence, needs to quickly comb through lots of data. While some dashboards rely on workarounds for faster queries, such as pre-aggregations, precomputing, or rollups, this is not possible in this instance because the SRE simply won’t know what to look for. After all, they can’t necessarily predict what will go wrong, and even if they work on assumptions from previous failures, this current issue could be much different.

    Therefore, dashboards must provide plenty of functionalities and visualizations. Users should be able to filter data by time, isolate variables like location, and zoom into specific time intervals with a few clicks. Dashboards should also accommodate diverse data types, including intricate parent-child relationships and nested columns.

    Further, dashboards must offer a depth of insight. An online streaming media platform may need to assess user metrics (such as latency or load times) across different devices, operating systems, and regions to fine-tune performance. A cloud provider has to monitor their physical hardware for high temperatures, slowed network switches or devices, and other anomalies.

    Because data is now so important to success, many more people across a company, including data scientists, product managers and external users, themselves require data-driven insights. In these situations, dashboards must handle the increased user traffic and query activity, maintaining fast responses even under load. This is especially important considering that a single-user operation (such as a zoom) will require multiple queries on the backend to execute.

    A database also must scale seamlessly. If an organization’s environment generates millions of events an hour, that equates to billions of events per day or week—challenging for any database to ingest, store, analyze and query. In fact, many databases cannot successfully provide fast response times while managing large datasets and high query volume. As an example, transactional databases (OLTP) can often query rapidly but cannot execute analytics at scale, while analytical databases (OLAP) can analyze massive volumes of data but not at speed.

    Apache Druid for Independent, Ad-hoc Data Exploration

    This is where open source Apache Druid comes in. Combining the scale and advanced analytics of an OLAP database with the speed of an OLTP database, Druid offers swift, real-time data exploration.

    Upon ingesting data, Druid makes it immediately available for querying and analysis, removing the need to first batch or aggregate the data in some way. In addition, Druid natively integrates with streaming technologies like Apache Kafka and Amazon Kinesis, removing the need for workarounds or connectors.

    Druid powers interactive visualizations, providing millisecond response times, enabling more versatile exploration, expanding the range of available dimensions and filters, and even maintaining subsecond speeds in the face of surging user and query volumes.

    Druid’s unique architecture also enables easy scaling. By separating key duties among separate node types—data nodes for storage, master nodes for data ingestion and availability, and query nodes for executing queries and returning results via the scatter/gather method—Druid ensures that nodes can be independently scaled based on need. Afterward, Druid also automatically rebalances traffic to ensure consistent performance.

    Salesforce: A Druid Success Story

    Salesforce pioneered the customer relationship management (CRM) space, serves 150,000 customers worldwide and earns billions in annual revenue. 

    The Edge Intelligence Team is the division of Salesforce that tackles the massive task of ingesting, processing, filtering, aggregating, and querying the entirety of their log data — anywhere from billions to trillions of lines daily. Each minute, Salesforce ingests 200 million metrics, while each day, Salesforce processes five billion daily events globally. In total, Salesforce accumulates dozens of petabytes of data in their transactional store, five petabytes of logs in their data centers, and almost 200 petabytes in their Hadoop storage.

    Salesforce teams use Druid to unlock real-time insights into product performance and user experiences, diving into large datasets instantly. Anyone from engineers to account executives can query a wide variety of dimensions, filters and aggregations to better understand trends, troubleshoot any issues that arise and set strategies for the future.

    By using Druid’s compaction abilities, Salesforce also decreased the number of Druid rows by 82%, leading to an overall reduction of their storage footprint by 47% and accelerating their query response times by 30%.

  • Digma Leverages ML to Bring Observability Insights to IDEs

    Digma Leverages ML to Bring Observability Insights to IDEs

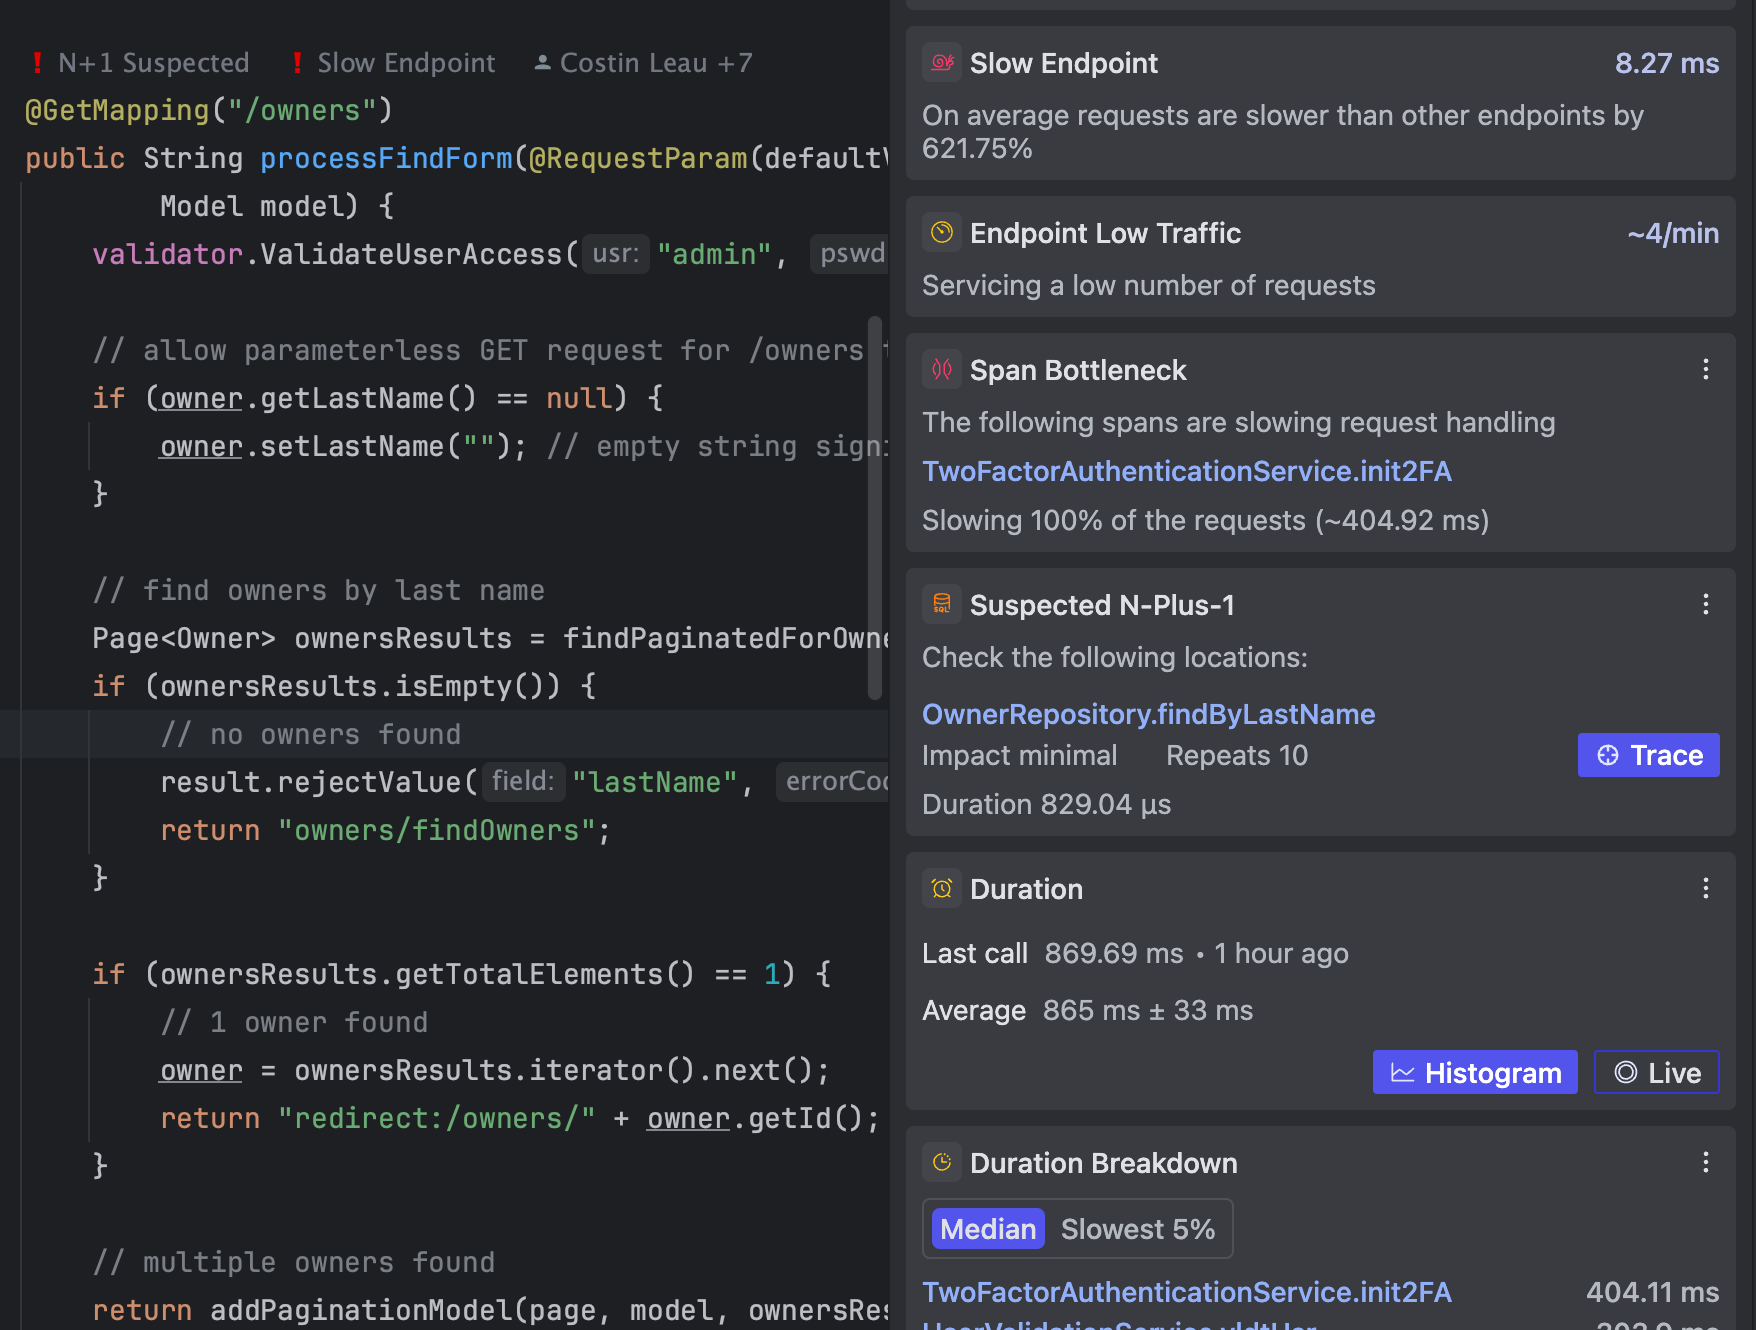
    Digma has launched a namesake platform the provides developers with continuous feedback from observability data that surfaces directly within their integrated development environment (IDE).

    Digma CTO Roni Dover said the Digma Continuous Feedback platform leverages machine learning algorithms to enable developers to easily analyze their code at runtime to identify issues, anomalies and regressions. Digma Continuous Feedback removes the need to consult a separate dashboard that requires developers to log into an observability platform.

    In fact, the reason developers often don’t make use of the data that observability platforms provide to write better code is that it’s not readily accessible at the time they are writing code, noted Dover.

    In general, it’s become much easier to collect logs, metrics and traces by using open source OpenTelemetry agents that can be embedded within software libraries. The Digma Continuous Feedback platform applies machine learning algorithms to that data to provide developers with insights on improving code in real-time, said Dover.

    The ultimate goal is to make it simpler for IT teams to distinguish when, for example, a software component actually needs more memory or is simply inefficient, he added. Those insights can be applied to code written by developers or code generated by an AI platform.

    Whether code is written by a human or generated by a machine, quality is often in question. Developers with varying levels of experience will naturally write code that can differ substantially in quality and efficiency. At the same time, developers may be asked to fix code someone else wrote; the original author no longer works for the organization, noted Dover. In either use case, the Digma Continuous Feedback platform immediately surfaces issues that will enable organizations to set higher baselines for code quality, he added.

    That baseline is especially critical as more code starts to be generated by generative AI platforms based on general-purpose large language models (LLMs) trained using code samples of varying quality collected from across the web. Developers will be able to immediately determine any issues that may arise should they choose to incorporate that code within an application.

    Developers, of course, don’t deliberately set out to write bad code, but the tools that enable them to identify issues are not easily accessible. In fact, too many developers tend to view observability platforms designed for IT operations teams as being overly complex, noted Dover. The Digma Continuous Feedback platform takes that issue off the table by identifying issues without increasing the level of cognitive load developers are expected to carry, he added.

    Eventually, thanks to the rise of machine learning algorithms and generative AI platforms designed specifically to write high-quality code, the overall state of software engineering will improve. The issue is determining the best way to get the benefits these technologies provide directly to the developers who write code—an issue that is at the heart of so many DevOps challenges.

  • Why Data Silos Are Killing Your Developer Productivity

    Why Data Silos Are Killing Your Developer Productivity

    Every company is at risk of fostering data silos. In fact, a study conducted by Forrester Consulting for Airtable across employees in the U.S. and the UK revealed that, on average, knowledge workers spend 30% of their week looking for the information they require to do their job and the difficulty in finding and accessing data is the top reason why they feel disengaged from work. What causes essential data to be inaccessible in the workplace? We will explore the root of modern data silos, why they drain developers’ productivity and how to break away from these silos with better observability in your organization.

    What are Data Silos?

    A data silo is a collection of data held by a group that is not easily or fully accessible by other groups in the same organization.

    Data silos can be a byproduct of organizational structure. When different departments or business units in an organization operate independently, they develop their own way of collecting, storing and managing their data. The processes to access that data from other business units can be cumbersome or even nonexistent. Sometimes, the individuals responsible for the data will even be against sharing it for fear that it would be misused or misunderstood outside of their particular unit. The difficulty in accessing information then leads to independent data collection from other business units and ultimately creates other data silos and multiple sources of truth.

    Data silos can also happen during times of growth for an organization. New tools are necessary to support the growing needs of the business and are added to the list of tools already in use. Over time, this list grows, and systems that were designed to operate in isolation can create data silos by limiting the ability to integrate with other systems. A recent survey of marketing organizations by Emarsys showed that the surveyed organizations are using an average of 91 marketing cloud services. These 91 tools undoubtedly create data silos unless they are fully integrated together or into a central system.

    Why are Data Silos Killing Your Developer Productivity?

    Data silos aren’t only slowing your developers down by limiting their access to the data needed for development. They also put a lot of extra work on their plates. And it goes without saying that this additional time spent on data management reduces the time available for improving your product.

    Management of Redundant Data
    Multiple teams in the organization storing their data separately means increased workloads for developers, who need to update and maintain separate copies of the same data.

    Inconsistent Data Quality
    Data gaps or quality issues happen more frequently since different parts of the organization have their own standards for collecting, cleaning and validating data. This can lead to development delays or errors in the product.

    Time-Consuming Integrations
    Developers have to code a lot of integrations to connect all the different tools your organization uses and keep the data flowing between them.

    Inefficient Collaboration
    When different teams work in silos, the chances of misunderstanding are greater, leading to development delays and misaligned priorities.

    Difficulty in Data Governance
    Maintaining high standards of data privacy, security and compliance is time-consuming when the data is spread out in different silos and can create costly regulatory risks.

    Steps Leaders Can Take to Break Down Data Silos

    Fortunately, there are steps that you can take to break down the data silos in your organization, relieving your developers at the same time. Each step may have its own set of advantages and challenges, so the solutions you choose ultimately depend on your organization’s needs and objectives.

    Create a Unified Data Strategy
    Set clear goals and standards for data collection, storage, management and analysis at the company level. You should also implement data governance and security policies.

    Adjust the Culture
    Foster a culture of collaboration and data sharing across the company by encouraging teams to share data, insights, and best practices across different departments. You can achieve this through regular communication, training and incentives for cross-functional collaboration.

    Establish Cross-Functional Teams
    Bringing together members of different departments to collaborate on data-related projects can prove invaluable. These teams should have a shared understanding of the organization’s data strategy and should be empowered to make decisions about data collection, analysis and sharing.

    Invest in Data Integration and Interoperability
    Invest in tools and technologies that promote data integration and interoperability across different systems and departments. Adopt standard data formats, implement APIs and data connectors or use data integration platforms to make observability collaborative. Make sure that the tools you choose to add to your company have various native integration capabilities to avoid custom integrations as much as possible.

    Congrats, you now know all about data silos and how to break them down! The next step for you is to identify the data silos in your company and put a plan in place to get rid of them. Your employees and coworkers will thank you!

  • There’s No Value in Observability Bloat. Let’s Focus on the Essentials

    There’s No Value in Observability Bloat. Let’s Focus on the Essentials

    The observability market paired with cloud security has been predicted to reach $70B by 2026, but that market prediction is a myth, and I’ll tell you why.

    If observability was a grand buffet and every company needed a feast of features and capabilities of this proportion, maybe this prediction would be valid. But most companies don’t need an over-the-top feast. Legacy APM and observability solutions are serving up an all-you-can-eat buffet when the reality is that most companies only need the essential ingredients to satisfy their observability strategy. And the cost for that can be much more modest. The $70B observability market prediction is, therefore, suspect, considering the true needs of most organizations.

    Complex cloud ecosystems, the rise of applications built on microservices and Kubernetes, and the overall scale and complexity of applications have led to exponentially more data being created in the pursuit of observability. Storing and processing all that data is expensive, and as the volume of data balloons, so does the cost.

    And while the complexity of business-critical systems and the volume of data have scaled, so have the overall cost of those legacy tools—in direct proportion. Partially, this is driven by the features and instrumentation added that only contribute to the bloat and valueless telemetry.

    Customers aren’t seeing value in any of this bloat, and for the most part, all that’s been accomplished is increased complexity in deploying and operating the system, with a commensurate lengthening of time to value. Plus, pricing models haven’t significantly changed despite the advancements in the market. The fact is, organizations can’t really say that they have gotten more insight into the overall performance of their mission-critical systems. What they are saying, however, is that these tools are becoming overwhelming to manage and overwhelmingly expensive, and developer productivity is not increasing.

    What organizations need and want are real-time insights into the health and performance of their cloud infrastructure and applications–specifically the confluence of logs, metrics and traces within the context of modern observability. There is little tolerance for software bugs, slow web experiences, crashed apps and other service interruptions, and the responsibility lies on developers, engineers and ITOps teams to quickly resolve production issues before they impact customer experience.

    There is a call for observability, but rather than an explosion of features and noise, what’s being called for is a narrowing of focus.

    Observability Has an Efficiency Problem

    Telemetry data gathered from the distributed components of modern cloud architectures needs to be centralized and correlated for engineers to gain a complete picture of their environments.

    Engineers need a solution with critical capabilities such as dashboarding, querying and alerting, and AI-based analysis and response, and they need the operation and management of the solution to be streamlined.

    What’s important for them to know is that it’s not necessary to spend more to ensure peak performance and visibility as their environmental complexity grows.

    Legacy players experiencing some maturity in the market may have conditioned them to believe this is true—they have set a standard for higher costs correlating with incremental amounts of data, no matter the quality of that data. Companies are being fed the lie that all this data may be relevant and they’ll be doing themselves a disservice by neglecting even one byte of it.

    Data Does Not Inherently Equal Insights

    No doubt, more data is being generated, but most of it is not relevant or valuable to an organization. Observability can be optimized to bring greater value to customers, and that’s where the market is headed.

    Call it “essential observability.” It’s a disruptive vision to propose a re-architected approach to observability, but what engineers need is a new approach making it easier to surface insights from their telemetry data while deprioritizing low-value data. Costs can be reduced by consuming only the data that enables teams to maintain performance and drive smart business decisions.

    Essential observability is cutting out the fluff and only focusing on—and paying for—the impactful data. It’s about arming engineers with meaningful insights so they can quickly resolve production issues and business disruptions. Organizational performance increases without inflating data complexity and resource consumption.

    The Essential Observability Revolution

    Observability tools have evolved beyond the model of linear price increases as complexity and data scales. For companies (especially growth-stage organizations) that want a partner to help them make more informed decisions and keep their costs more reasonable (i.e., stop recklessly spending for useless data), they need to focus on tools offering them the essentials.

    Solutions are available, offering targeted features and automated capabilities out of the box, delivering the insights needed to understand and fine-tune data. These solutions provide continuous support, reduce complexity and accelerate time to value.

    The next revolution in observability isn’t features and functionality but providing insights to make data-driven decisions that keep essential observability cost-effective while not compromising the value derived.

  • Must You Collect All That?

    Must You Collect All That?

    It is interesting that we no longer consider teams that super-tool their apps as being slightly ‘off’ or, working in a field where systems were mission critical, even life-and-death. Now, we all are collecting and reporting data points in real-time across not just the SDLC, but across the entire environment. It is wild the amount of data available to the average DevOps team about what is going on with their applications. But it’s not all being used.

    No, seriously, it is unreal. Let me offer two anecdotes that explain why I know you’re not using it all.

    Most of my regular readers know that I worked at F5 for years, the first couple on the DevCentral team, doing the Dev part. Their flagship product, the BIG-IP, collected an incredible amount of super-granular data. I am not exaggerating when I say an incredible amount. They had data points from the wire up to the traffic routes through the load balancing algorithm to nodes. And it was (and likely still is) all available to users via APIs. Whatever data was needed about traffic passing through the BIG-IP or the nodes behind the BIG-IP and the connections in between users and those nodes, you could get.

    One of my projects was to offer a simplified interface to the APIs. They were complex and granular, and customers wanted fast and easy, so I was publishing code that worked as an intermediate layer.

    Note: F5’s APIs, like everyone else’s, are far more advanced today than they were then, and it is easier to do what you need to do because they took the “create a user layer” part seriously. It’s complex machinery so it still has complex APIs, but accessibility is way up from those early days.

    Anyway, BIG-IP collected so much data that I could not name all of the fields, let alone when each one was pertinent. I gave up trying after a while, because if a board-level engineer needed a data point, the idea at the time was “Why not expose it?” so ‘number of connections to a given node’ under this algorithm was hidden among things like ‘microseconds to connect to DNS on that connection’ (I’m making those up; it’s been years). Some were terribly useful to end users and others were not. All were accessed in the same way, and learning by experimenting was the only real way to tell the difference.

    Users did not need all of that data. Users did not need the complexity and obfuscation created by supporting all of that unnecessary data.

    My other example is a massive system of interconnected IoT devices that were centrally connected/controlled with a private, specialized network to manage them (actually, there were several different networks on several different mediums, and that matters where data points are concerned).

    When setting this system up, we estimated about half a million IoT devices with capabilities that ranged from passive monitoring to active controllers of physical devices. Four different communications mechanisms, a couple dozen different devices, every major (and a couple minor) databases and command-and-control software on every major OS, managing from a handful to hundreds of thousands. And all of these were super-tooled because the IoT network was mission-critical. Our databases and the infrastructure to support/protect them were a major part of our data center budget because of the amount of data.

    The amount of data was a flood. The management software was developed by different companies with different transports and endpoints in mind, meaning each had a different dataset. Once all of the networks were running satisfactorily, our next immediate project was to create a unified dataset for reporting and troubleshooting. I was in charge of IT, but the top-level person–because each of those half a million devices was a physical install–was a physical engineer. We fought non-stop about what was important. I was trying to map and convert datapoints between systems; he was trying to maximize data available for reporting up. He often said, “Well no, we don’t need that today, but we might.” This put us in a zone where “number of devices on this system” was on par with “attenuation of the communications line to the nodes on this physical subnet.” Totally unworkable, and our compromise was to put together a small IT team to put a layer over all that raw data and offer an intelligent interface side-by-side with data dumps.

    We are there again today. I hear many of my friends in the enterprise space saying, “Because of ML, we might need that data and storage is cheap.” I disagree. Storage is an overhead that is wasted if you are not actively using the data. We are past the “all data is good data” craze; it’s time to adapt. Useful data that expands insights is all you need tooling for. Report data that will help solve problems, and if the team finds tomorrow that it needs a data point that is not currently collected, it can be added in.

    There is room for debate here–the rate of change for ML systems (please stop calling them AI; they’re not, yet, and we’ll need that word when they are cognizant) means that there is a reasonable argument for “all of the data.” And I’m not proposing limiting data collection. Honestly, application security specifically and enterprise IT security overall has benefitted from datapoint sharing between formerly separate market spaces. If the SCA scan shows X framework is used, then the IAST can narrow down tests to those that look at X and not its competitors, for example. But honestly, don’t drown yourself in a data lake when all you need is a fish tank where you can see all the guppies.

    And keep rocking it. Even if you entered IT two years ago, you are now a seasoned vet and things have changed–beyond all of our expectations, I’d say. Yet you’re still plugging away, keeping the enterprise running. Don’t stop—just try to keep the data hoarding to a reasonable level and make sure the data you have is being used, whether as useful feeds to an ML tool or as consumable information for other people/systems.

  • Developers’ Role in Protecting Privacy

    Developers’ Role in Protecting Privacy

    We live in a world where we always expect things to happen seamlessly. Every time somebody walks into a café and signs in to the free WiFi and opens their Instagram or TikTok to stay up-to-date with trends and friends or retrieves a discount from a retailer by joining their newsletter circulation, rarely do they stop to think about how that convenience and value is derived.

    Technology is the key enabler working away in the background, and developers and DevOps teams are making that happen. Underneath the slick interfaces of the apps and websites that provide these highly efficient and personalized experiences is a complex machine that relies on data to fuel it, built by developers and delivered by DevOps teams.

    In many ways, data is a two-way exchange, and those end-users that are aware of this give and take appear to be happy with how the relationship works.

    Indeed, several surveys in recent years suggested that the majority of consumers are happy to share their data with companies if it improves their experience. Furthermore, a significant minority are still comfortable if they have no control over who sees their data, there is no clarity around how data is stored and used, even if the organization in question has a poor reputation for data privacy.

    The Privacy Balancing Act

    So, if most people already accept data trade-offs in some shape or form, should developers still care about building applications and solutions that guarantee data privacy?

    The short answer is yes, but as developers, that involves a tricky balancing act.

    Although sharing data has become commonplace in exchange for benefits and value, consumers are becoming more aware of privacy issues. Take the EU’s General Data Protection Regulations (GDPR) as an example. Over the past five years, awareness has more than doubled in notable European markets such as the UK, Spain, Germany, the Netherlands and France.

    Meanwhile, there is also commercial pressure, as employers rely on developers to innovate to remain profitable. At the same time, customers expect brands to be responsible with their data, and failure to do so at the expense of trying to commercialize a new application could be detrimental. Indeed, while the pandemic may have ushered in significant changes and altered consumers’ attitudes toward data privacy, end users remain unwavering about the importance of security.

    Maintaining this balancing act is becoming increasingly complex to achieve. However, the question of data privacy is becoming a key business priority, and that means developers have a big opportunity to show their commercial value to their organizations. Indeed, companies cannot afford to get the balance wrong, and developers are central to creating the perfect formula.

    In fact, the privacy conundrum has been around for a long time.

    When the internet was created, privacy was not considered an issue because all content accessed online was deemed to be public. Nothing was encrypted; the introduction of email complicated things, not least because anybody on the internet could, theoretically, intercept personal data and read private messages.

    This prompted the emergence of the cypherpunks, a group of cryptographers who began to contemplate what the future of digital privacy might and should look like. They started to create the tools they believed the world needed to safeguard data privacy–today, their mission is carried on by developers who value user privacy.

    Why Developers Need to Be Familiar With FHE

    However, securing the transmission of data is not enough, as many breaches still occur because data isn’t encrypted during processing.

    So, in a world where more and more data needs to be shared to deliver the sort of experiences consumers expect, is it inevitable that privacy and security will be compromised as the volume of data exchanges grows? Not necessarily.

    Fully homomorphic encryption (FHE) offers a solution, allowing developers to build applications and run services without needing to see or secure the underlying data. This is because FHE enables data to be processed blindly without having to decrypt it at any stage. FHE offers a way for developers to maintain that all-important balancing act between maintaining privacy and offering value to both business and customer.

    In FHE, to guarantee a user’s data privacy, all data is encrypted by the user with their own secret key. Users of a particular service, such as an online medical portal, will use a secret key to send their encrypted data to a server where blind processing takes place. The result is also encrypted and sent back, the user again using their secret key to decrypt the information.

    What this means is that, because data is encrypted end-to-end, the company providing the service can do so in a way that keeps the same customer experience, even though they cannot see the data that is being shared and sent back. From a security perspective, this is also critical. Governments, attackers and service providers cannot see the exchanged information because they do not possess the key–they also cannot break it, as the encryption used in FHE can resist attempts made even by powerful quantum computers.

    Privacy can also be protected during larger-scale data exchanges that underpin collaboration between organizations and nation-states on numerous strategic programs, with each contributor able to add their value knowing that their intellectual property and sensitive information is not compromised.

    Looking ahead, if developers can embed FHE into their practices on a broad scale, then a key milestone for privacy is within reach. Rather than being viewed as an objective relating to digital interactions, privacy can be treated as a naturally occurring by-product of every application, piece of software and service that the developer community creates.

  • The Tragedy of the Data Commons: Balancing Innovation With Risk

    The Tragedy of the Data Commons: Balancing Innovation With Risk

    Clean drinking water and fisheries are classic examples of the “tragedy of the commons,” the problem in economics and ecology where an individual is incentivized to consume as much of a shared resource as possible at the expense of the larger society. With fisheries, for example, a logical fisherman would like to make as many catches as possible. However, this can ruin the environment for everyone, as overfishing can endanger an entire species and even threatens whole ecosystems. The modern IT environment has given us a new case to consider related to the tragedy of the commons: Data.

    Data, much like drinking water, is a critical resource. Developers need to use this data and, logically, they want to use it as much as possible to build innovative applications and products. However, too much data flowing around a modern distributed enterprise environment carries risks to the larger company.

    The data developers use often includes customers’ personal data like names and birth dates. The risks of this information being damaged or stolen can be catastrophic. This is where database administrators (DBAs), who are tasked with managing and securing this data, come in. There is an inherent tension between developers, who want as much access as possible, and DBAs, who want to limit that access for security and privacy reasons. How data is used within an enterprise is critical, because it must be used to create new solutions and be kept secure. An overly open data policy could lead to breaches and leaks, while an overly restrictive policy limits innovation.

    Thankfully, there is a solution that is helping ease this tension. Observability can automatically analyze massive amounts of information across a business’s entire IT environment. Users can use it to pinpoint the causes of outages or performance issues and receive actionable insights to resolve these problems quickly. Modern observability solutions even use AI to predict and proactively prevent problems before they occur. DBAs and developers can use observability to strike a balance while boosting innovation and improving productivity. Here are the three biggest ways that observability can solve the tragedy of the data commons and ease the tension between DBAs and developers.

    Ensuring Data is Secure

    One of the biggest concerns that DBAs have regarding data access is security. Sensitive production data are no longer stored exclusively on a company’s on-premise servers, where DBAs have full visibility into how it is being used and who has access. Instead, it is now stored across various private and public clouds as well as on-premises, which has reduced visibility for DBAs.

    This sensitive data is the same information that developers often need to build and launch applications in a continuous delivery model, where developers build software in short cycles so it can be released at any time. This involves working across different clouds, including AWS and Azure, while leveraging complicated cloud-enabled technologies like microservices and Docker containers. When data is deployed across multiple clouds, the attack surface increases while visibility decreases, leading to new security concerns.

    Observability provides DBAs with a better understanding of how data is being used by developer teams so they can more easily ensure that the data remains secure and protected. Additionally, many modern IT environments deploy threat intelligence solutions that observe actions and detect threat signals to help predict security incidents and respond before they happen. Some threat intelligence applications are powered by AI, which can automatically gather and organize complex log data from the entire network. This data is then compared with an out-of-the-box threat database, helping to detect suspicious activity early. Observability and threat intelligence working in tandem provide a comprehensive overview to help relieve some of the security concerns for DBAs and create a more secure environment for data to be shared between teams.

    Remaining Data Compliant

    Ensuring that data is compliant is top of mind for every organization. Compliance regulations such as GDPR, CCPA and HIPAA carry severe penalties for data leaks, meaning that companies must maintain the integrity and availability of sensitive and regulated data.

    Ensuring compliance while managing requests for information from developers working across geographies and clouds can be a daunting task for DBAs. Not only must they remain compliant, but many businesses must demonstrate continuous compliance, which is only possible using complex, dynamic and automated systems.

    Observability allows teams to clearly see and follow the complex flow of data as it moves between DBAs, developers and other teams. Additionally, observability can be deployed to help ensure that any sensitive data that is required to be anonymized is done so before it is shared. DBAs can further use observability to track the lineage of data as it moves between teams to monitor that it is not changed or transformed in any way that risks a compliance violation. Making compliance a regular part of the IT environment should not be viewed as a burden. In fact, it provides many benefits, including improving data quality, which can be used to further innovate and build better products.

    Making Teams More Productive

    Observability has shown it can create harmony between DBAs and developers by helping mitigate security and compliance concerns. Not only is it addressing these issues, but it is being used to make each team more productive on their own.

    For DBAs, this means gaining additional insights that help ensure applications and services are running properly. Observability collects information from across hybrid and multi-cloud environments and presents it in a single view to allow DBAs to respond quickly and resolve issues. When DBAs gain the insights that observability provides, they can better manage critical data and anticipate future problems before they arise.

    Observability is key to helping developers build applications as productively as possible. The ongoing shift left has necessitated the use of observability as a way to gain single-pane-of-glass visibility into the build process. Developers are also provided insights into the performance of web applications and can move quickly to address any problems. Finally, observability is improving the speed at which teams can innovate, as it provides live code profiling that can be used to predict and prevent future problems.

    Observability provides a real solution to ensure that data is not a resource that falls victim to the tragedy of commons, where its use can harm an entire organization. Instead, it is powering teams to use data securely to work more productively and build innovative applications.

  • How to Choose an Observability Data Pipeline

    How to Choose an Observability Data Pipeline

    A complete full-stack observability platform combines data from multiple sources to gain holistic insights into system behavior. In fact, organizations without a full observability solution could find themselves facing departmental silos since teams with different data sources cannot share insights.

    While a key step in observability is the ability to combine logging data with metrics, companies that have developers viewing logging data and their metrics elsewhere are not collaborating on their data in the way observability requires. The solution is an observability data pipeline that best fits your business needs.

    What is an Observability Data Pipeline?

    An observability data pipeline does two things—centralizes data from a number of different sources and provides teams with the right tools to turn data into business insights. Observability data pipelines are typically user-friendly so that you can easily set up and manage your data.

    Observability data pipelines integrate data from a range of sources, including AWS, FluentD and Kubernetes. They have capabilities for searching and viewing log data and notifying engineers through email and even Slack.

    An observability pipeline ingests logs, so they can be viewed in a log viewer. Pipelines can also analyze data in real-time, allowing engineers to quickly spot critical security issues before they affect critical systems.

    There are a number of full-stack observability platforms, including Coralogix, Splunk, Elastic and even options like Azure Log Analytics and Google Cloud Logging. Coralogix, for example, is a popular observability data pipeline that can analyze data in real-time using Streama and use Kafka Connect to integrate data from a variety of sources and extract trends.

    Business Benefits of Observability Data Pipelines

    Using observability data pipelines has the potential to transform the way a business does DevOps. Let’s go through a few key benefits of this technology:

    ● Reducing Cost of Observability Data
    Many organizations use systems like Cloudwatch to analyze logging data. However, these often charge per GB of logging data analyzed, raising the question of whether Cloudwatch is really cost-efficient. And it’s not just Cloudwatch. For many systems, logging costs can be increased due to slow query times, noisy logs and the wrong type of storage. Observability data pipelines help organizations manage high volumes of logging data and move away from expensive legacy platforms. This enables enterprises to increase their observability for a modest price.
    ● Reduced Onboarding, Increased Problem-Solving
    Pipelines are straightforward to learn. Unlike options such as ELK, which can be quite specialized and difficult to maintain, observability data pipelines are easy to use and easy to set up. This reduces the time needed to onboard new engineers. Less time onboarding means more time solving problems and serving clients, which increases business revenue.
    ● Better Data Shaping and Merging
    Data from different sources is often stored in multiple formats and structures. Because observability depends so much on well-integrated data, it’s vital to transform this data into standardized formats. Observability data pipelines use log parsing to store key features of logging data for search and analysis.
    ● Reducing MTTD/MTTR
    Having an optimized, user-friendly observability data pipeline reduces downtime by helping engineers solve problems faster.
    ● Enabling DevSecOps With Observability
    We’ve written about the rising prominence of DevSecOps, a paradigm that involves shifting security left in the development life cycle. Key to DevSecOps is the fruitful collaboration between DevOps and Security. This can only be achieved by high levels of observability. Observability data pipelines facilitate this with their ability to integrate data from multiple different sources and present it intuitively. This means security teams can apply their expertise to log analytics that would otherwise have remained siloed.

    Wrapping Up

    Observability, the ability to use logs, traces and metrics to “picture” the internal state of a system, is vital to any DevOps team. Observability data pipelines can help by integrating and presenting data from different sources. This mitigates the effects of organizational silos and allows DevOps teams to solve problems faster.

  • Quick Guide to Azure Storage Pricing

    Quick Guide to Azure Storage Pricing

    Azure Storage is a cloud-based storage service from Microsoft Azure. It provides a scalable, secure and highly available data storage solution for businesses of any size.

    The platform includes various services such as Azure Blob, which is a service for storing large amounts of unstructured data such as documents, images, videos and backups. Azure Files is a fully managed file share service for cloud-based applications. Azure Tables is a NoSQL key-value store used to store semi-structured data. Azure Queues is a messaging service used to store and process messages between applications or services.

    Finally, Azure Disks is a service that allows you to store and manage data in virtual hard disks used in virtual machines. With Azure Storage, businesses can easily manage their data, control access and scale their storage as per their needs without worrying about hardware or infrastructure management.

    How does Azure charge for storage space (bandwidth, capacity, number of transactions and quantity of transferred data)? What are the usage factors impacting Azure Storage fees: Region, account, access tier, replicas, egress?

    How Azure Storage Pricing Works

    Azure pricing for its storage services is based on several factors including storage capacity, data transfers and transaction counts. The cost of storage varies depending on the region and access tier selected, as well as the type of storage being used.

    For Azure Blob Storage, customers are charged for storage capacity, data egress (outbound data transfers) and the number of transactions (read, write and list operations).

    Azure Table Storage charges are based on the number of table entities stored and the amount of data transferred. Azure Queues are charged per transaction and data transfer, while Azure Disks are billed based on the provisioned capacity and the number of transactions.

    Several usage factors can impact Azure Storage fees, including the region where the data is stored, the storage account type, the access tier selected, the number of replicas and the amount of data transferred out of the storage account. 

    Overview of Azure Storage Pricing

    Blob Storage

    Azure Blob Storage pricing varies depending on the storage tier, data volume and whether customers opt for pay-as-you-go or reserved capacity.

    For pay-as-you-go pricing, Premium storage is charged at a flat rate of $0.015 per GB/month, while Cool and Archive storage are billed at $0.01 and $0.0099 per GB/month, respectively, regardless of data volume. Hot storage costs $0.018 per GB /month for the first 50 TB with the rate gradually decreasing with higher usage. For instance, customers who consume more than 500 TB/month pay $0.0166 per GB.

    Customers can also reserve blob storage in 100-TB or 1-PB blocks for one or three years. The prices for reserved storage vary by tier. A three-year Archive storage reservation costs $84 per 100 TB or $810 per PB/month, while Hot storage costs $1,244 per 100 TB/month for three years. For one-year reservations, Archive storage costs $91 per 100 TB or $883 per PB/month, and Hot storage costs $1,545 per 100 TB/month. For a one-year reservation, the cost of Hot storage is $15,050 per PB/month, and $11,963 per month for three years.

    Files

    Microsoft charges customers for Azure Files depending on the storage tier and whether they reserve storage capacity. Pay-as-you-go pricing ranges from $0.015 per GB/month for Cool storage to $0.016 per provisioned GiB/month for Premium file storage.

    Customers can commit to reserved storage capacity in increments of 10 TiB or 100 TiB for one or three years. A three-year reservation of 10 TiB Cool storage costs $101.39 per month, while one year costs $125.92 per month. However, the price increases significantly for the Premium offerings, with a three-year reservation of 10 TiB costing $1,081.34 per month and a one-year reservation costing $1,343.50 per month. 100 TiB reservations range from $983/month in the Cool tier for three years to $12,779.50/month in the Premium tier for one year.

    Nevertheless, there are other fees that add to the total cost such as read and write transactions, snapshots, metadata storage and early file deletion fees. These ancillary fees can impact the overall cost of using Azure Files and customers should account for them when estimating their expenses.

    Tables

    Azure Tables pricing is available in various tiers, including locally redundant storage (LRS), geo-redundant storage (GRS), read-access geo-redundant storage (RA-GRS), zone-redundant storage and geo-zone-redundant storage. 

    Customers are charged between $0.045 per GB/month for LRS and $0.01265 per GB/month for geozone-redundant read-only storage. Additionally, Microsoft charges a $0.0036 fee for each set of 10,000 transactions made on Azure Tables.

    Queues

    Compared to Blob and File Storage, the pricing model for Azure Queues is more straightforward. Customers are charged 4.5 cents to $0.075 cents per GB/month, depending on whether they choose local redundant storage (LRS) or read-access geozone-redundant storage (RA-GRS). Additionally, there is a $0.004 fee for every set of 10,000 operations in Class 1 and 2.

    Managed Disks

    Azure Managed Disks have numerous pricing options that can be overwhelming. The cost of using Managed Disks depends on several factors, including the disk size, performance, reservation period, capacity and disk type.

    The cheapest option for Managed Disks is the P1 disk, which costs $0.6 per month for 4 GiB of capacity in addition to $0.03 per mount/month. On the other hand, the P80 disk is the most expensive option, as it has a 32 TiB capacity costing $3,276.80 per month, in addition to $219/mount. However, the cost of a P80 disk can be reduced to $3,113/month (plus the $219/mount fee) with a reservation of one year.

    Azure Storage Vs. AWS Storage Pricing

    Here is a comparison of the pricing for similar storage services offered by Azure and AWS. As part of an Azure or AWS cost optimization strategy, you might consider combining services from both providers.

    Block Storage

    Amazon EBS is Amazon EC2’s basic storage device, with a price of $0.045 per GB for HDD and $0.10 per GB for SDD, with higher IOPS resulting in higher prices. The free tier includes 30 GB of SDD.

    For comparable regions in the U.S., Azure charges $0.05 per GB for HDD and $19.71 for 128 GB of SSD per month.

    Azure Managed Disks offer greater flexibility and easier backup than Azure Virtual Disks or Amazon EBS, with adjustable volume sizes and available IOPS. Managed Disks pricing starts at $19/month for a 128 GB disk, providing 500 IOPS.

    Object Storage

    Amazon S3 and Azure Blob Storage are both scalable services for storing objects (unstructured data) where data is stored together and cannot be changed in parts. Prices vary depending on the region, but for a comparable region in the U.S., Amazon S3 storage costs $0.023 per GB/month for the first 50 TB in addition to network usage fees. The free tier offers 5 GB of storage, while archive storage (Glacier) is $0.004 per GB/month.

    Azure Blob Storage starts at $0.0184 per GB/month for hot storage, although prices decrease to $0.01 per GB per month for cool storage and $0.002 for archive storage. Prices for both services increase for greater redundancy. 

    File Storage

    Amazon Elastic File System (EFS) is an equivalent service to Azure File storage and allows users to mount files to Amazon EC2 servers. It uses NFS V4.0/4.2 to mount files and is not available in all AWS regions (currently, four are supported), requiring a Direct Connect line or VPN for on-premises mounting.

    For a comparable U.S. region, Amazon EFS costs $0.30 per GB/month and the free tier offers 5GB on sign-up. Azure File Storage prices start at $0.06 per GB/month for local redundant storage, with prices increasing for more distributed redundancy setups. It is worth noting that both Azure and AWS charge additional fees for data access.

    Conclusion

    In conclusion, Azure Storage offers a range of services for storing and managing data in the cloud, each with its own pricing structure. While the pricing varies based on several factors including storage capacity, data transfers and transaction counts, it is essential to consider other usage factors, such as region, account, access tier, replicas and egress. 

    Customers should review these factors carefully and estimate their expenses to select the right storage service that meets their needs and budget. By doing so, they can leverage Azure Storage’s flexibility and scalability to store and manage their data efficiently in the cloud.