Tag: data science

  • Logz.io Launches COVID-19 Dashboard

    Logz.io Launches COVID-19 Dashboard

    Logz.io this week launched a Community COVID-19 Dashboard Project that seeks to provide software developers and data scientists a reliable source of data to assess the global impact of the pandemic.

    Dotan Horovits, product evangelist for Logz.io, said the goal is to help organizations make sense of often conflicting data by making it accessible using a publicly available dashboard based on open source Kibana software. The data itself is stored in an ElasticSearch repository, he said.

    Logz.io also plans to make the data accessible via a dashboard based on open source Grafana software to make it easier to navigate time-series data, he added.

    Horovits acknowledges that the data concerning the COVID-19 pandemic is fluid at best. However, over time it will become easier to identify suspect data by applying analytics. Much of the COVID-19 data being made available is well-formatted, he said; the challenge is simply finding a way to aggregate that data in a way that is accessible to a broad range of potential end users.

    In the short term, Loz.io envisions organizations such as first responders using the dashboard to help optimize the deployment of limited resources. Longer-term, that data can also be employed to assess the impact the pandemic has had on everything from the environment and the economy to the mental health of individuals living in different regions. At the very least, access could go a long way to reducing the amount of COVID-19 misinformation being spread, Horovits added.

    Logz.io started with the COVID-19 data available from Johns Hopkins University. On top of that core set, the company is moving to aggregate data made available from additional public sources including media, governments and the World Health Organization (WHO). The company is also inviting any organization that has aggregated COVID-19 data to contribute to the project.

    Many organizations will, of course, use the data provided by Logz.io and similar initiatives to build a wide range of analytics applications. For example, it may be possible to avert future pandemics by identifying areas where individuals are experiencing high fevers sooner. Given the importance of those applications, it’s probable most of them will need to be built using best DevOps practices to ensure timely delivery.

    It’s not clear how the pandemic may advance data science. Organizations have been leveraging big data analytics applications for years. However, the pandemic may lead to more ambitious efforts to aggregate and analyze medical data on a global basis. Arguably, it’s been the absence of reliable data that has enabled the virus to spread so widely. Otherwise, initiatives such as social distancing might have been enforced earlier and medical facilities would have been outfitted with more equipment.

    In the meantime, there may not be much most IT professionals can do to combat the current pandemic other than working from home much like everyone else. However, in terms of preventing the next one, the level of data science expertise being applied to virus research may soon become a matter of life and death for millions of people.

    — Mike Vizard

  • DataOps and Beyond: How DevOps Methodology Transformed Our Approach to Data Science

    DataOps and Beyond: How DevOps Methodology Transformed Our Approach to Data Science

    The DevOps methodology has become synonymous with forward technical thinking–a workplace culture that reinforces best cultural practice and promotes more, better quality output by synchronizing the functions of development and operations teams. As a testament to its popularity, the term has expanded in reach to refer to a broader set of transformational software-related practices. The list continues to grow: DevTestOps, DevSecOps, GitOps, DataOps. 

    In 2020, organizations are drawing upon thousands—if not tens of thousands—of data sources, which exist in hundreds of different formats and fall under unique sets of restrictions and compliance regulations. Figuring out where all this data comes from, what it means and how to ensure that the right teams can access it when they need to, are common data management challenges. To address these challenges, some solutions were borrowed from effective practices in software development; automating analytics for improved quality, and allowing data scientists to shift away from time-consuming tasks to focus on value-adding projects instead. 

    What happens when software development and deployment methods are applied to processing and integrating data? Does that mean that DataOps is exactly like DevOps, but for data? And what benefits do organizations expect from adopting this approach to data management?

    The xOps Mindset

    At their core, the ops practices are linked by fundamental characteristics that shape their goals and practices. Let’s explore some of these commonalities:

    • xOps ties together workflows from create to run: In an ideal environment, production and distribution don’t function as separate entities, but are synchronized to meet target metrics that can include hundreds, or thousands, of daily deployments. Culture changes have rewritten rules around internal communication and feedback loops in a development environment where the conditions or requirements for success are constantly changing.
    • xOps automates the mundane (non-creative) tasks: Automation not only increases an organization’s agility, but when executed correctly can eliminate communication gaps between teams—for instance, automating traceability and issue tracking within code changes. Within larger, more complex projects, automation can save on time and cost by executing and managing CI/CD—ensuring that software builds and changes reach their designated target environment with little to no human involvement.
    • xOps builds in best practice: Equally as important to the functions they perform, xOps tooling plays a key role in building in best practice from the top down and bottom up. Best practice might not look identical between organizations, but the common goal is delivering value for a range of stakeholders through continuous production, in an environment where it’s encouraged to learn through experimentation and to respond to problems as they occur.

    In short, DataOps loosely applies the DevOps process to data pipelines—using automation and Agile methodology to reduce the amount of time spent fixing issues in pipelines, and to get data science models into production quicker. There are also some obvious differences between DataOps and DevOps. While DevOps refers to the collaborative process between two technical teams, DataOps facilitates cooperation between data analysts, engineers, scientists and any members of an organization who use data. This makes DataOps a much more multifaceted process than its DevOps cousin. 

    xOps for the Big Data Age: Benefits of Running DataOps 

    We know that for many organizations, converting raw data into usable, accessible and relevant (that is, profitable) business intelligence has given rise to a plethora of data management issues. The sheer volume of most enterprise level datasets has simply outgrown many of the inadequate older systems and processes built to manage it, and we continue to produce new data at stunning rates. There is a general consensus among data scientists today that the amount of data in the world doubles every 12 months.  

    • Automation and Continuity: Within an organization, business data moves through a set process—akin to the software lifecycle for the DevOps analogy—where data is ingested in one form and exits in another. Engineers must build data pipelines, test them and change them before they are deployed. By adopting the standards for automation and best practices outlined above, you’ll ideally have a constant stream of data flowing through a pipeline. This unlocks the potential to obtain real-time insights from data, shortening the length of time it takes to turn raw data into valuable business information.
    • Cultural Shift: When completed correctly, DataOps changes who within an organization becomes a data user. A higher level of transparency and an assurance of quality means that data is more openly available to decision makers within non-technical teams. Consider the business value-add for a sales team who wants to expand into new markets and are able to access a wealth of customer data.
    • Machine Learning: We talked about the role of feedback loops in the xOps mindset. When machine learning modelling meets this mindset, you improve the quality of the model being produced because you’re unlocking a higher quality of data through version control, continuous integration and continuous deployment. Improved insights in machine learning offer nearly unlimited potential for extracting value from DataOps.

    — Hannah Leslie

  • Becoming a Data Company: Back to the Future

    Becoming a Data Company: Back to the Future

    Transformations are complex, and it’s often difficult to see the big picture when you’re in the middle of one. 

    The elegance of the end-state of harmonious synergy between software and data belie the complexity and chaos of the transition we find ourselves in the midst of. Not that long ago, there was a general balance between the pace and sophistication of software delivery and the speed and maturity of data analysis. Markets and customer bases grew steadily allowing organizations to keep pace in their software and data competencies to handle increasing mutual scope and complexity.  

    However, the consumerization of IT—the ability of lay consumers to consume sophisticated software experiences from browsers and mobile devices—unleashed access to a massive, eager and demanding customer base measured in the billions. This gave birth to the current wave of digital transformation. Along with it came the race to get to market, i.e. build and deliver high-quality software exponentially faster, in order to capitalize on massive global opportunity.

    Innovation thus started in the software domain. With faster, better software came the need for purpose-built data stores (document databases, graph databases, etc.), the need to manage the velocity, volume and variety of data collected from millions (or billions) of users and the need to extract insights and value fast enough to further fuel the pace of software innovation. Thus, software innovation planted the seeds for the current focus on data innovation.

    While the innovators quickly traversed this software journey, most enterprises are only now fully in the midst of embracing new software methodologies and technologies to deliver software quickly and effectively. Those enterprises at the vanguard of the software journey are now embarking on the data journey—to find ways to safely and quickly harness the value locked away in enterprise data assets. This includes everything from analytics to rapid provisioning of copies of production data for software testing. In fact, 451 Research states 86% of companies that consider themselves mature in DevOps journey are planning on increasing their investment in DataOps. That is, companies that have traversed the software competency curve are now embarking on the data competency curve.

    The Dawn of the CDO

    The growing traction by data science, AI, analytics and DataOps technologies and vendors point to the rising importance of developing a data competency. The recent emergence of the Chief Data Officer (CDO) is the culmination of this trend. 

    Given the nascent focus on data at most enterprises, most CDOs are still grappling with defining their role, navigating the dynamics of the C-Suite, defending against regulatory and compliance risk and justifying their role by identifying growth opportunities. Despite these immediate challenges, they do have one thing going for them: they know they’re in the midst of mind-bending change, have the benefit of hindsight on the software journey and the many parallels it carries, and are mentally prepared for the organizational, technological and cultural changes that will need to be navigated. Most companies were stunned by the sheer suddenness and velocity of change that came with the DevOps and the software transformation journey. With DataOps and the data journey, they are now aware, prepared and committed to the associated journey and changes for the long haul. They can be proactive and avoid being reactive.

    Planning for the DataOps Era

    As cycle times for going to market and learning from the markets shorten, and innovation cycles accelerate, CDOs can expect that data-centric organizations will need to drive net-new top and bottom-line results without incurring undue risk. This will come through adoption of new technologies, organizational structures, cultures and workflows. New roles focused on data-centric activities, and new forms of collaboration between different personas will emerge. 

    In the modern enterprise, production will no longer be the most important data environment in enterprises. There is a growing need for fast access to secure, governed data outside of production—where the work of the rest (non-IT part) of the enterprise is centered. What used to be non-prod for IT will now be prod for the rest of the enterprise. To succeed, IT will need to deliver data quickly and securely to the rest of the organization or even across organizational boundaries to partners and other ecosystem players. Embracing collaborative processes and workflows that support this new pattern of enterprise operation will be critical. Enter DataOps—the unique mix of people, process and technology approaches required across teams in an organization to become agile with data.

    Given the similarities outlined earlier of the data journey to the software journey, organizations’ DataOps journey can benefit from the lessons learned in their DevOps journey. For instance,  developing a data competency will require new layers of organization and workflow patterns supported by corresponding technologies. Proactively planning and laying down infrastructure for DataOps will yield far better results rather than adopting technologies ad hoc until a data competency blueprint emerges through trial and error. 

    Building a Data Company Technology Stack

    As with any complex shift, it makes sense to deconstruct data competency into a series of layered capabilities, each building on the one that came before, that together help develop a sophisticated competency. For example, when building their software competency, in order to apply software in sophisticated ways, (e.g., cloud native architectures and microservices), organizations needed to manage distributed software elements (e.g., scale, heal, monitor) which in turn relied on the ability to test and deploy incrementally, consistently and rapidly. 

    A similar approach can be applied to data. Building collaborative processes around appropriate technological tooling can yield layered component capabilities that collectively define a sophisticated data competency. While the layering was emergent in the software journey, CDOs have the opportunity to be deliberate rather than reactive in developing a layered approach as the diagram below illustrates. 

    At the foundation of a successful data competency lies the capability to deliver data anywhere in the organization and secure it to meet regulatory and compliance mandates. Being able to quickly secure and move any type of enterprise data across a hybrid cloud context is hard work, but also table stakes for basic data management hygiene. These are critical prerequisites and this foundation needs to be solid in order to support the layers above. 

    Next, there are various data management activities to master, such as the self-service access, governance, data catalogs, data cleansing, collaboration and versioning, etc. These define the next level of data competency and must be mastered before data can be applied in different ways, e.g. in machine learning, test data management, analytics, data science, etc. 

    A thoughtful, layered approach to building a data company requires building the right abstractions between layers and will avoid tool sprawl consisting of a mesh of ad hoc point solutions that inevitably require human glue to drive data workflows.  

    CDOs should evaluate their organization’s needs through such a structured lens to evaluate the organization’s needs. Each of the activities will bring with them ecosystems of vendors, engendering further evaluation of vendor capabilities. Critical questions to ask include (among many): Is the solution enterprise ready? Does it work with all your data sources across hybrid cloud? Will it evolve with your changing needs? How will it interoperate with other solutions? Can it be automated?

    As CDOs think through these infrastructure investments to connect different parts of the enterprise, the similarity to laying down railroad tracks to connect a large country are unmistakable and perhaps instructive: the resilience and stability of lower layers enable flexibility, variety and innovation at the higher levels just like the simplicity and reliability of simple railroad tracks enables running electric, steam engines, luxury bogies and cargo bogies alike. 

    Toward a Data Company

    The refrain of digital transformation has been that every company is a software company. But to complete the transformation, every company must also become a data company. Software development practices and tools have evolved significantly in the last decade. We’re in the early stages of a similar evolution in data practices and tools that will take us through the next decade. The symmetry and coupling between software and data is unmistakable and there is much to be learned from the software journey.

    As CDOs, CIOs and CEOs plan the transformation of their enterprises in this new era, they will need to consider building a foundation for their data competency that is stable, resilient, compatible with their software development processes and adaptable to inevitable change. They should be prepared to deliver their data from where it is produced to where it is used throughout the enterprise.

    The data company is an organization where data is treated not just as a byproduct of operations, but as the lifeblood of the organization—that drives software development, improves quality assurance, informs decision making and potentially generates revenue in its own right.

    — Karun Bakshi

  • Becoming a Data Company: A Tale of Two Trends

    Becoming a Data Company: A Tale of Two Trends

    Data is back, baby! Well, that seems like an odd statement. It never quite left. Nevertheless, Google’s recent acquisition of Looker and Salesforce’s acquisition of Tableau seems to highlight this mindset in magnified ways. With eyes set on new leaps in data science and artificial intelligence, it’s easy to understand how our views on data now feel like a shifting pendulum.

    The theme of the last decade was “every company is a software company,” driven by ready compute availability from cloud platforms. In the coming decade, it will be time for our data practices to catch up with the ongoing revolution in software development practices–or in other words–for “every company to become a data company.”

    Over the past few months, as I have conferred with customers, attended conferences and connected with colleagues, there’s a perception of growing vigor in data conversations. Developing a data competency is rapidly growing in importance to business now, just as establishing a software competency became a priority 10 years ago.

    However, my most curious observation has been the discussions around data and software are insular. Conversations either focus on how to move, manage, cleanse and leverage data for analytics, or how to build and release high-quality software quickly. The people who hold these conversations are either data people or software people who live in isolated worlds, seem to have divergent concerns and connect only at the lowest common denominator–the database storage–when the software guy or gal needs to store the data somewhere. There is little talk of the deeper connection and synergy between the two worlds and how it relates to larger trends.

    The Next Wave of Digital Transformation

    If you zoom out a bit, there’s more than meets the eye. There is an elegant symmetry between the software and data worlds, and it alludes to how the modern enterprise will morph in the age of digital transformation. Just as functions and organizations were reshaped to support new cultural and technology trends such as DevOps, organizations shall be reshaped in a data-first world, too. As software competency grows and matures, the need to acquire data competency becomes more urgent. What seem like separate trends are a maturing continuation of the uber trend of digital transformation, an attempt to acquire competencies in software and data (and necessarily so in that order).

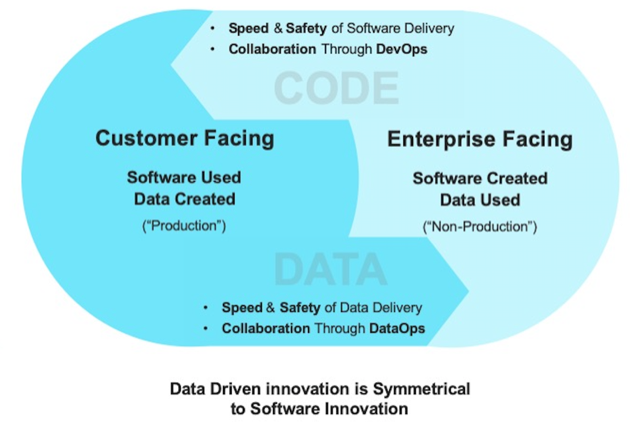
    As the diagram below shows, enterprises have been pursuing a journey of developing a software competency and becoming software companies. Those that make sufficient progress in software competency quickly realize that the significantly increased data they now have acquired requires new competencies to harvest and extract value from it. A data competency becomes necessary to completing digital transformation and so begins the journey to becoming a data company. Software and data are two sides of the same coin of digital transformation with the echoing resonance of reassuringly familiar themes. The diagram below highlights some of these.

    Mirror, Mirror on the Wall

    Speed and safety are central drivers in both competencies. The DevOps movement was driven by these two (often at odds) requirements to deliver software quickly from development to production without breaking the production deployment by ensuring that what is traditionally known as “non-production” accurately mimicked production. The goal is to build and test code so when it is deployed to production it doesn’t break what is already working.

    In the data context, as more organizations understand the value of their data, they realize the importance of speed to get data quickly from where it is produced (production) to those that need it (outside of production, i.e. non-production). Safety in the data context is not just about not disrupting production while extracting that data, but also about meeting regulations and remaining compliant with data privacy policies in the process.

    The elegant symmetry here is further accentuated by the fact that while the primary concern in the software context has been around getting software from internal development environments to customer-facing production environments, in the data context, the concern is getting data from customer-facing production environments to internal  non-production environments. This completes the virtuous cycle of experimentation and learning that modern enterprises must master (see below) in their journey of digital transformation. It requires that organizations rapidly iterate to product-market fit through trial (software release) and learning (data science, analytics, machine learning) and back again.

    In this way, digital transformation becomes a virtuous cycle driven by the complementary movements of DevOps and DataOps–the cultural movements, philosophies, technologies and collaborations that underpin the software and data journeys respectively, and the primary drivers of organizational metamorphosis that enterprises are undergoing during the digital transformation journey.

    — Karun Bakshi

  • How In-Memory Analytics is Solving Data Woes

    How In-Memory Analytics is Solving Data Woes

    The importance of data to business decisions and operations cannot be understated. On a daily basis, 2.5 quintillion bytes of data is generated. Managing that much data so the necessary intelligence is easily accessible or to make sure insights are not missed, can be incredibly challenging. Luckily, technology does exist that can help to significantly ease the strain of this deluge of data: in-memory analytics.

    Initially adopted by the finance industry—where complex, on-the-fly decision-making is required–in-memory analytics is incredibly adept at handling the analysis of substantial amounts of data very quickly. And as data more ubiquitous, and the development of public cloud services has made specialized hardware affordable to companies of all sizes, in-memory analytics technology is being applied in a variety of verticals from retail, to supply chain to healthcare. In addition, given in-memory computing enables a range of analytics features that are very useful to businesses of all kinds and extremely difficult to achieve with disk-based platforms, the technology is really poised to expand rapidly.

    Slice and Dice Any Which Way

    One of the hardest parts of being a data professional today is leveraging all the data at your disposal. Unfortunately, business intelligence (BI) pros are often constrained in terms of what portion of the company’s data they can and cannot analyze depending on pre-defined data queries and the limitations of their BI tools.

    In-memory analytics, however, enables analysts to explore data without any of those limitations. This creates an experience of train-of-thought analysis that helps businesses make deeper analyses and uncover valuable new insights into their market and their own performance. This means retailers for example, can have a global, precise view of the market and cross-reference data from sales numbers, client receipts and loyalty programs, to develop a better understanding of what customers expect from them.

    Figuring Out “What If?”

    Due to the vast amount of data involved, and the limitations of physical storage discs, the calculation of the impact of any business decision on complex KPIs can take a long time to resolve.

    By utilizing in-memory analytics BI pros can continuously compare and contrast “What If” scenarios—such as running stress tests for financial institutions or setting up disruption test cases for supply chain businesses—with a clear, immediate view of the potential outcomes, so they can be as prepared for the future as possible. This means businesses are able to limit the amount of times they are caught off guard or mitigate the impacts of any unexpected turns.

    Up-to-Date Data

    With how rapidly the world moves today, having data that is as current as possible is pivotal. Static datasets only updated once or twice a day can lead to significant, costly misjudgments in some cases. In-memory analytics on the other hand can support a continuous stream of data from multiple sources so analysts always work with the most relevant set of data. This means supply chain businesses, for example, can have real-time oversight over operations to better cope with any disruption that occurs and ultimately save millions of dollars in potential losses.

    The boom of data science has opened a new field of use cases for in-memory analytics, ranging from the validation of new algorithms derived from ML/AI to industrializing the building of new analytics views and dashboards. If you have invested heavily in data science, in-memory analytics could be the pivotal cog in generating the maximum output from each piece of your organization’s data infrastructure.

    — Antoine Chambille

  • 3 Steps to Building Data Science Models

    3 Steps to Building Data Science Models

    Have you ever considered supplementing your development skills with some data science? Expand your range and follow this quick tutorial on how to build your own predictive models using open datasets, Jupyter notebooks and Sequential models.

    Pick Your Data Game

    Your first step in learning data science is to find a dataset that fits your interests. A robust platform where you can find inspiration is Kaggle, a web-based data science environment for machine learning enthusiasts. It offers, not only open datasets, but also competitions and even free micro-courses.

    Maybe you want to change the world and help with scientific research. Maybe you’d like to jump in to win $65,000 in a sponsored challenge. Or maybe you’d like to start with some machine learning techniques. There is plenty of data to search through and there always are a couple of open contests to enter.

    For this tutorial we are going to use a dataset from a competition called “Histopathologic Cancer Detection.” It is very important to understand not only the data we are going to work with, but also the main purpose of this challenge. Looking at our example, we read the following: Identify metastatic tissue in histopathologic scans of lymph node sections.

    In layman’s terms, the goal is to determine/recognize/discover if there is a sign of tumor tissue in a given image based on a dataset of lymph node scans. This is enough information to know that our model will have to answer this question in a binary manner: if there is a metastatic tissue in a given image, the answer is yes; if there is not, the answer is no.

    Choose a Game Plan

    There are two main types of machine learning, supervised and unsupervised.

    In our case, we have a training set and a ground truth–train labels. In other words, we have prior knowledge of what the output values for our training images should be. Therefore, if we have a ground truth, then we know we are dealing with supervised machine learning.

    The goal here is to learn a function based on example input-output pairs. Having this function, the task is to map a new given input to a predicted output. Sound reasonable? Let’s jump into the competition sources and see if we have what we need.

    Train set: This set contains the data you will train your model on. It’s the set of plain images for which we already know the correct answer.

    Train labels: As you may have already guessed, this file contains the correct answers to each image in a train set.

    Test set: Set of images for which we do not know the answer.

    Our goal is to create a new file (similar to train labels) containing predicted answers for images from the test set.

    Game On!

    For this opportunity, I decided to explore Google Colaboratory. It is a free Jupyter notebook environment with Python 3 that requires no setup and runs entirely in the cloud. If you haven’t used Jupyter before, now is a great chance to get started. With Jupyter notebooks, you can write and execute code, save and share it, and even access powerful computing resources, all from your browser.

    We start our game by importing the files we need to Google Colaboratory. Here’s how: Remember to copy the imports as we will need them later.

    We will use the Kaggle official API (you can read more about the setup and obtaining needed keys here) to easily retrieve large datasets directly to a server environment.

    Now when you execute ls /content/, you should see:

    We are going to read dataset into the pandas data frame.

    The output should be as shown below:

    Having all data in place we are ready to construct our first model.

    The Sequential model is a linear stack of layers. The model needs to know what input shape it should expect. For this reason, the first layer (and only first) needs to receive information about its input shape. You can read more about the construction of Keras Sequential model here.

    We need to declare some helper functions to transform the data to fit our needs (map train set with train labels).

    Execute the code below and put on your favorite TV show … this will take some time to compile! Remember to change hardware accelerator to GPU. It’s free and can speed up model building time up to five times. Go to Runtime, then change runtime type and change None to GPU.

    Data Science Endgame

    Before we generate predictions, we should probably preserve our model (better be safe than sorry).

    The last step is to get the answers for the images in our test set. When all is computed we can see predictions for the first couple of images.

    To save final results and download them run this:

    It’s time to upload the files to Kaggle and wait to see our final percentage score.

    Stepping Up Your Data Science Game

    There’s nothing better than a little healthy competition. Since we are taking part in a real contest, we have to consider that there will be some winners and some losers. There’s no doubt that we want to be in the first group, but the model that we have trained so far does not guarantee this. We should improve the predictive power as much as possible (although watch out for overfitting).

    There are many techniques to do that, including adding more data, algorithm tuning or ensemble methods. It’s easy to list them, but not so easy to pick the ones that actually will improve our score.

    There are endless possibilities to increase the predictive power of this or any model. Pick a new dataset and try for yourself to expand your data science skills.

    — Magdalena Baracz

  • GitHub Applies Data Science to Managing Code

    GitHub Applies Data Science to Managing Code

    Over the last several years GitHub has emerged as one of the primary repositories around which application development now revolves. At its recent GitHub Universe 2017 conference, the company revealed how it is extending that central role to provide DevOps teams with the addition of a dependency graph that can be employed to alert DevOps teams when a module of code has been updated and a security alert service that will notify them anytime a patch has been made available for a specific module.

    Miju Han, engineering manager for data science for GitHub, says both new capabilities are examples of how the company is applying advanced algorithms and data science techniques to make it easier to manage DevOps processes that revolve around GitHub.

    In addition, Han says GitHub is making available a news feed through which DevOps teams can track updates to groups of modules stored in the repository, as well as a tool through which they can explore a curated set of modules.

    Han says his company intends to combine a variety of emerging data science tools to simplify the daily workflow that revolves around GitHub. As the repository has become more widely used, the sheer volume of code and related updates a DevOps team is supposed to track has become, in many cases, overwhelming. That’s why the company is now pouring resources in several data science research projects with an eye toward making it simpler to navigate the repository.

    The latest annual edition of an Octoverse report published by GitHub finds that there are now more than 24 million developers in 1.5 million organizations around the world accessing 67 million GitHub repositories. A total of 25 million of those repositories are public. The most popular programming languages in use across GitHub are JavaScript (2.3 million projects); Python (1 million projects); Java (986,000 projects) and Ruby (870,000 projects). In terms of pull requests, GitHub notes that Python surpassed Java in popularity in the last year. The company also notes that half of the largest companies in the U.S. based on revenue are employing GitHub repositories.

    There is no shortage of repositories being employed inside and out of enterprise IT organizations, including an enterprise edition of GitHub that the company claims has been implemented by 45 percent of the Fortune 100 list of the world’s largest companies.

    Arguably, the biggest challenging many organizations now face is trying to reconcile the various code repositories in use. Just about every provider of an application development platform provides access to a code repository. In addition, providers of everything from container frameworks to application lifecycle management (ALM) often provide similar capabilities. Keeping track of what version of any given piece of code resides where at any given time has become a significant challenge.

    The good news is that providers of repositories are starting to address that issue on their own platforms, which means it stands to reason that one day soon tools for managing code across heterogeneous repositories may not be all the far off. In the meantime, DevOps teams can take some comfort in the fact that the management tools they rely to manage all the code are about to become a whole lot smarter.

    — Mike Vizard

  • 4 Predictive Analytics Challenges Facing SRE Teams

    4 Predictive Analytics Challenges Facing SRE Teams

    “Predictive analytics” refers to the many techniques used to analyze data to make predictions about the future, such as data mining, statistics, modeling, machine learning and artificial intelligence. Being able to predict technical and business outcomes is one of the main promises of big data. Indeed, many businesses have invested heavily in infrastructure to anticipate key performance indicators such as demand, pricing or maintenance. The investment required is substantial but, when it works, it yields a very positive ROI.

    In this post, we’ll examine why implementing predictive analytics in a site reliability engineering (SRE) context requires a significant investment in both setting up the right data sets and applying the right logic to that data.

    SRE should in theory be a prime target area for predictive analytics. Why? Because companies have already widely adopted monitoring tools over the past decade. In doing so, they’ve amassed extensive system health and behavior data that is ripe for analysis. SRE teams have also increased their ability to make sense of this data as data science tools have become more accessible. Basic data science aptitude is increasingly become a desired skill when hiring engineers.

    Additionally, the SRE team is responsible for a mission-critical KPI: system availability. This single metric is directly tied to customer SLAs in digitally dependent businesses. SRE teams have a strong incentive to implement predictive analytics. Why? Having the ability to prevent downtime by addressing potential issues before they hit the production environment is hugely valuable. More system availability translates into more revenue, higher customer satisfaction and lower costs of problem mitigation.

    However, the reality is that an SREs job is still mostly focused on the diagnostic, mitigation and “fixing” parts, as opposed to more proactive tasks. This is in big part because predictive analytics applied to SRE/DevOps has proven difficult to implement and perform in a disciplined manner. Therefore, it is still an aspirational goal at most companies.

    SRE Challenges in Predictive Analytics

    Up next, let’s explore the four challenges that need to be overcome to implement high-quality predictive analytics practice in an SRE context, including:

    • Data collection
    • Data quality
    • Data volume
    • Model usability

    Challenge 1: Data Collection

    First, the working data sets need to fit what you are trying to predict. In this case, it is challenging to get the right data set because the SRE team’s mission is very broad; specifically, ensuring the reliability of the entire system. The difficulty lies in the fact that there is no such thing as “full system” data readily available. All the relevant data is distributed across siloed, or overlapping repositories and monitoring tools. Centralizing the data requires either a full system agent (which takes a lot of work to set up) or through APIs, which requires mastering a multitude of API integrations. An additional obstacle in getting the right data lies in the inconsistent nature of events, time series data and logs. These disparate data types can’t be analyzed together unless they can be transformed into a uniform data set.

    Challenge 2: Data Quality

    SRE environments emit lots of data and some won’t make sense for the purpose of the analysis. Whichever data collection method is used, the information tracked often reflects some level of bias on the part of whoever set up the tracking mechanism in the first place. This leads to capturing both irrelevant data or inadvertently leaving out important information. In other words, the data is often both noisy and lacking at the same time.

    The key to successful modeling lies in the selection of prediction variables with data that is obtained before the event predicted happens (in this case, a failure). Defining the variables that lead to the determination of a subsystem failure is critical and requires specific domain knowledge. It is difficult to define and extract a pure data set sanitized of noise. The more data you leverage, the higher the chances that you are actually “feeding the beast” with irrelevant information. Too much irrelevant data leads to inaccurate models and false positives.

    Challenge 3: Data Volume

    Here you can have two different types of challenges: too little data and too much.

    Not enough data

    You typically need at least 100 instances of what you are trying to predict and probably at least 100 where it didn’t work to train a model. This assumes the data set is clean and directly relevant to a very narrow, specifically defined problem. In the case of SRE, the scope of issues that can affect a system is such that the data set required is very substantial. Likely, it’s several months worth of a wide variety of system behavior measurements. For example, if you collect data only through passive collection, think about the lag time between t-zero (when you start collecting data) and the time when you would have results. During that time, you have a bootstrapping problem—your model can’t be trained to predict accurately what you want.

    Too much data

    There are two practical points to make around the notion of “too much data.”

    • Lack of standardization: Processing large volumes of data for analysis remains a difficult engineering challenge. There is no standardization for data pipeline; every method has a limit in terms of how many inputs it can ingest on a per-second basis, and ingest rates often end up becoming bottlenecks in large enterprise environments.
    • Volume does not equal accuracy: There is a point beyond which you get diminishing returns: statistical theorems show that after a certain point, feeding more data into a predictive analytics model will not provide more accurate results.

    Overall, getting the quality and quantity of the training data right is the best investment you can make in building your predictive capabilities.

    Challenge 4: Model Usability

    From a pure “mechanics” standpoint, the analytical concepts and methods are there to reflect the complex thinking required to predict the behavior of an enterprise’s combination of technology, information and infrastructure. Predictive software relies heavily on advanced algorithms and methodologies such as logic regressions, time series analysis and decision trees. The problem is that the workings of the kinds of systems that SREs deal with are very hard to understand in the first place, let alone predict. It is not uncommon even for SREs to not entirely understand how a system works if they were not the ones who initially set it up. In addition, every company’s system is different.

    When data scientists design predictive models without years of experience in an SRE capacity in multiple environments—in other words, without leveraging subject matter expertise—it rarely works perfectly. Often the models they create lack usability, even after the validation process to confirm its quality. A modeler will split the available data into a training set where the model is run to generate predictions and compare performance against the actual outcomes. That will require multiple iterations to generate a model that has high overall predictive accuracy, and 9 out of 10 times the result is overfitting, or perfect for the training data. A subject matter expert in the domain of technical operations can cut the cycles of iteration and get to a predictive model that works with an acceptable level of risk.

    In short, implementing predictive analytics in an SRE context takes a significant investment both in setting up the right data set and applying the right logic. Stay tuned for a future blog post that will provide some pointers on how to achieve the best prediction results.

    About the Author / JP Emelie Marcos

    JP Emelie Marcos is the co-founder and CEO of SignifAI. Previously, JP served as the Chief Operating Officer of Tango, a leading mobile consumer application that reached 400 million regular users in five years. JP’s career spans 20+ years leading teams in technology startups and large companies as an investor, GM and CEO.

  • Data Science Industry Perspectives in the Cloud

    Data Science Industry Perspectives in the Cloud

    In principle, the cloud is becoming a commodity. Google, Amazon and other companies are trying to commoditize almost everything, including the instruments for data gathering, data storage and data transformation. In the near term, we should expect that platform engineering, which today is overly complex, will become simpler.

    With data engineering, however, the prospects of such simplification in the near future is not that clear. Currently there is no single simple solution even for ETL (extract transform load), such as the Amazon Data Pipelines or Amazon Glue (which hasn’t been fully released). They represent some very humble beginnings of what people are building up right now brick by brick. Data engineers and architects and other professionals are building these to solve real-life cases.

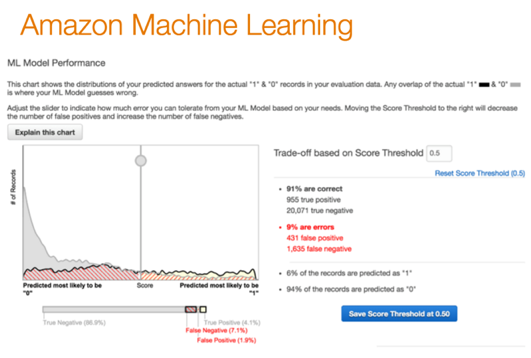
    From the data science point of view, new machine learning-as-a-service solutions are popping up like mushrooms after a spring rain. There are a multitude of them on the market: Big ML, Data Robot, Azure ML, Amazon ML, IBM Watson, Google Prediction and so on. But what is machine learning as a service (MLaaS)?

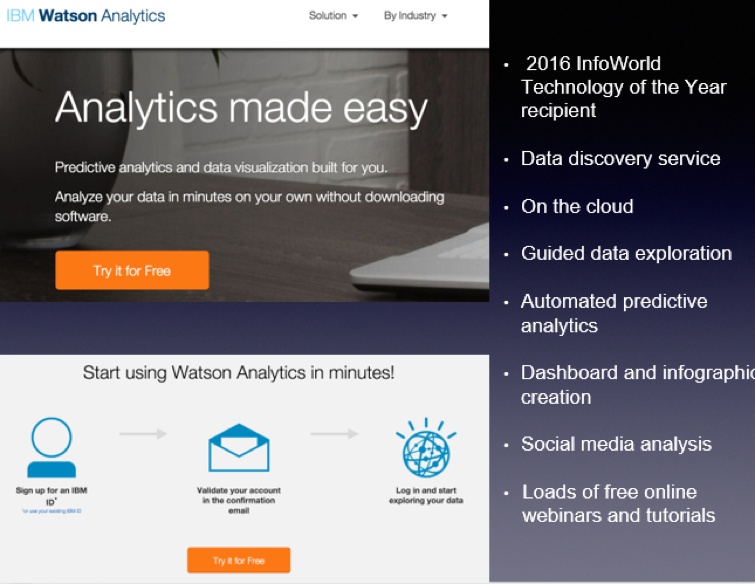
    Let’s look at IBM Watson Analytics as an example:

    MLaaS is a set of preset wizards to create machine learning models and use these models through API. For example, we need to recognize text and separate some facts and data out of it. To do that, we initiate the service in a couple of clicks, insert the original text and get back a marked out and analyzed copy. In this instance, the service is commoditizing NLP (natural language processing). The same goes for VTT (voice-to-text): We insert an audio file and get the text version of the talk back.
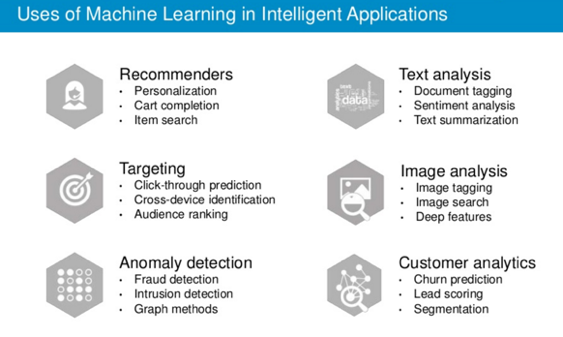
    There are other uses of machine learning technology:

    Machine learning closely works with data. But it is one thing to have data, and another to have actionable data with which you can help users. As seen from the chart, above one of the key trends is the commoditization of data services.
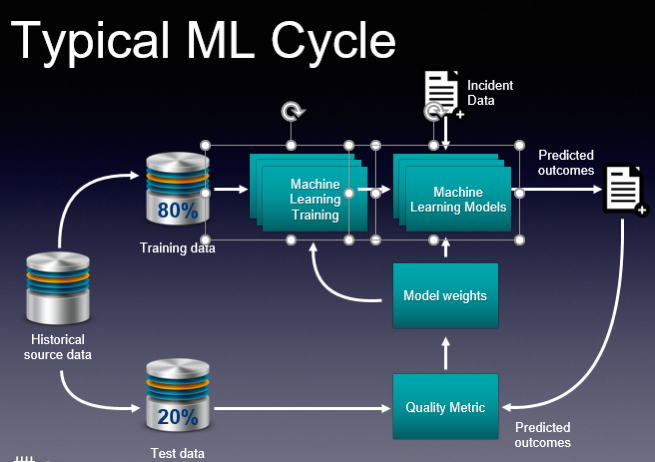
    These basic services do what they are supposed to, and this is great. And you don’t need to employ a data scientist to do some of these tasks. But if you are a company like Grammarly, whose know-how is in actual text recognition, provision of recommendations and text analytics, then ready-made services are insufficient. Grammarly, and companies like it, have to take a hands-on approach that will be very expensive. This is their core business and using third-party services is not viable.

    So how would you go about using ML cloud services?

    Even taking into account a large number of “as a service” solutions, the main challenge is in navigating and understanding “what is better” and “what is best,” and “how it all works.” The issue is that such services are constantly changing. The best choice for you may be to employ tools-consulting services. It’s imperative to understand what is available now and what tools would best suit your business. This is the most basic but essential help you may need.
    Secondly, integrating your operations with these services requires particular engineering efforts. Indeed, most of the data science tasks right now are solved through these cloud “as a service” solutions. But having a proper consulting company with a strong engineering background can help you better utilize such ready-to-use solutions. They offer value to the business at a faster pace. There is no need to invent the wheel, especially when your consultant knows what and where to use.

    If you decide to go to a data science firm where the majority of employees are data scientists, they will create for you some unique genius custom solutions, do great research and so on and so forth. This is what they are good at. This is their bread and butter.

    An end-to-end consulting company may be a better choice for your company, as its goal is to bring value to your business. Consultants will tell you if MLaaS solutions are appropriate for your machine learning needs, and will have a deep understanding of how these services work. A consultancy company also should create and build proper architecture, and provide custom development work that is unique to your services for your business to scale.

    Finally, evolution is key if you plan to grow your business. Start with the ready-made solutions, then in time switch to in-house solutions that can be done with the help of a group of data scientists.

    About the Author / Stanislav Ivashchenko

    Stanislav Ivashchenko is the Senior DevOps Сonsultant at SQUADEX. A certified AWS solutions architect, he is experienced in building, delivering, supporting and optimizing a broad range of software applications. From bare metal to the cloud, from monolith architecture to microservices, he helps improve software delivery processes in startups, mid-sized companies and large enterprises. He has solid skills in orchestrating various DevOps and infrastructure related tools, services and management practices. Connect with him on LinkedIn.
     

  • Useful Big Data Terminologies, Part 1

    Useful Big Data Terminologies, Part 1

    As data continues to increase at an evermore rapid pace, organizations struggle to deal with this data torrent, let alone use it to analyze and capture value. The ways used to understand this big data also is increasingly rapidly, which introduces myriad terms used to define these methods.

    The follow is an attempt to provide natural explanations to some of the significant terms and technologies you will come across when you’re getting into big data.

    Algorithms: Mathematical and analytical formulas that also include statistical processes used to analyze data. Algorithms are implemented in software to analyze, process the input data and produce output or results.

    Analytics: The course of depicting conclusions based on the raw data. With the help of analysis, otherwise-meaningless numbers and data can be converted into something useful. The emphasis here is on interpretation and not on big software systems. That may be why data analysts are very experienced in the art of storytelling.

    Biometrics: Using analytics and technology to identify people by one or many of physical characteristics, such as fingerprint recognition, face recognition or iris recognition.

    Cassandra: A very well-known open-source database management system managed by the Apache Software Foundation, which has been constructed to handle high volumes of data throughout distributed servers.

    Cloud: A term used to describe data or software running on remote servers rather than locally. Data stored in the cloud is usually reachable over the internet, wherever the owner of that data in the world might be.

    Database: A systematized collection of data, such as schemas, charts or tables. A database management system (DBMS) is software that helps in data analysis and exploration.

    Data Mining: This term can mean different things for different context. To the layman, it means the automatic examining of large databases. To an analyst, it refers to the pool of statistical and machine learning methods used in the databases.

    Dark Data: The information collected and managed by a business that is never put to use, yet sits waiting to be studied. Most companies don’t realize they have a lot of this kind of data lying around.

    Data Scientist: A skilled expert in extracting value and insights from data. A data scientist typically is someone with skills in computer science, analytics, mathematics, creativity, statistics, communication and data visualization, as well as strategy and business.

    Gamification: The process of creating a game-like environment in areas that typically would not have games, such as websites, to attract users and increase engagement. In the terms of big data, a gamification is a powerful tool for incentivizing the data collection.

    Hadoop: An open-source software structure that works mainly by processing and storing files and data. Hadoop is known for its big processing power, which makes it easy to run a host of tasks alongside. It helps companies access, save and analyze enormous amounts of data.

    IoT: An acronym that stands for internet of things. Principally, it defines an ecosystem of things, from diapers to self-driving cars, that can communicate with each other via the internet. Their sensors generate a large amount of data that can be analyzed.

    Machine Learning: A highly casual way performing data analysis. Machine learning mechanizes logical model building and trusts on the ability of the device to adapt. With the use of algorithms, models dynamically learn and improve themselves every time they process any new data. Machine learning is not new; however, it is receiving massive attraction as a modern tool for data analysis. It allows devices to grow and acclimatize without demanding numerous hours of extra work by the scientists.

    MapReduce: A model for programming, generating and processing massive data sets. It does two different things: the Map, which includes rotating one dataset to the other, more valuable and fragmented dataset made of bits known as tuples; and the Reduce, which takes all of these fragmented tuples and breaks them even further. It results in a useful breakdown of information.

    NoSQL: Database management systems that do not use relational tables used in most old-style database systems. The data retrieval and storage system is designed for managing massive volumes of data without tabular categorization.

    SaaS: An acronym for software as a service, a method of application delivery in which vendors host applications and make them available through the internet. SaaS providers deliver their services via the cloud.

    Spark: An open-source computing structure developed at the University of California, Berkeley, and donated to the Apache Foundation. It is used for interactive analytics and machine learning.