Tag: data analytics

  • Why Trust and Integrity Are Critical to IoT

    Why Trust and Integrity Are Critical to IoT

    We hear a lot about how the IoT is transforming people’s work and daily lives, but for me, its impact goes deeper. As a Type I diabetic, I depend on data from an IoT device to stay healthy. If I can’t trust my latest blood sugar reading, the results can be catastrophic. Health care use cases like mine represent some of the many examples that underscore the importance of data integrity. Stacey Higgenbotham expressed it perfectly in a recent post: “If a business or consumers can’t trust the data, the IoT fails.”

    The IoT is all about making better, more informed decisions, and data is the foundation that makes those decisions possible. As the IoT gains maturity, we’re seeing its impact across more and more industries and use cases. 

    In agriculture, smart sensors are in widespread use for real-time crop monitoring to help farmers track the state of their products. Tools like motion detectors, light detectors and moisture sensors can be brought together to support predictive analysis and enable smarter, more automated decisions. IoT sensors are also tracking the location and health of livestock to help farmers detect disease outbreaks and isolate animals if needed. 

    Most of us have seen how the IoT has revolutionized the safety and efficiency of the home, providing unprecedented control over appliances, heating and cooling systems, smart metering and lighting. Security cameras, alarm systems and smart locks are strengthening physical security and bringing residents peace of mind. As these smart home systems mature, they are also becoming increasingly integrated, personalized and automated.

    The global pandemic is also helping shape IoT adoption. Forrester predicts that manufacturers, pharmaceutical firms and utilities are increasingly switching to remote experts and technicians for support. To manage and repair their assets without extended downtime and costly travel, these industries have begun connecting previously disconnected machines.

    What do these diverse use cases have in common? Without trusted data from connected sensors and devices, all of them become vulnerable and the decisions they support become questionable. Inaccurate moisture data from a sensor could cause a farmer’s crops to fail. A compromised smart lock could leave a home vulnerable to theft. In a manufacturing environment, inaccurate telemetry from a connected machine could lead to factory floor shutdowns or damaged assets. The positive business outcomes enabled by the IoT all hinge on working with accurate, timely and trusted data.

    Signing Is Key to Strengthening IoT Data Integrity

    Establishing data trust should be top of mind for IoT device manufacturers, and it is imperative that they take steps to ensure that data is not being manipulated in transit or at rest. This protection applies not only to data packets exchanged by the devices and applications but firmware updates and supply chain processes.

    The recent executive order signed by president Biden underscores the need for measures like code signing. Focused on improving the nation’s cybersecurity, the EO presented guidelines and general best practices for federal departments, agencies and contractors. However, its impact is also likely to extend to technology and infrastructure companies. 

    Some of the strongest direction in the EO is intended to improve the security of software as well as supply chains for technology manufacturers. The order establishes baseline security standards for the development of software sold to the government, including requirements for improved visibility into that software and making security data publicly available. The order acknowledges that too many devices and software releases contain vulnerabilities that bad actors could exploit. 

    Effective Code Signing Requires Strong Management 

    Fortunately, a proven solution is available today to help manufacturers ensure data authenticity, confidentiality and trust for their IoT solutions. Best practices like code signing can help manufacturers bake security into each and every stage of their development processes. By applying digital signatures, organizations can assume full control of their development. They can confirm the integrity of their code before it moves further along in the development cycle and is put out in the field for devices and their customers. 

    Code signing is only as effective as the processes and best practices that support its implementation. To make the most of digital signatures, developers and engineers need a holistic approach to management. The signing process should be seamlessly built into their development processes to simplify and ease adoption. 

    A common management platform should enable manufacturers to fully protect private key usage and signatures, as well as monitor and manage access to digital keys. The process should also enable organizations to support granular monitoring of their code signing processes and include historical tools like reporting and auditing for full accountability and compliance. With a process in place to continually sign firmware, software updates and other components that can ensure data integrity in device interactions, manufacturers can be assured that their IoT solutions will work as intended, using data their end customers can trust. 

    There’s no question that as the IoT continues to extend deeper into our business and personal lives, the importance of data integrity is also rising. The stakes will only increase as more systems, processes and life-or-death decisions rely on trusted IoT data. To sustain the soaring growth of IoT use cases and solutions, it’s up to manufacturers to build security into the supply chain. With a strong data foundation underpinning today’s rapid innovation, the potential of the IoT revolution is limitless.


  • Does Your Organization Need a Data Diet?

    Does Your Organization Need a Data Diet?

    The scenario is all-too-familiar: There’s a security breach, and afterward, the affected organization asks what it must do to better protect its data.

    But what if that organization never collected and stored that sensitive information in the first place? Often, the best defense against an embarrassing and costly breach is to collect only data that is essential to an entity’s mission.

    Some who work in computer privacy circles refer to this as “going on a data diet.” They know the temptation is great for organizations to bulk up on data of all kinds. After all, storage costs are low. With the move to the cloud, an organization doesn’t even need to invest in hardware and upkeep to store the information it collects. So why not grab whatever data a customer or client is willing to provide?

    Because we live in a time when the only sensible approach to computer security is to wonder when your entity might be breached—not if. That’s why it pays to not only go on a data diet, but to adopt a regimen for keeping your organization’s databases lean and, as a result, your customer relationships healthy. 

    Too often, companies collect data just because there’s a chance it might be useful or they think it’s harmless. I’ve seen this play out firsthand. Sales departments seek any small edge they can find; who knows what small shard of data might prove useful in the pursuit of potential customers? The same is often true of an organization’s marketing unit, whose people are working hard to reach a broader audience for their product or message. If information flows freely from the potential and current customers, they collect it in pursuit of any leg up in the competition for people’s attention.

    But there are costs to an organization beyond the price tag of data storage. That includes reputational risk and exposure to lawsuits and the distractions these and other problems bring. More info might seem better—until hackers have broken into a system and the head of an organization is forced to explain why that data was gathered in the first place.

    Weaponizing Seemingly Harmless Data

    It was not that long ago that there seemed to be two distinct types of data: In one bucket there was personally identifiable information (PII) such as a name, address, phone number and email address and critical financial information like bank account and credit card numbers. Throw in personal health information (PHI) and other obviously sensitive information; everyone knew this sort of data must be zealously safeguarded.

    The second bucket was everything else: The seemingly extraneous bits we all leave behind living in a digital world such as what time you visited a website, the language you choose for a website, what products you viewed. Think of it as a mop bucket—messy if spilled, but not vital to corporate security.

    But those distinctions have blurred in recent years. An individual piece of data might seem innocuous, but not when combined with other sets of data that do not fall under the definition of PII as set out by law. What makes Big Data so promising to an organization’s sales and marketing teams is also what makes it potentially dangerous to collect: The connections that a clever algorithm and today’s awesome computing power can deliver crawling through vast data stores. If you link information that is personally sensitive (a person’s tastes or habits or activities) but not technically PII, it can be weaponized to harm individuals.

    As an example, think of the tracking data offered by people’s cell phones. If a person leaves the same street address at around 8:30 every morning and makes the same drive back and forth, it’s quickly obvious where someone lives and where they work. Given other open records, a hacker with dark motives can find our commuter’s name and other information. It’s not a big jump to connect this information to crimes like theft or even stalking and blackmail.

    Adopting a New Data Discipline

    Given the risks, forward-looking organizations are now adopting privacy programs that force their teams to ask the hard questions before collecting information. For these privacy practitioners, any time someone internally proposes that a new piece of data be grabbed or used in a new way, a conversation ensues about its usefulness and the validity of collecting it.

    Maybe the policy is conducted through an internal privacy committee that meets to debate its appropriateness. Maybe it’s a rigorous process that means checks and balances throughout an organization. But whatever the method, only data that can be justified as fundamental to an organization’s operation is collected.

    Another idea gaining popularity among those focused on privacy concerns: A process for jettisoning old data. (An example: Does an organization need to know a person’s last several addresses or just the current one where they can be reached?)  Under such a data diet, all information that an organization continues to store beyond its immediate use requires a specific justification.

    After all, the information you don’t have is the easiest to protect.

  • DataOps Vs. DevOps: What’s the Difference?

    DataOps Vs. DevOps: What’s the Difference?

    There is a mindboggling amount of data today; to even measure it requires using a byte measurement called a zettabyte, which is one sextillion bytes (that’s 21 zeros). Currently, because such a ridiculous amount of data exists, there is a growing urgency to end wasteful data processes. From this environment, DataOps was born. Similar to the way that enterprises adopted DevOps to formalize and streamline wasteful development practices in the past, today, many large organizations turn to DataOps to formalize modern data management practices.

    What, Exactly, is DataOps?

    Primarily, many companies are adopting these principles because they are either trying to avoid or rectify data debt, which is the amount of money required to fix data problems due to the mismanagement of data processes. Data debt is a strong motivator for revamping outdated processes and policies, particularly when decision-makers and stakeholders require metrics before implementing change. Unpaid data debt can be detrimental to a business; the longer it remains unpaid, the more it costs to maintain a data landscape.

    By implementing DataOps principles and data governance, an organization can effectively reduce its data debt and prevent it from growing any larger. Moreover, DataOps practices and software engineering can be used to detect inefficiencies, minimize knowledge loss and capitalize on missed opportunities related to data usage.

    Similarities Between DataOps and DevOps

    Much of the processes that enable DataOps were borrowed initially from the same foundations that built DevOps. Likewise, just as companies need DevOps to provide a high-quality, consistent framework for software and feature development, data enterprises also rely on these same features to realize rapid data engineering and analytics development. For organizations that already have a DevOps framework in place, leveraging DataOps is relativity straightforward. Several important DevOps concepts adopted by DataOps include:

    • Agile development
    • Focus on delivering business value
    • Continuous integration and continuous delivery (CI/CD)
    • Automated testing and code promotion
    • Reuse and automation

    The Differences

    Despite the similarities between the underpinnings of DevOps and DataOps, there are several major differences.

    The human factor: The people using DataOps and DevOps have divergent personalities and skillsets. DataOps participants may be tech-savvy, but often their knowledge is theoretical. DataOps professionals can include data engineers, data scientists and analysts who focus on creating models and visual aids. DevOps, however, was made for software developers and engineers–coding is in their DNA.

    The process: The life cycles of DataOps and DevOps do share similar interactive properties. But, the former deviates in that it consists of a data pipeline and an analytics development process, both active and intersecting. While conceptually, the pipelines of DataOps resemble the development processes of DevOps, typically, experts note that the DataOps process is more challenging.

    Orchestration: In the DevOps process, application code does not require complex orchestration. However, for DataOps, both the data pipeline and analytics development orchestration is an essential component. Although orchestration in the DataOps pipelines occurs frequently and drives data flows, there is usually no such coordination of pipelines in application development and DevOps processes.

    Testing: Again, the two pipelines of DataOps create a significant difference from DevOps; testing in DataOps occurs during both the data pipeline and the analytic development process. These tests attempt to catch anomalies, flag abnormal data values and–unlike DevOps–validate new analytics before deployment. Likewise, these tests get embedded into a data quality framework for continual monitoring.

    Test data management: In most DevOps environments, test data management hardly takes priority; with DataOps, it’s vital to accelerate analytics development so that innovation keeps pace with agile iterations.

    Tools: DevOps is the ‘father’ of DataOps, and as such, the tools needed to support the latter are still in their infancy. While testing in DevOps is primarily automated, DataOps doesn’t have the same luxury – most users modify testing automation tools or build their own from scratch.

    Exploratory environment management: Generally, data teams use more tools than software development teams. Moreover, exploratory environments in data analytics are more challenging from a tools and data perspective; data teams also naturally depart from data islands across the enterprise.

    While foundationally, the concepts of DevOps serve as a starting point for DataOps, the latter involves additional considerations to maximize efficiency when operating data and analytical products. Nevertheless, both serve their intended audiences, reducing data debt and evolving data products or shortening systems development life cycles or providing continuous delivery. For businesses looking to make internal data-related processes more efficient, they should start by examining best practices associated with DevOps.

  • Using ML/AI to Support Infrastructure Monitoring

    Using ML/AI to Support Infrastructure Monitoring

    Successful infrastructure monitoring enables IT teams to ensure constant uptime and performance of their company’s systems. Technologies like machine learning (ML) and artificial intelligence (AI) benefit infrastructure monitoring by more quickly collecting and analyzing data from all of the hardware and software components that comprise the IT stack. Infrastructure changes are occurring faster than ever before, but complex systems, the unique nature of applications and lack of IT skillsets can cause challenges when integrating with these newer technologies. However, it’s more important than ever that sysadmins and DevOps teams understand how ML and AI can mitigate these roadblocks, support them in staying on top of infrastructure performance and rapidly address issues that arise.

    Intelligent Monitoring Support for Complex Systems

    The most tangible result of intelligent infrastructure monitoring tools and processes is near-immediate alerting of performance and uptime issues, which can then be addressed in an efficient and effective manner so no business interruptions occur. However, complex systems can stunt these benefits if ML and AI are not being used and manual monitoring protocols are still in place.

    Tools that use ML or AI lessen the work of IT staff immensely, freeing up critical business resources and aiding in overall productivity. Both technologies can automatically identify and update all IT stacks that comprise an enterprise’s infrastructure to keep systems up-to-date and aligned with established key performance indicators (KPIs). In addition, intelligent offerings can detect and factor those metrics against set standards so that early alerts to an “unhealthy” section of infrastructure can be identified, even as the IT stack is constantly changing. This drastically speeds up troubleshooting efforts.

    Differentiation in Applications

    The different applications supported by the various IT stacks will most often have unique service-level agreements (SLAs) for their performance and uptime, as well as remedies or penalties should those service levels not be achieved. Plus, system loads that stress the underlying infrastructure are frequently changed. For these reasons, it is important to identify what constitutes a “healthy” IT stack so that these minute parts of the infrastructure are not overlooked due to the variation involved.

    ML and AI can be programmed to track system baselines that support a “healthy” IT stack. These technologies are particularly great at finding novel and unusual patterns in data. As the monitoring and observability landscape becomes more complex over time, driven by real changes in how developers build applications and systems, the ability to spot and detect such patterns in data can be crucial in helping make sense of it, further cutting down efforts on manual searching, detective work and “death by dashboards,” which we’ve all experienced at one time or another.

    Supporting IT Team Skills with Intelligence Technology

    The role of sysadmins—and to a greater extent, developers—has shifted over the past few years to become nearly as complex as the infrastructure they oversee. Nowadays, it seems as though developers are required to have expertise in all aspects of infrastructure, from monitoring to Kubernetes to machine learning. This can take quite the toll on developers who possess such skills, but in a more realistic sense, developers that can do all these things are very hard to come by. The lack of these skillsets is pervasive in the industry, which is why ML and AI can be seen as supporting technologies—they can fill in these gaps, to an extent.

    With built-in intelligence and automation, ML/AI can enable even the most inexperienced sysadmin or DevOps professional to monitor complicated infrastructure like a pro, taking on most of the time-intensive work around collecting and analyzing the data and identifying where to troubleshoot. The main goal is to put humans in the driver’s seat, utilizing ML and AI for granular discovery of system issues, providing the metrics or charts that might be most relevant to IT staff as they troubleshoot their system and reducing the cognitive load of developers.

    With the vast benefits that intelligent technologies possess, integrating them into your IT stack can help mitigate challenges experienced with complex systems, application differentiation and the skills deficit experienced in the IT team. The important ingredient in making ML and AI effective in infrastructure monitoring is using tools that incorporate the right formulas, algorithms and automation that can best help determine success when it comes to your desired outcome.

  • Plutora Dives Deeper into Value Stream Analytics Data

    Plutora Dives Deeper into Value Stream Analytics Data

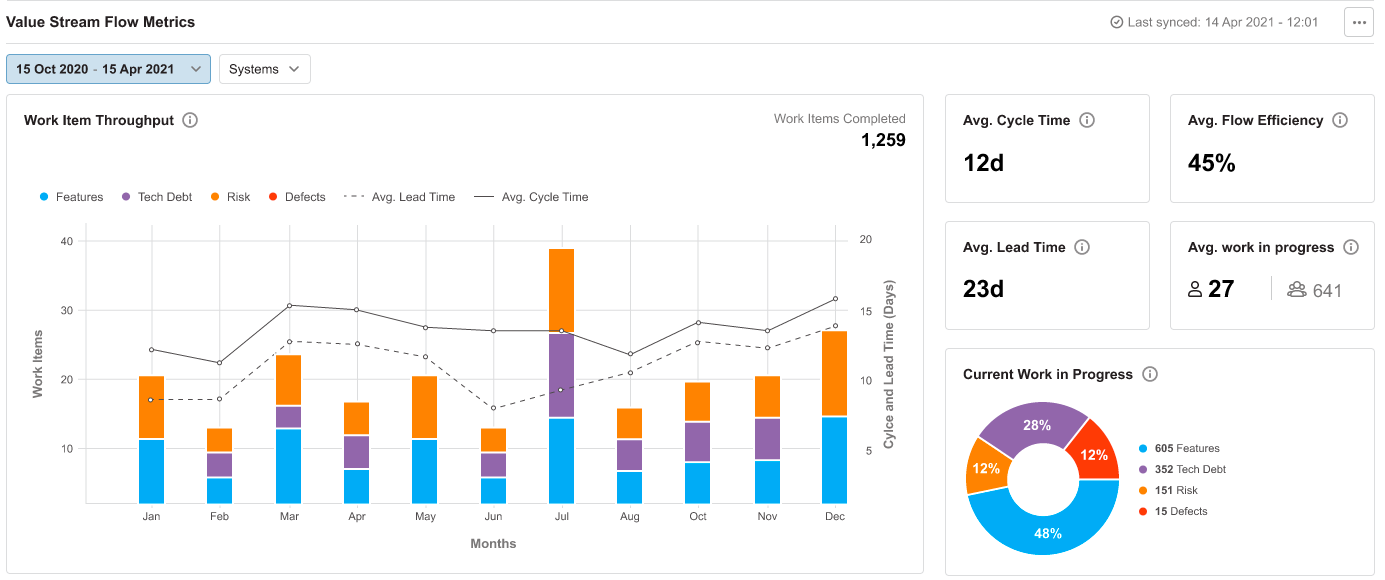
    Plutora announced today it has extended the capabilities of its value stream management (VSM) platform to include a common object data model that more efficiently normalizes data collected from multiple DevOps tools and platforms.

    Jeff Keyes, vice president of product marketing and strategy for Plutora, said the goal is to expand the level of scale and depth at which the Plutora analytics engine embedded within the Plutora Platform can analyze flow metrics.

    VSM has emerged as a distinct DevOps discipline that provides a framework for enabling organizations to optimize workflow across DevOps environments in a way that allows them to accelerate application development. The core concept traces its lineage to lean manufacturing methods that continuously measure each step of a process to improve production.

    As organizations develop a deeper appreciation for their dependency on software, the level of interest in understanding how software is constructed has increased. Organizations, for example, want to better understand the impact of missed software development deadlines on revenue, which a business might not be able to generate as quickly as anticipated.

    Plutora is making a case for a dedicated analytics platform that pulls data from multiple platforms. Alternatively, more value stream analytics capabilities are now being embedded in everything from project management software to continuous integration. Plutora contends, however, that navigating multiple value stream dashboards surfaced by different tools that make up a DevOps workflow is not as simple or effective as relying on a single platform that collects data from every tool employed.

    Metrics that track lead and cycle times for projects as well as overall throughput become much easier to surface and comprehend, noted Keyes.

    One way or another, more transparency is coming to DevOps workflows. Historically, collecting this data has been challenging because it required DevOps teams to manually collect data from each tool being used. In effect, DevOps teams were wasting time copying and pasting data from one tool into an analytics application.

    As it becomes simpler to aggregate all that data, the data model provided by Plutora makes it simpler for multiple analytics tools to analyze the same data. A business user, for example, may prefer to analyze data using the Tableau analytics platform that is now owned by Salesforce.

    In general, analytics is being applied more widely across software development processes because organizations need to increase productivity while simultaneously reducing costs. It will be up to each organization to decide to what degree they may want to use that data to better train DevOps teams versus simply using it to remind those teams to stay focused on a specific set of key performance indicators (KPIs).

    In the meantime, the number of requests for reports being made to DevOps teams should decline as the process of collecting metrics becomes more automated. The challenge now will be making sure everyone reading those reports has the same firm understanding of what’s actually possible to achieve using not only the resources at hand, but also how any additional DevOps expertise might positively impact that equation.

  • Why We’re Swimming in Dashboards and Drowning in Data

    Why We’re Swimming in Dashboards and Drowning in Data

    Knowing how to use a dashboard is table stakes in the enterprise. Information technologies generate countless volumes of data from multiple sources, and dashboards are meant to harness all of that information, reduce the noise and display the stats you need to do your job. Yet businesses are still struggling to unlock the value of their data, with over half of global businesses (57%) claiming they can identify and capture just 70% of their data, according to a study conducted by IDC and commissioned by Qlik.

    As in “The Rime of the Ancient Mariner,” there is water, water everywhere, but not a drop to drink. Enterprises are inundated with dashboards and still struggle to make effective decisions with the information in front of them.

    The Limits of Analytics

    There are many reasons why a dashboard may communicate ‘bad’ or ‘useless’ information. Analytics can’t do it all. A data pipeline may be parched with too little data or flush with the wrong kind of data, limiting the volume and/or value of outputs that can be drawn into the dashboard. The organization may be heavily siloed, rationing the range of information available to the dashboard. Or, the tooling itself might be inadequate for leaders to quickly respond to opportunities and disruption.

    When a decision-maker looks at a dashboard, they want to see things as they could be, as well as how they are. That requires a dashboard that depicts the data itself, but that also generates views of, for example, how it looks when sales activity in the Southwest is increased in the face of a weather event or other externalities. Results don’t have to be taken at face value – they can be analyzed more carefully and intuitively to uncover meaningful insights.

    Investigatory analysis is what modern, interactive dashboards and applications are all about. They support non-linear exploration and search and provide advanced features, such as augmented analytics, to help subject matter experts explore data and generate insights without relying on IT, data scientists or expert analysts. Interactive dashboards also make it possible for business intelligence to be truly self-service, simplifying aspects that were once limited to experts working in much more complex environments. They give all employees access to the insights they need to make better decisions, regardless of their skill level, essentially democratizing analysis across organizations.

    How to Choose the Right Dashboard

    For any business looking to really expand decision making across the business, here’s how to find a dashboard suited for investigatory analysis:

    Accessibility and timeliness: In the past, business users who wanted insights had to submit a request to an analyst, wait for their turn in the queue and go back and forth answering clarifying questions before they could review a dashboard and make decisions. The process took too long, and insights came too late. With modern, interactive dashboards, users can explore all their data using interactive selections (filters), search, and NLP (natural language processing) powered by AI. In the end, they can ask and answer all their questions leading to informed decisions.

    Flexibility: Modern dashboards are not just static displays of content with limited filtering. They are rich analytics applications that provide unmatched interactivity and exploratory power. Business users aren’t limited to rigid, linear analysis on partial subsets of data. Instead, they have the freedom to explore all their data however they like. Analytics are always in context together, giving users peripheral vision, and all data relationships are exposed – including what’s related to your selections and what’s not.

    Performance: Interactivity should be driven by outcomes. Novel techniques to optimize and store data, index and understand relationships and deliver high-performance calculation all help to go beyond the limits of query-based and RDBMS architectures. Interactivity should also be enhanced with AI to deliver next-level analytical power, in new forms, across a full range of user experiences.

    A Crucial Tool in the Stack

    Turning data into business value is what a dashboard should—and can do—for the business. When a business user looks at a static dashboard or visualization, they usually end up with more questions than answers. To make an informed decision, they need to go through a process of questioning and evaluating – and then questioning again – an interactive display of business-critical trends until the right insight is fully uncovered. This iterative process is unique to every user and their lines of thinking, and modern dashboards allow all users, beyond data experts and analysts, to build visualizations and queries.

    In addition to creating business value, interactive dashboards help rally key stakeholders in organizations and allow them to act quickly to changing market needs. Take, for example, a major luxury fashion retailer; parent company of three well-known apparel brands. Their businesses hinge on having the products consumers want and need, when they want and need them. Their assortment planners need to analyze their sales mix and inventory mix by product attribution to identify mismatches and, more importantly, understand the drivers behind the mismatches to make more accurate inventory recommendations. Interactive dashboards allow them to investigate their data in different ways and ultimately inform strategic decisions for the business moving forward.

    In addition to empowering users to transform data into business value, dashboards ultimately drive the need for data literacy. Sharing dashboards throughout all levels of an organization fosters a data-driven culture by encouraging exploration of data – and that’s how new discoveries and innovations can be made.

    So while some say the dashboard is dead, I say long live the interactive dashboard.

  • How to Modernize Data Integration

    How to Modernize Data Integration

    In times of uncertainty, accurate real-time data becomes essential to informed decision-making. When the pandemic ends and businesses begin to reopen, this will be truer than ever. While there is no precedent for COVID-19’s impact on the economy, what is clear is that the enterprise is clamoring for more analytics than ever. Data engineering is at the heart of operationalizing the delivery of that data, wherever it originates and wherever it’s needed.

    To operationalize data flows, engineers must be able to collaborate with different personas, reuse peer assets, support data pipelines in production and, as platforms and business requirements change, evolve quickly and with confidence. The focus of data engineering can no longer be limited to ease-of-use and developer productivity. In today’s fast-changing world, we need to enable modern engineers to embrace DataOps. In doing so, they will be able to guarantee continuous data for fast, confident decisions by and for the business.

    Current Options Are Too Simple or Too Complex

    Current approaches follow either a “grab-and-go” mentality that focuses on simplifying ad-hoc access for first-time analysis, or lurches towards specialized coding for anything complex. Both of these approaches lead to ongoing and recurring headaches. Significant effort is required to debug data pipelines, rerun them and rework them every time a change happens. Today’s data engineers end up spending 80% of their time just keeping the lights on, leaving very little time for new value-added work.

    Using Intelligent and Responsive Data Pipelines

    Data engineers face mounting pressures and challenges, from an ever-increasing project backlog to an accelerating pace of upstream changes to the emergence of cloud data platforms driving re-platforming projects. To tackle these issues, engineers need a solution that allows them to operationalize their work by abstracting the “what” of the data—the business meaning and the logic—away from the “how” of the data—the technical implementation details that the business doesn’t care about. To achieve this, businesses need to think about data pipelines as dynamic, intelligent sources that can (and should) be capable of real-time adjustments.

    There are three ways that data pipelines can be considered smart or dynamic: they are easy to start and easy to extend; they are resilient to changes that occur over time and they are portable, supporting hybrid and multi-cloud environments.

    Companies that have focused on removing the “how” by developing intelligent and responsive systems free up their engineers to stay focused on the “what” – what are the outputs? Are the analytics providing the right ROI or information? They also make it easy to get started building pipelines through intent-driven design, removing tedious tasks for engineers and empowering ETL developers to self-service. This includes the repetitive task of managing data drift, whether it’s a schema change, a database version upgrade or a file format change. Smart pipelines handle such changes with minimal to no intervention required.

    Demand Continuous Data for the Business, Now

    COVID-19 has segmented businesses into have-lots, haves and have-nots. The have-lots have experienced unimaginable growth and, consequently, are generating incredible amounts of data. They have had to deliver better engagement with their constituents, optimize their product offerings and stop bad actors, fraudsters and cybercriminals from exploiting the unexpected surge in demand for their business. If they have risen to the challenge, you can bet that they have modernized their data practice and can deliver continuous data to all consumers.

    The haves and have-nots have generally been in survival mode, operating under short-term mindsets to reduce cost, consolidate as much as possible and wring out any waste. Depending on each individual situation, that may have meant staying on legacy platforms and postponing modernization efforts. Some have enjoyed cost savings by reducing consumption and negotiating with their vendors. Others have made a tactical move to the cloud, but simply as a path to lower costs of their data platforms. Only a select few have done the right thing and made the complementary investments in data engineering to reap the full benefits of their shift to cloud.

    As this pandemic comes to an end, the prospects for the haves and the have-nots will start to look more promising. If you have been focused solely on keeping the lights on and managing costs, you may have been mortgaging your future. This needs to end. Don’t wait. By modernizing your ETL to create more dynamic, real-time data pipelines now, your engineers can operationalize their work, deliver a new level of innovation and self-service to the business and demonstrate their true worth as data heroes.

  • Logz.io Adds Prometheus Service to Observability Portfolio

    Logz.io Adds Prometheus Service to Observability Portfolio

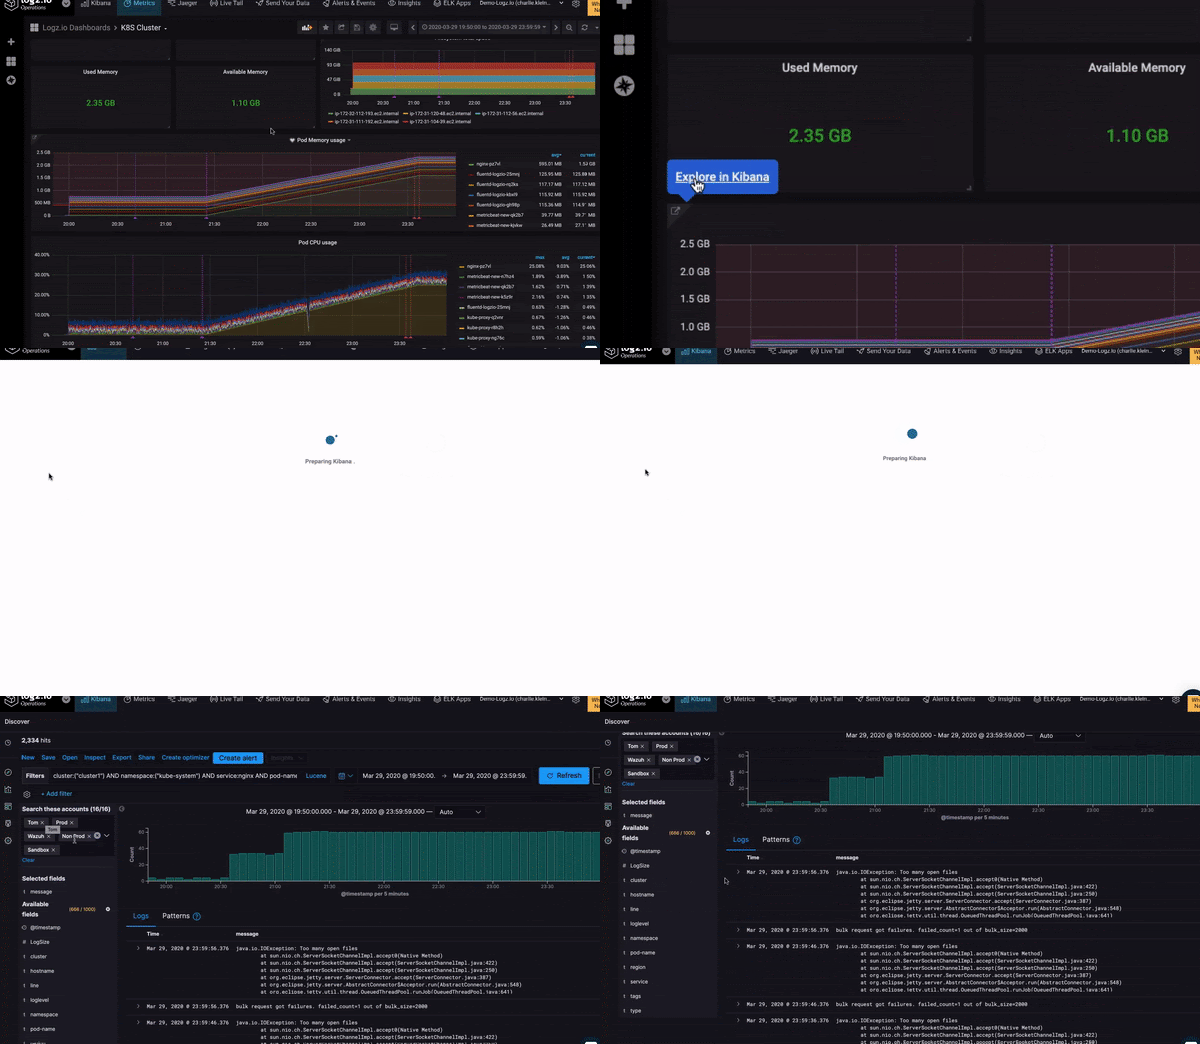
    Logz.io announced today the general availability of a cloud service, based on Prometheus, that can collect and analyze metrics alongside its existing log management service.

    Jonah Kowall, CTO, Logz.io, said the goal for Prometheus-as-a-Service is to provide IT teams with a centralized approach to analyzing data collected from instances of Prometheus running on local servers and clusters. While Prometheus is relatively easy to deploy, it’s not designed to scale horizontally, which means IT teams have to deploy multiple instances of Prometheus on a fleet of clusters and servers. The Logz.io service makes it easier to aggregate and analyze all the data those instances of Prometheus collected, said Kowall. That approach not only offloads the storage of those metrics, Kowall said, it presents an opportunity to correlate that data against logs and traces that Logz.io already collects.

    Logz.io, as part of that effort, is also making it possible to upload a Grafana dashboard, typically employed to visualize Prometheus data as a JSON file, to Logz.io, which will then convert the Grafana dashboards to dashboards based on the Logz.io user interface.

    While Prometheus is closely identified with Kubernetes, IT teams are starting to deploy the open source monitoring tool more widely to collect metrics. A recent Gartner report predicts that, by 2025, half of new cloud-native application monitoring deployments will rely on some form of open-source software to instrument applications. As part of that transition, Prometheus has already emerged as a de facto standard, Kowall noted.

    The primary focus, at least initially, is still on monitoring IT platforms, but as IT teams start to correlate metrics, logs and traces, they begin to benefit from additional context, otherwise known as observability, Kowall said.

    Observability, of course, has always been a core DevOps principle. However, as more applications become instrumented using open source tools and agent software, it’s becoming less costly to achieve. DevOps teams will still need to instrument each application, but the costs associated with collecting metrics and other data continues to decline. Most providers of monitoring tools and observability platforms are moving toward adding support for open source tools and agents to collect data alongside the proprietary tools and agent software they already make available. It will be up to each DevOps teams to decide whether to rely on open source tools or continue to rely on proprietary software that may be able to surface deeper insights or is simply easier to deploy.

    Regardless of the path chosen, the rise of microservices-based applications with numerous dependencies is forcing the observability issue. Microservices-based applications may not crash as frequently as a monolithic application because they are, ideally, designed to degrade gracefully in the absence of a single point of failure. The challenge is that, once they do degrade, it’s difficult to pinpoint the source of the issue; this may result in applications running sub-optimally for an extend period of time.

    The good news is that DevOps teams should now have the tools required to diagnose and resolve those issues long before any end user notices.

  • Logi Analytics Simplifies Dashboard Development

    Logi Analytics Simplifies Dashboard Development

    Logi Analytics launched a tool that promises to make it easier to design, build and embed interactive dashboards and data visualization within applications.

    Company CEO Steven Schneider said Logi Composer helps ease the task of creating data visualizations within the context of a DevOps workflow.

    Based on technology Logi Analytics gained via its acquisition of Zoomdata last year, Logi Composer enables DevOps teams to create interactive self-service dashboards for end users as part of a microservices architecture based on Docker containers, he said.

    To help achieve that goal, Logi Composer includes support for a range of Smart Data Connectors constructed as a set of microservices to access databases and other things.

    Schneider said as applications evolve developers increasingly are being required to embed business intelligence (BI) functionality within their application. However, he noted, most end users don’t want to move data into a separate BI application to analyze trends when they could be surfaced more easily within an application they are already using.

    The challenge has been finding a way to provide developers with a set of tools for building self-service visualizations in a modular fashion that makes them easier to build, maintain and update, he said.

    Of course, developers have been adding visualizations to applications for years. But most of those visualizations don’t let end users interrogate data—users now expect to be able to manipulate visualizations with a modern application at a much deeper level, said Schneider.

    A recent market study published by Dresner Advisory Services finds 62% of respondents consider self-service BI to be either “critical” or “very important.” A separate report published by Allied Market Research estimates the market for embedded analytics will generate revenues in excess of $60 billion by 2023.

    Data visualization is a critical aspect of every digital business transformation initiative. As organizations look to digitize more processes in the wake of the COVID-19 pandemic, the need for more robust data visualization capabilities within applications has become more acute. Most end users are unable to make sense of massive amounts of data without the aid of visualization tools.

    It’s unclear to what impact embedding BI capabilities within applications will have on standalone BI applications. There may always be analysts who want to pull data from multiple application sources to analyze trends. However, the bulk of users are likely to have their BI requirements met within an application that includes connectors to pull in external data when required. Applications that don’t include data visualization capabilities are not likely to be widely employed by users.

    Ultimately, embedded data visualization will reduce reliance on both spreadsheets and standalone BI applications. However, like most substantial changes to end user behavior, it may be a while before that cultural shift takes hold.

    In the meantime, DevOps teams should expect to see a lot more analytics functionality being embedded within applications. The challenge now is finding a way to streamline the development and deployment of those modules within the context of a larger application development project.

  • Logz.io Launches COVID-19 Dashboard

    Logz.io Launches COVID-19 Dashboard

    Logz.io this week launched a Community COVID-19 Dashboard Project that seeks to provide software developers and data scientists a reliable source of data to assess the global impact of the pandemic.

    Dotan Horovits, product evangelist for Logz.io, said the goal is to help organizations make sense of often conflicting data by making it accessible using a publicly available dashboard based on open source Kibana software. The data itself is stored in an ElasticSearch repository, he said.

    Logz.io also plans to make the data accessible via a dashboard based on open source Grafana software to make it easier to navigate time-series data, he added.

    Horovits acknowledges that the data concerning the COVID-19 pandemic is fluid at best. However, over time it will become easier to identify suspect data by applying analytics. Much of the COVID-19 data being made available is well-formatted, he said; the challenge is simply finding a way to aggregate that data in a way that is accessible to a broad range of potential end users.

    In the short term, Loz.io envisions organizations such as first responders using the dashboard to help optimize the deployment of limited resources. Longer-term, that data can also be employed to assess the impact the pandemic has had on everything from the environment and the economy to the mental health of individuals living in different regions. At the very least, access could go a long way to reducing the amount of COVID-19 misinformation being spread, Horovits added.

    Logz.io started with the COVID-19 data available from Johns Hopkins University. On top of that core set, the company is moving to aggregate data made available from additional public sources including media, governments and the World Health Organization (WHO). The company is also inviting any organization that has aggregated COVID-19 data to contribute to the project.

    Many organizations will, of course, use the data provided by Logz.io and similar initiatives to build a wide range of analytics applications. For example, it may be possible to avert future pandemics by identifying areas where individuals are experiencing high fevers sooner. Given the importance of those applications, it’s probable most of them will need to be built using best DevOps practices to ensure timely delivery.

    It’s not clear how the pandemic may advance data science. Organizations have been leveraging big data analytics applications for years. However, the pandemic may lead to more ambitious efforts to aggregate and analyze medical data on a global basis. Arguably, it’s been the absence of reliable data that has enabled the virus to spread so widely. Otherwise, initiatives such as social distancing might have been enforced earlier and medical facilities would have been outfitted with more equipment.

    In the meantime, there may not be much most IT professionals can do to combat the current pandemic other than working from home much like everyone else. However, in terms of preventing the next one, the level of data science expertise being applied to virus research may soon become a matter of life and death for millions of people.

    — Mike Vizard