
Tag: dashboard

  • Managing GraphQL at Scale

    Managing GraphQL at Scale

    GraphQL, the query language invented by Facebook, has attracted a lot of interest as a means to conveniently access data programmatically. GraphQL structures internal services with a unified schema for data, empowering product engineers to easily grab what they want from many microservices to populate the user interfaces (UIs) they’re creating. By unifying company data into a single graph, GraphQL combines the benefits of SQL with the ubiquity of API access.

    However, GraphQL does introduce some challenges when you’re trying to scale it across a large enterprise and partner ecosystem. For example, since GraphQL channels all requests through a single endpoint, security must carefully segment access to all the underlying infrastructure to avoid data overexposure. Matt DeBergalis, Apollo’s co-founder and CTO, also identified potential issues around changeability and performance when adopting a graph at scale.

    As the use of GraphQL within large organizations grows, development teams will have to overcome these obstacles—especially if companies intend to productize public APIs and reuse the same single graph company-wide. I recently met with DeBergalis for an update on managing GraphQL at scale. According to DeBergalis, we’re still in the early days of the graph revolution. And, future GraphQL maturity will require more rules-based declarative architecture, efficiency improvements and the adaptability to enact agile iteration of graph schemas.

    State of GraphQL Adoption

    So, what is driving the rise of GraphQL? Well, DeBergalis noted three key contributing factors:

    1. Many many microservices. In recent years, there has been an explosion of microservices. These modular services can be challenging to wrangle and are often exposed inconsistently throughout a software ecosystem.
    2. The rise of omnichannel platforms. Product engineers must now port the same data across disparate devices, whether streaming in a browser or on a Peloton screen.
    3. Users expect a hefty, data-rich experience. Expectations are at an all-time high. It’s now expected that an e-commerce shop, for example, will include product recommendations, auto-fill keyword search, pricing by geography and many more advanced features.

    Juggling all these factors creates a “complexity bottleneck,” DeBergalis explained.

    GraphQL responds to such complexity, helping unify the backend to enable product developers to fetch precisely what their client applications require. And, GraphQL adoption took off pretty quickly, particularly among product engineering teams, DeBergalis added. GaphQL plays nicely with familiar languages and frameworks like JavaScript, React and Relay. It’s also a bit different than previous trends, with demand being driven more by the database folks; “query people are really leading the charge,” he said.

    With the right technology stack, developers can add a graph layer between the underlying core APIs and the UI they are building, creating a universal API with a self-documenting schema. “For the developer, the amazing thing about GraphQL is throwing away all this boiler code,” DeBargalis said. GraphQL acts as “a foundation for tomorrow” to help deliver future business requirements, he said.

    With regard to architectural styles for APIs, 94% still use REST and 31% use GraphQL, according to the 2021 State of API Report from Postman. Though this percentage may seem small now, GraphQL adoption is steadily growing among large companies, such as PayPal, Netflix, Shopify, GitHub and Airbnb.

    Three Issues When Scaling GraphQL

    Using GraphQL is like using a mobile phone. You wouldn’t want to use a different phone every time you called a different number, would you? You would rather have all your contacts accessible from the same device. Similarly, GraphQL excels the more functionality is added.

    “Due to the network effect, a graph becomes more interesting as we publish more into it,” said DeBergalis. “What we have found is that GraphQL is most interesting and valuable at scale.” So, what are some inevitable consequences of GraphQL at scale? DeBergalis outlines three main architectural issues.

    Performance

    Performance downsides are one disadvantage that developers often cite when considering GraphQL. GraphQL has no built-in caching features, and the payload query could introduce additional latencies. Mitigating lower-level issues around throughput and reliability will likely require additional tooling from the community, DeBargalis said. This is partially why the Apollo team has begun to embrace Rust in new attempts to make infrastructure for GraphQL routing hyperefficient.

    Changeability

    A second problem enterprises may encounter when scaling GraphQL is embracing agility for such an all-encompassing fabric. “The companies that do GraphQL really well change it all the time—they treat it like a product,” said DeBergalis. This agility is at odds with the traditional REST API approach of building for longevity, which makes that approach extremely averse to breaking change.

    The reality is that when a company embraces a single graph, it may be pushing hundreds of schema changes every day. Different internal teams may maintain their own slice of the graph, defining it differently. Plus, maintenance roles may shift from team to team over time, noted DeBergalis. “If you try to waterfall what your inventory model should look like, you won’t get anywhere,” he said.

    Balancing change and stability will likely require a two-pronged approach to GraphQL. You want to continually iterate the graph with experimental features but also depend on certain functionality to preserve backward compatibility for client integrations. Satisfying both sides will likely require a change management strategy for iterating quickly, as well as enterprise-grade service level agreements (SLAs) to retain a firm bedrock on which to build more permanent data models.

    DeBergalis also described how observability is important for obtaining a clear picture of graph environments. This is one area where GraphQL shines—since clients request precisely what they need, you are never left wondering which methods are fetched but not implemented in production, as could happen with REST API management. According to DeBargalis, tracking fine-grained GraphQL usage with KPIs can help direct how the data model should evolve over time.

    Authorization

    Finally, perhaps the most significant concern surrounding GraphQL at scale is apportioning the appropriate access to users and devices. As a single unified endpoint can connect to a vast array of data behind the scenes, large GraphQL implementations will require a strategy for how that one unified graph can be implemented in parts.

    Without the proper access control, GraphQL could improperly expose personally identifiable information (PII). For example, a FinTech company may have a rule that requires a customer service representative to only have visibility into a customer’s transaction history if the customer has filed a support ticket in the last few days. Or consider data custody—a business working in the EU must comply with regulations on where data can and can’t live.

    Safeguarding GraphQL will require a declarative setting that integrates authorization control and context into GraphQL queries. To implement this, DeBergalis advocated for a command-and-control style. First, you build the schema around the data and problem statement. Next, you integrate rules field-by-field, marking sensitive touchpoints as PII.

    With rules baked into the query, you can have a more solid understanding of the surrounding context. “Authorization is actually a lot better at graph level,” said DeBergalis. “It’s the layer that has semantic understanding.”

    Future of GraphQL Scalability

    “Once you have a graph, you want to use it for everything,” said DeBergalis. The heritage of GraphQL is JavaScript, the language of the product world. And, the graph approach delivers an excellent experience for product engineers. The sheer usability and productivity benefits of GraphQL indicate incredible potential for projected use in the years to come.

    As we’ve discussed, scaling GraphQL across an enterprise will likely require performance improvements, a path for schema adaptability, policies to handle authorization for queries and greater accountability for business metrics. While GraphQL certainly has existing momentum among a subgroup of engineers, there are plenty of opportunities to introduce more training and educational curriculum to spread greater awareness.

    Furthermore, for those coming from a traditional REST API mindset, GraphQL is a bit of a new paradigm that will require some massaging to expose graph endpoints as a productized API. Doing so will likely involve marking select parts of the larger graph to expose to partners. “Starting with an internal GraphQL use case works really well, but productization around GraphQL is coming,” said DeBergalis.

    The value of a unified graph is so strong, and the bottom-up hunger for a graph environment is so intense that increased GraphQL adoption feels like a given. “At this stage, the focus is on expansion,” said DeBergalis. “How do we roll this out to more teams?”

    “We know there’s going to be a graph in every company—not a lot of little ones,” said DeBergalis. “Every company’s going to need a graph.” When that day comes, the architectural challenge will be breaking apart the graph into pieces. “That’s the next big frontier.”

  • ZeroNorth Adds Security Defect Density Dashboard

    ZeroNorth Adds Security Defect Density Dashboard

    ZeroNorth today announced it has added a Defect Density Dashboard to its software-as-a-service (SaaS) platform for managing and orchestrating application security scans.

    Company CEO John Worrall said Defect Density Dashboard borrows a concept employed to measure software quality and applies it specifically to application security. The dashboard surfaces the number of application security defects per thousand lines of code discovered during scans of code made using software composition analysis (SCA) and software application security testing (SAST) tools.

    That metric will create a key performance indicator that application security champions within DevOps teams and chief information security officers (CISO) can use to quantitatively measure the progress being made toward improving overall application security, he said.

    As organizations begin to adopt best DevSecOps practices Worral said one of the challenges IT leaders face is showing the board of directors that the level of investment being made is delivering measurable results. The Defect Density metric applies a concept that is already widely employed by quality assurance teams in manufacturing and other vertical industries to software development, he noted.

    As a provider of a SaaS platform for orchestrating security scans across multiple third-party tools, Worral said ZeroNorth is in the unique position of being able to normalize all the data generated by the tools.

    The Defect Density Dashboard also makes it easier to identify specific areas of weakness such as larger numbers of SQL injection vulnerabilities that would indicate a need to make additional training available to software development teams, he added, noting that approach allows the application security advocate to be viewed as an ally versus someone who merely criticizes the efforts of a software development team.

    Encouraging developers to scan their code before they make a commit is, of course, at the heart of any effort to shift more responsibility for application security to the left. ZeroNorth has been making a case for a platform that makes it easier to implement multiple scans across a DevOps workflow using different tools. That approach makes it more likely that a vulnerability that isn’t discovered by one tool is uncovered by another.

    The challenge, of course, is making sure developers scan their code often. There is a natural tendency to delay a scan in the name of productivity. However, the larger the base of code that needs to be scanned, the longer it takes to complete those scans. Most developers would be well-advised to scan smaller amounts of code more often.

    Regardless of the approach to scanning, developers should expect to be evaluated based on the number of vulnerabilities that are inadvertently introduced into their code. Cybersecurity teams can no longer keep pace with the rate at which application code is being deployed and updated. As such, many organizations have launched a concerted effort to eliminate as many vulnerabilities as possible before code gets deployed in a production environment. It may never be possible to eliminate 100% of vulnerabilities, but at the very least the most common exploits that cybercriminals actively scan for when looking to compromise an application can be greatly reduced.

  • New Relic Extends Reach and Scope of AI Capabilities

    New Relic Extends Reach and Scope of AI Capabilities

    New Relic this week announced it has extended the capabilities within its New Relic AI module to include support for additional data sources and provide access to more advanced analytics.

    Integrations with Splunk, Grafana, Prometheus and Amazon CloudWatch are now provided along with support for a number of incident management platforms, including ServiceNow, OpsGenie and VictorOps. New Relic AI previously provided support for the incident management platform from PagerDuty.

    DevOps teams can also surface more details about anomalies, including attributes that caused spikes, related signals to investigate root cause by looking at what happened around the anomaly and view upstream and downstream dependencies.

    Guy Fighel, general manager and group vice president for New Relic, said these and other capabilities being added to extend the capabilities of a monitoring platform that as a software-as-a-service (SaaS) platform provides a natural focal point applying machine learning algorithms to the massive amounts of data required to inform an AI engine.


    Other new capabilities being added to the platform include the ability to infuse correlations with decision logic to drive custom decisions and greater transparency into why and how correlations are performed.

    New Relic AI has also been enhanced to reduce the number of extraneous alerts that might be generated in addition to providing insights into the rate of total incidents correlated, total correlated issues, rate of noise reduction and the most common reasons why incidents are correlated. New Relic AI also provides access to a configurable set of filters to specify a grace period for each issue priority.

    Fighel said the goal is to make it possible to continuously evaluates telemetry data for anomalies and then share those insights via existing collaboration tools. To accomplish that goal, New Relic AI ingests multiple data types, including alerts, logs, metrics and deployment events.

    New Relic doesn’t see AI replacing the need for IT teams anytime soon. Rather, Fighel said AI will augment existing IT staff in a way that enables them to determine the root cause of any issue faster. Monitoring tools accessed via the cloud make an ideal platform for infusing AI into a service where data already reside, said Fighel. In contrast, other platforms require IT teams to aggregate massive amounts of data to enable an AI model to be trained.

    There’s naturally a high degree of skepticism when it comes to applying AI to IT management, but Fighel said it’s only a matter of time before AI capabilities are taken for granted. In fact, as IT environments continue to become more complex and there is an increased focus on driving down IT costs in the wake of the COVID-19 pandemic, it’s now only a matter of time before AI technologies become more widely adopted.

    In the meantime, DevOps teams should expect many of the rote tasks they need to perform today to become increasingly automated. That might make some members of the IT team uncomfortable, but before long most IT professionals won’t really miss aspects of their jobs that today are little more than pure drudgery.

    — Mike Vizard

  • Splunk Adds Remote Workforce Metrics Dashboard

    Splunk Adds Remote Workforce Metrics Dashboard

    Splunk has made available a Remote Work Insights dashboard designed to help IT administrators track and identify the most relevant IT metrics for a workforce that is working from home to help combat the spread of the COVID-19 pandemic.

    Company CTO Tim Tully said the dashboard is initially configured to track virtual private network (VPN) traffic as well as access to cloud applications being made via an instance of an identity management platform from Okta.

    In addition, the dashboard tracks the level of usage of Zoom video conferencing services to help determine to what degree employees are continuing to collaborate during the pandemic.

    The level of productivity being achieved in most corporate environments is tied directly to the amount of network bandwidth being made available via a VPN, which can be deployed inconsistently on various client devices. Cloud application experiences, meanwhile, can vary widely based on the geographic region an end user is located.

    The dashboard helps IT teams to determine where there are issues they can address and where there are issues that may need to be addressed by a third-party service provider.

    Built on top of the Splunk Mobile applications, the dashboard provides a way for IT administrators to employ a tablet or smartphone to continuously monitor key remote connectivity metrics, Tully said, noting that capability means IT administrators don’t have to stay tethered to PC all day to monitor their environments.

    Over time, Splunk plans to add support for additional metrics to make it simpler for IT teams to monitor remote workforces, he added.

    Beyond simply monitoring metrics, the Remote Insights Dashboard also makes it possible to send rich notifications based on thresholds defined by the IT team. That approach allows Splunk Mobile to reduce the number of alerts being generated by the various IT platforms being monitored, said Tully. Those notifications then provide the relevant actionable intelligence IT administrators need to share with other IT professionals to remediate an issue.

    It’s not clear to what degree IT teams will work from home after the COVID-19 pandemic subsides. Many organizations may decide it’s less expensive to have IT teams work remotely at a time when many of them will be looking to, for example, reduce the amount of office space they require to reduce costs. Many organizations are about to discover that IT staffs, much like customer support personnel, don’t necessarily need to be in an office to be effective.

    Regardless of where they are located, many IT professionals are about to discover how productive they can be working remotely. That may create some boundary issues between the home and office. However, it should also go a long way toward eliminating the occasional need to go to the office at odd hours of the night, only to determine the source of a problem can only be fixed by a third-party service provider the IT professional could have contacted from home in the first place.

    — Mike Vizard

  • Chef Extends Automation Reach and Scope

    Chef Extends Automation Reach and Scope

    At its ChefConf 2019 conference today, Chef extended its core platform in ways that collectively serve to automate further the management of applications and the IT infrastructure they are deployed on.

    Extensions to the Chef Enterprise Automation (EAS) Stack include the addition of Application Operations Dashboards, Migration Accelerators for moving applications to the cloud and tighter integration between the Chef Infra and Chef InSpec modules within the Chef Habitat management framework.

    Brian Goldfarb, chief marketing officer for Chef, said these latest additions to Chef Enterprise Automation Stack are part of an ongoing Chef initiative to make it easier to seamlessly unify the management of infrastructure and applications in keeping with best DevOps practices, which Chef refers to as the “Coded Enterprise.”

    Chef DashboardAs part of that effort, Chef Application Operations Dashboards provide visibility into both applications and infrastructure to simplify troubleshooting and compliance, said Goldfarb. For example, IT teams will be able to see how individual security and compliance controls are performing across a heterogeneous computing environment that now includes Microsoft Azure and Google Cloud Platform (GCP) alongside Amazon Web Services (AWS), he said.
     

    At the same time, Chef is trying to make it easier to lift and shift applications to the cloud. EAS Migration Accelerators automate an application migration process that today requires most organizations to spend considerable time and effort to accomplish manually, said Goldfarb.

    An EAS Migration Accelerator for Windows, for example, will scan existing .NET applications running on IIS to discover configuration and dependency details and then package that information as code. That approach significantly reduces the time required to build application packages in Chef Habitat.

    Within Chef Habitat, the integration between Chef Infra, for automating infrastructure configuration, and Chef InSpec, a tool for automation compliance, is now more unified via pre-configured compliance profiles and cookbooks that make it easier to customize and modify which security and compliance controls are tested and enforced.

    Finally, Chef has also added support for high availability to the EAS platform to make sure the environment is always accessible.

    Goldfarb said the goal is to continue to make automation more accessible to IT generalists versus requiring them to hire and train dedicated specialists. One of the primary reasons that DevOps practices have been adopted so unevenly within IT organizations is the bar to master them has been set too high. By making it easier to automate the management of both infrastructure and applications, Chef is moving to lower that bar and make it easier to manage IT by unifying the management of applications and infrastructure, said Goldfarb.

    It’s too early to say to what degree IT automation will advance the adoption of DevOps. What is apparent is that IT environments are becoming too complex for mere mortal IT administrators to manage manually. IT organizations are also expected to be able to respond faster to any issues that arise, which requires IT teams to have a unified view of applications and the infrastructure o which they are deployed. In fact, as IT organizations continue down that IT automation path, many of them one day may discover they have embraced DevOps without even realizing it.

    — Mike Vizard

  • Redgate enhances the appeal of compliant database DevOps with new provisioning dashboard for SQL Clone

    Cambridge UK, Wednesday 24 October 2018 – The leading Microsoft SQL Server tools vendor, Redgate, has introduced a new at-a-glance dashboard to its database provisioning solution, giving users an easy way to manage, organize and make available masked copies of databases.

    Copies of production databases are commonly used in development to test changes against and ensure they are not breaking changes. Shifting left the testing in such a manner is one of the ways a DevOps approach can be applied to the database in order to speed up development and minimize deployment errors.

    Redgate’s provisioning solution uses the tried and tested virtualization technology built into 64-bit Windows to create database copies, or clones, which are a fraction of the size of the original. While they work just like normal SQL Server databases and can be connected to and edited with any program, they typically take up only megabytes of space, even for databases of 64TB in size.

    As importantly in an age when data breaches are prompting the introduction of stricter data privacy legislation, the provisioning solution also enables sensitive data in the clones to be masked at the time they are created.

    Rather than simply randomizing the data, it uses pseudonymization and anonymization techniques to ensure the database is truly representative of the original and retains its referential integrity and distribution characteristics. The sanitized copies can then be used to speed up development, accurately test code, and fix issues faster. Their small size also encourages a dedicated development model where developers are free to have their own personal copy of the database to work with.

    The increasing demand for and use of masked copies, however, can make managing multiple copies across disparate teams a complicated task. To address this, Redgate has developed a dashboard to make the searching, grouping, renaming and management of copies fast and easy.

    The copies in use can now be grouped by location, the database version they were created from, and the instance they are on, and searched by name, creation date or size from the dashboard. Importantly, if a developer tests a change which breaks their copy of the database, it can be reset to its original state in seconds rather than having to be deleted and recreated.

    The activity view additionally gives Database Administrators an instant picture of what has happened over the last seven days, who did it, and any errors that occurred. For errors that occurred previously, the log files can be retrieved in a couple of keystrokes.

    To increase security and further demonstrate compliance with data protection legislation, Active Directory role-based access can also be used so that users without appropriate permission only have access to masked copies of the database.

    As Rebecca Edwards, Redgate Product Marketing Manager, concludes: “At Redgate, we’re constantly talking to companies to discover what challenges they face in their desire to develop applications and databases faster while also keeping data safe. This latest addition to our database provisioning solution will help them comply with data protection legislation – and demonstrate compliance – while making their jobs easier.”

  • Electric Cloud and the Deployment Dashboard

    Electric Cloud and the Deployment Dashboard

    As my regular readers know, I started a series on companies that I found intriguing who were going to Jenkins World both late (a couple weeks before the event started), and ad hoc. That meant that companies I talked to on a regular basis came to mind, simply because I knew what they were up to, and whether or not they were going to Jenkins’ World.

    It turned out to be a popular few blog posts, both with readers and customers, but I was only able to fit three in before it was late enough in the event that publishing more would not achieve the goal of the series: telling you all about interesting bits to check out.

    But as these things go, the more I paid attention, the more interesting stuff I found. So I’m going to do a few “What you might not have seen at Jenkins’ World” posts to kind of get a chance to talk about other ideas that hold interest.

    Today, I’ll focus on a vendor I’ve followed but never actually used. That’s rare for me; generally speaking, if I’m writing about the product, I’ve used it. And no doubt I’ll snag a free license and put it through the paces, or have one of my coworkers do so. But for now, I’m covering them because I find what they’re doing to be of interest.

    The vendor is Electric Cloud. For those unaware, its ElectricFlow tool is in the same application release automation/continuous delivery (ARA/CD) market space that XebiaLabs (which I also wrote about at Jenkins World) XL Deploy is in. But the point of this blog is not to compare; since I have used both of XebiaLabs’ mainstream products and not Electric Cloud’s, a comparison would be unfair. I only mention XebiaLabs to help those just starting to research understand where Electric Cloud fits.

    dashboard
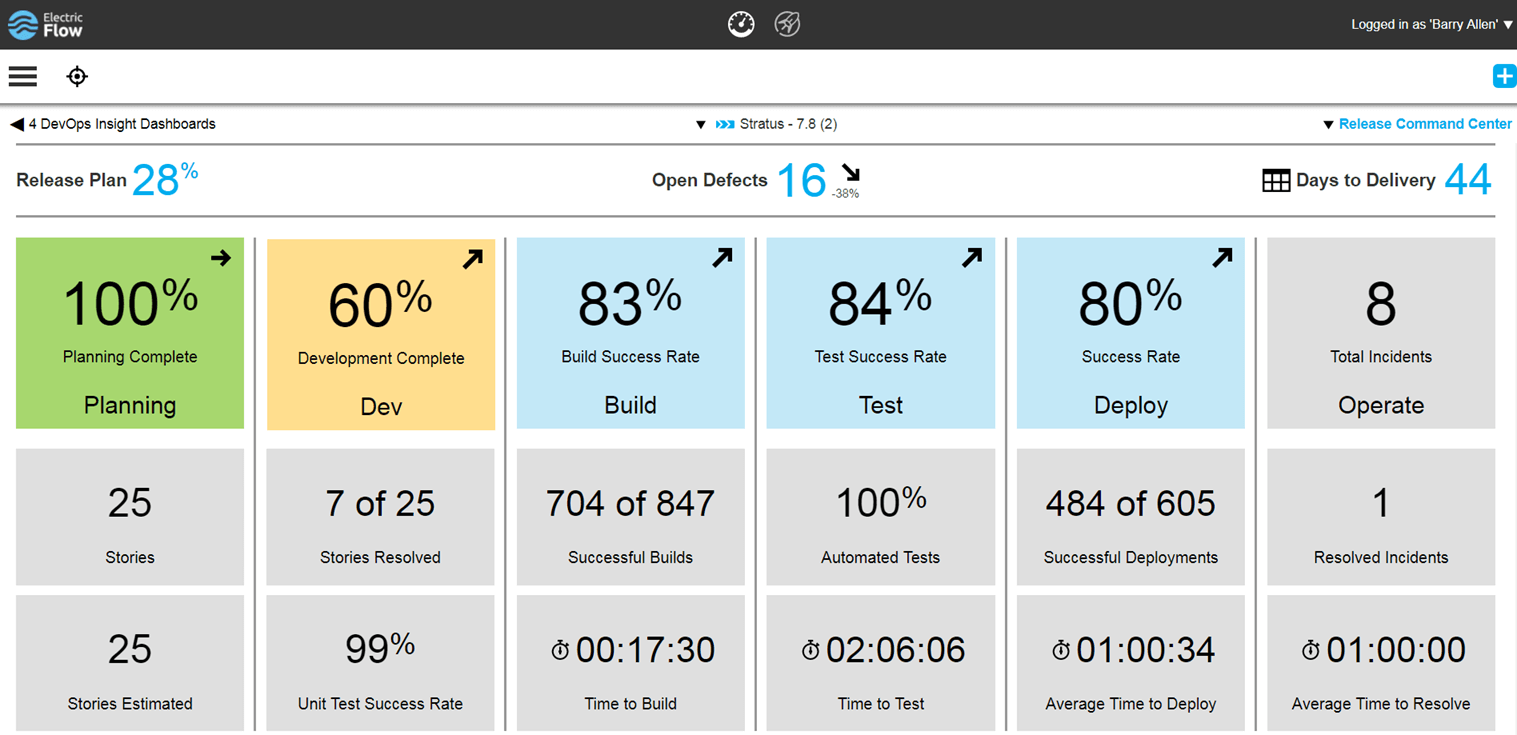
    Electric Cloud’s new dashboard

    Electric Cloud’s big bit at Jenkins’ World that intrigued me was its updates to ElectricFlow to allow better reporting. We all know when a build breaks, we have great systems on the AppDev side to notify the source of the breaks and project management of the issue. But as has traditionally been the case within IT, getting that information out to business leaders who have an interest in the application is spotty, at best. Combine that with the fact that what and how it is reported can vary project to project, and there always is a bit of confusion among the business about status of projects. This confusion translates to asking IT management about status and then, when IT management is wrong and a deadline is either missed or features are dropped from release at the last minute to meet the deadline, bad blood is created between AppDev/IT and the business. Since everyone at an org should be one team pulling toward success of the business, this bad blood is not good for anyone.

    It appears, from its release (I really wish I’d been at Jenkins’ World to poke the corners of this), that Electric Cloud has begun the process of bridging that gap. The growing number and complexity of toolchains means inputs are coming in from several vectors that can give indication of the status of a project. Instead of having IT management (or business management, at some orgs) run around and try to collect these disparate datasets and determine tracking for a project, Electric Cloud has begun the process of automating status collection/aggregation.

    The dashboard pictured above is a critical piece of this solution. Imagine giving business leaders access to a dashboard that doesn’t just cover the current step of a project, but tries to aggregate status from all of the steps in the DevOps life cycle. Basing this information upon release means that, over time, a library will build up that business leaders can reference to gauge this projects’ status against that of other projects, and make their business decisions based upon standardized inputs.

    This data already exists across IT, but this is the first solid attempt I have seen of a vendor tying it all together and presenting it in a manner that IT and the business can discuss with an eye to delivering. The more involved business leaders are in the process, the less friction will result, and this effort seems to be getting them more involved. While there is still much to do—note that unit test success rate is shown in the above screen capture, but unit test coverage isn’t, for example—this is a good solid start to setting up an easy-to-reference dashboard to show the business side what is going on with the project.

    There is also an API that can be used to set inputs to the dashboard that are not yet directly supported. While DevOps teams have plenty to do—and don’t really need to be developing plugins for tools that are supposed to improve quality while reducing workload—the ability to plug in whatever you need is useful for those shops where it is a priority.

    If you’re looking for a toolset that can give more information about what’s happening in your toolchain, it’s worth checking out the changes Electric Cloud has implemented, and I’ll be trying to make time in the next few weeks to give the tool a run and see how it works out. Though I see it as inevitable that the other ARA vendors will continue to increase their offerings also, sometimes it is worth checking into the early bird.

    — Don Macvittie

  • DevOps Needs a New Cloud Solution for Best Practices

    DevOps Needs a New Cloud Solution for Best Practices

    Imagine this scenario: You are a company building modern software which is a key driver of your business. To support this, you have grown your infrastructure organically over time by adding servers, storage, networks, security, virtualization software, monitoring, alerting and analytics tools. You have also added a plethora of other middleware, databases, messaging and operating systems that your developers need to build, test and deliver their applications.

    Because of this unplanned organic growth, there is no consistency in the environment. You manage, maintain and operate much of this environment manually. Your various specialist teams (storage, networking, security) begin to form fiefdoms around their respective functional areas. Change becomes extremely difficult and automating across silos turns into a maintenance nightmare. You over-purchase to meet the demand and risk under-utilizing resources. Your costs spiral out of control. You are now finding it a hopeless challenge to meet the needs of your developers—which was the primary purpose of doing all of this in the first place.

    Moving to a Modern Platform

    A modern DevOps platform should address the requirements of both your development and IT/operations teams. It should give software development teams an easy way to consume on-demand compute, storage and networking as well as provide easy access to continuous integration and continuous deployment (CI/CD) tooling and software services that help increase their development throughput and shorten product delivery. In addition, the platform should also empower operation teams to manage, maintain and operate the entire infrastructure environment with very few people using smart software that drives automation and intelligence into the entire stack.

    In short, it should have the ability to break the silos within your IT environment and between development, QA and operations teams. By doing this, you can increase the velocity of software development, improve infrastructure utilization, increase overall operational efficiency and reduce costs.

    Requirements for a Cloud Infrastructure That Streamlines DevOps

    There are several requirements for a modern, cloud-based DevOps platform. Let’s look at the key essentials of such a solution.

    Self-service API-driven infrastructure is a fundamental requirement to enable infrastructure as code, a key attribute to enable DevOps best practice. It allows developers to write code (which can be done using their favorite programming language) and make RESTful API calls to the underlying programmable infrastructure to manage initial deployments and configurations. It also enables them to manage ongoing automated dynamic provisioning of infrastructure, auto-scaling, monitoring and alerting.

    All this automation removes the confusion and error-prone manual steps for the entire application delivery process, including development, testing, staging and production deployments. This, in turn, accelerates software delivery and increases quality.

    However, building such a self-service API-driven infrastructure by yourself is not easy. The key component that drives up the cost is the operational complexity and the cost of experts needed to build and operate it.

    Smart software that drives intelligence into the stack. Very few solutions in the market automatically handle the full life cycle (deployment, upgrades, monitoring, alerting and ongoing resource management) of infrastructure and also allow seamless migration of workloads between private environments and public clouds. Additionally, if self-service is available as a SaaS-based delivery model, it is easy to add more features and workflows very quickly without having IT perform a major upgrade. If your solution comes with an on-premises install, ask how much work IT has to do to maintain this environment and how often new features will get added.

    Hyper-converged Infrastructure (HCI): Eliminating silos in the infrastructure. As mentioned earlier, silos impede velocity because they lead to complexity of operations, lack of consistency in the environment and lack of automation. A hyper-converged cloud design with a software-centric architecture tightly integrates compute, storage, networking and virtualization resources and other technologies from scratch in a commodity hardware box supported by a single vendor. This approach eliminates silos and lowers costs and complexity. It also makes it easy to start small and grow on demand while staying tightly right-sized on capacity and cost.

    A built-in browse-able categorized application store. DevOps engineers need readily accessible CI/CD tools such as Jenkins, Git, Maven or JUnit to automate the development and test pipelines. Additionally, tools such as Ansible, Puppet and Chef help with automated configuration and lifecycle management of workloads. Application developers need to quickly integrate and deploy middleware services such as RabbitMQ, Redis or storage back-ends including MySQL, Postgres, Cassandra or MongoDB. Single-click deployment of such services and other complex multitier network tools and applications greatly automates, accelerates and simplifies the development process.

    Seamless migration between private and public clouds. Developers and testers often need much greater capacity than is available on-premises for scale testing, and they should be able to move their application to a public cloud for such purposes. Alternatively, they may already have some applications running on a public cloud and they may want to bring them back to their private cloud for cost savings or better performance. For these use cases, a private cloud solution should offer seamless bi-directional migration between the public cloud and the private cloud.

    Dashboards and visibility for troubleshooting. One of the key advantages for a private cloud is that you can get complete visibility across the infrastructure and applications. In a public cloud, you can only get VM-level stats but have no control or visibility below that. Make sure that your private cloud solution can provide visibility to developers directly. Many vendors only provide access to IT, thereby controlling what developers can do and making IT a bottleneck in the application development and deployment process.

    Better insights to improve efficiency and capacity management. A cloud requires capacity planning, utilization monitoring, right-sizing of workloads and detecting zombie VMs and unused resources. Look for a solution that comes with built-in analytics, management tools and insights. An even better approach would be having a solution where you don’t have to install the management tool on-premises so that it can deliver its value as a service.

    To meet the needs of application developers and development frameworks and to create an efficient DevOps platform, companies should look at consistent converged architectures managed via smart software. This empowers application developers and operations teams to leverage a consumption model they want, while providing control to IT and making them relevant to your business success.

    Integrated intelligence and insights delivered as a service ensure that you never have to use spreadsheets to decide what to purchase and when. Cloud solutions with smart software ensure that you never have to make a Level 1 support call again; your management software can do that for you.

    About the Author / Kamesh Pemmaraju

    Kamesh Pemmaraju leads product management, product marketing, and technology partnerships at ZeroStack. Kamesh is a seasoned product management/marketing leader with a strong engineering and consulting background. In his most recent product roles at Mirantis and Dell, he focused on delivering private and hybrid cloud solutions to enterprises. He holds a Master of Science in Computer Science from Indian Institute of Science. Connect with him on LinkedIn and Twitter.