Tag: cloud service

  • AWS Taps Grafana Labs to Launch Managed Observability Service

    AWS Taps Grafana Labs to Launch Managed Observability Service

    Amazon Web Services (AWS), in collaboration with Grafana Labs, has added a preview of managed service based on the Grafana observability platform to its portfolio of tools for managing cloud applications and infrastructure.

    The Grafana platform is based on an implementation of the open source Prometheus monitoring platform being advanced under the auspices of the Cloud Native Computing Foundation (CNCF). The implementation curated by Grafana Labs is designed to centralize observability across multiple clusters using the same console.

    Grafana Labs CEO Raj Dutt said organizations running workloads on AWS can now more easily invoke an observability platform that runs on the same cloud platform on which they have deployed application workloads.

    In addition, Dutt noted IT organizations running workloads on AWS can seamlessly upgrade to Grafana Enterprise, which can pull information from third-party data from platforms including ServiceNow, Splunk, Snowflake, Datadog, MongoDB, Oracle, New Relic, Dynatrace, Wavefront and AppDynamics.

    Grafana Labs already offers both an on-premises edition of its platform in addition to a software-as-a-service edition. The edition that AWS is running provides access to an observability platform for applications running on AWS platforms. Organizations that want to apply the Grafana Labs platform to manage applications running on multiple platforms would employ the existing offerings available from Grafana Labs.

    The company also earlier this year added a distributed tracing platform dubbed Grafana Tempo that makes it possible to leverage existing object storage platforms and services to analyze traces. Grafana Labs also rolled out version 2.0 of Loki, which normalizes different structured, unstructured or JSON log formats in a way that allows DevOps teams to extract additional labels as well as enable additional filtering and grouping.

    In general, interest in observability is on the rise in direct proportion to the rate at which IT environments are becoming more complex. As more microservices-based applications are deployed, the level of dependency between them starts to increase exponentially. Attempting to correlate data generated by multiple monitoring tools is next to impossible, so IT organizations are starting to shift toward observability platforms that unify the collection of application and infrastructure metrics in a way that provides more context.

    Competition among providers of these platforms is already fierce, so the alliance with AWS is a notable endorsement of the approach being pursued by Grafana Labs. Less clear is to what degree IT teams will be replacing many of their existing monitoring tools once observability platforms are deployed more widely. Most existing monitoring tools are optimized for a specific class of infrastructure or application; in many cases, eliminating the licensing fees for those platforms would pay for the cost of standardizing on a single observability platform.

    Regardless of the path chosen, the way IT is managed is fundamentally changing. Each IT organization will need to adjust their IT management processes to keep pace with the rate at which IT is now becoming more complex. In fact, the next big issue may not be choosing which observability platform to select as much as it is navigating the profound changes to the internal IT culture that are sure to follow.

  • Red Hat Expands Scope, Reach of Ansible Automation Framework

    Red Hat Expands Scope, Reach of Ansible Automation Framework

    Red Hat, its online AnsibleFest 2020 conference today, announced an on-premises edition of Ansible Automation Platform dubbed Private Automation Hub and previewed technology to connect the Ansible Automation Platform managed as a cloud service by Red Hat and the on-premises edition.

    In addition, Red Hat is making available more pre-integrated workflows to its certified Ansible Content Collections service for Red Hat OpenShift, Kubernetes Core and the VMware vSphere REST application programming interface (API).

    Finally, the company previewed integration between Ansible Automation Platform and Red Hat Advanced Cluster Management, a tool originally developed by parent company IBM for managing Kubernetes clusters at scale. As part of that effort, Red Hat will integrate its implementation of Kubernetes Operators tools for deploying applications on the Red Hat OpenShift platform, which is built on top of Kubernetes, with a Resource Operator for Red Hat Advanced Cluster Management that will enable Ansible Automation Platform to execute tasks outside of the Kubernetes cluster when required.

    Joe Fitzgerald, vice president of management for Red Hat, said there are now more than 60 Ansible Content Collections available that can be deployed on-premises or in a cloud service managed by Red Hat. The connectors will make it easier for IT teams to access workflow content curated by Red Hat and its partners while continuing to create automated playbooks for their own unique IT environments that are stored locally, he said.

    As the number of IT domains to which a declarative IT automation framework can be applied continues to expand, Fitzgerald said the playbooks an IT team can create are becoming more comprehensive. Unlike other IT automation platforms, however, Ansible doesn’t require the IT operations team to learn how to code. In the wake of the COVID-19 pandemic and most employees working from home, the number of workflows that IT teams are trying to automate has increased substantially, he said.

    That framework can now also be applied to both legacy IT environments as well as Kubernetes clusters upon which the cloud-native technologies are being deployed. During AnsibleFest, Red Hat will be showing proofs of concept of support for Knative, open source middleware developed by Google that integrates serverless computing frameworks with Kubernetes clusters.

    While there are still DevOps teams that have adopted programmable frameworks to manage IT as code, many traditional IT administrators are embracing Ansible as a means to automate increasingly complex IT environments. Rather than acquiring and deploying automation tools for each platform in the IT environment, Ansible provides a common framework through which IT teams can automate the provisioning of servers, virtual machines, clusters, switches, routers and storage systems. With vendors such as Cisco Systems supporting Ansible, the number of workflows capable of spanning multiple IT domains continues to expand as internal IT teams share the playbooks either they created or had crafted for them by an IT services firm.

    Regardless of how an internal IT gains access to those playbooks, it’s probable that no matter what the automation requirement is, there is now somewhere a playbook written in Ansible to address it.

  • Observe Unveils Observability Platform Built on Snowflake DBaaS

    Observe Unveils Observability Platform Built on Snowflake DBaaS

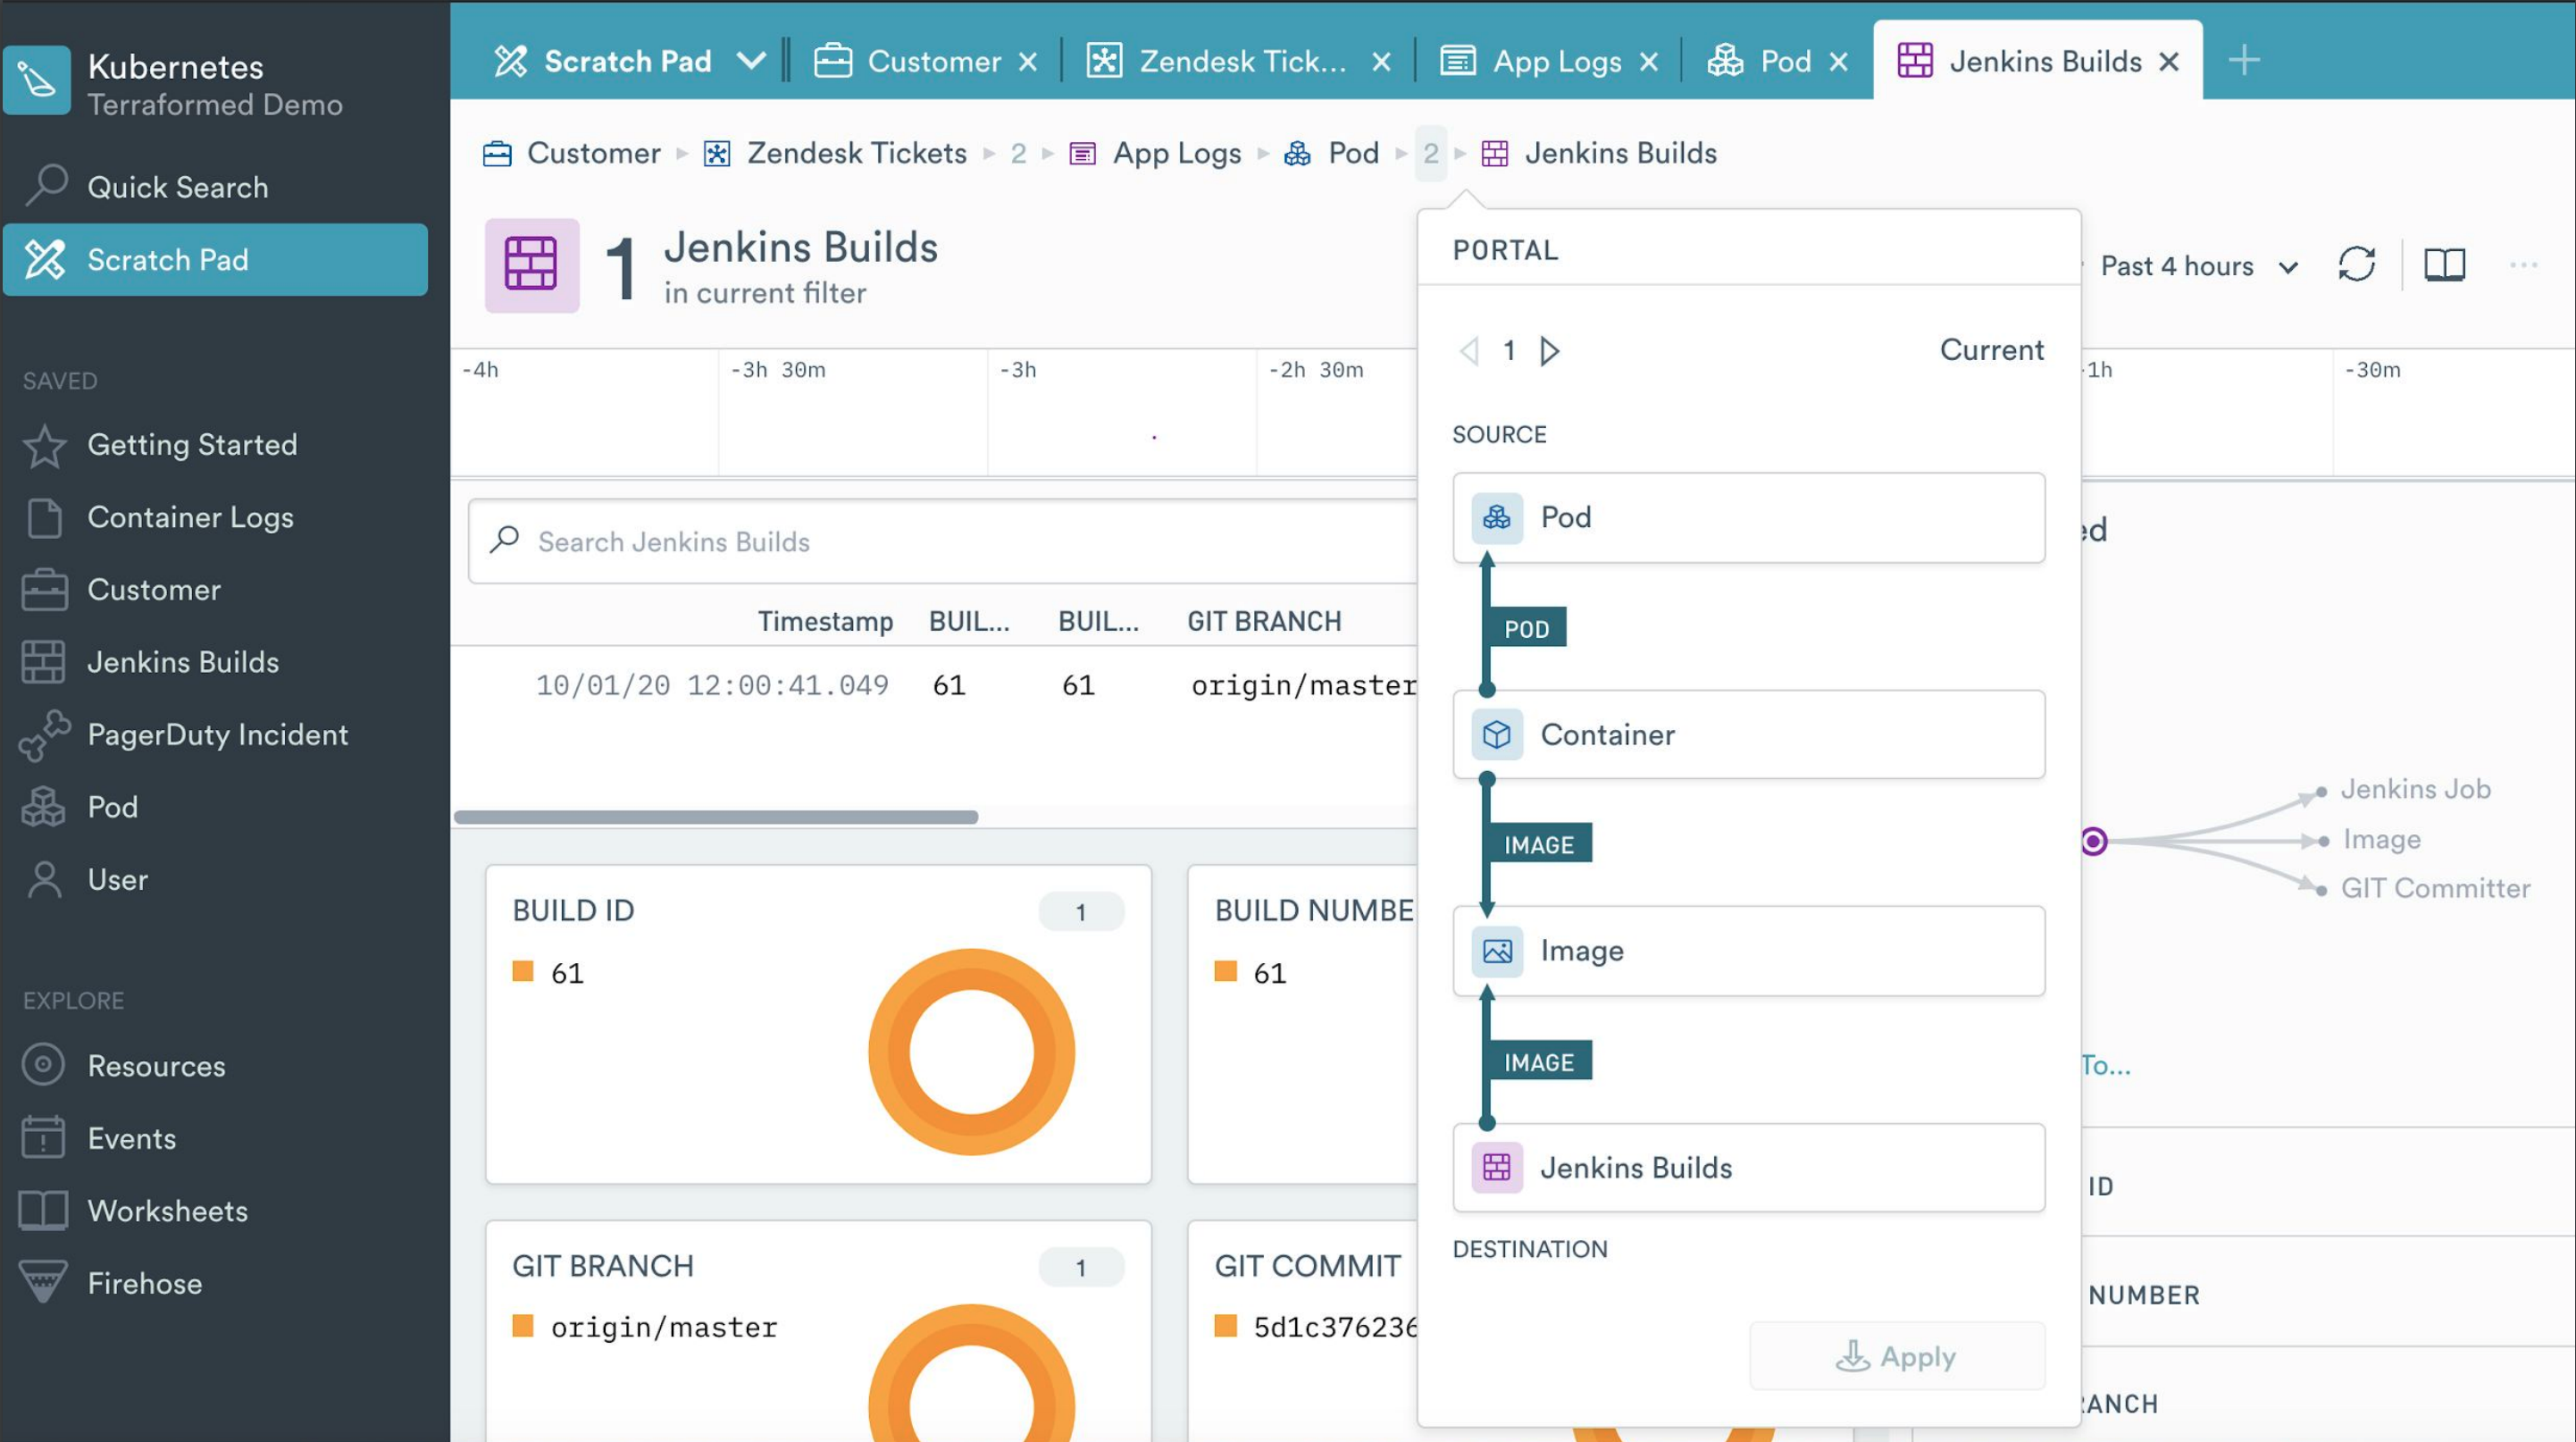
    After raising $35 million in seed funding, Observe Inc. has emerged from stealth with early access to a namesake observability service that leverages the database-as-a-service (DBaaS) platform created by Snowflake Inc.

    Company CEO Jeremy Burton said rather than build another data lake platform, it makes more sense to make an observability platform available using a software-as-a-service (SaaS) application model based on an existing cloud service.

    Burton said Snowflake, which is based on a relational database running on the Amazon Web Services (AWS) cloud, has already proven it can scale to ingest logs, traces and metrics. The Observe platform leverages that platform to correlate that data to monitor application and infrastructure environments in a way that provides more context than legacy tools that monitor software components and infrastructure in isolation.

    The context is achieved by creating a “resource” to represent, for example, a user, a session, a shopping cart, a pod, a container, a help-desk ticket or a build. Observe then enables IT teams to also track relationships between resources in a way that the average IT administrator can query without having to tag each resource, said Burton. IT teams can also track how the attributes of a resource change over time, which Burton noted can be employed to reconstitute the state of an entire IT system at any point in time.

    That approach can be applied just as easily to existing monolithic applications and emerging microservices applications because all the data required is ingested into the Snowflake service without requiring IT teams to first instrument and then update each application, added Burton.

    The pricing model for Observe will be based on the amount of data stored in the AWS S3 bucket and the number of queries launched. IT teams will purchase Observe credits that are billed only when the platform is actually used, noted Burton.

    While observability is a core tenant of best DevOps practices, Burton said there is a need to democratize observability in a way that allows any member of an IT team to troubleshoot any issue. There shouldn’t be a requirement to assemble every member of an IT team to diagnose an issue, said Burton, noting over time, that just aggravates developers who don’t really need to deal with, for example, an infrastructure issue.

    IT teams will be provided access to dashboards that enable novice or intermediate users to quickly ascertain the root cause of an issue, while more seasoned engineers with be provided access to worksheets based on a spreadsheet-like interface through which they can manipulate data, said Burton.

    Competition among providers of observability platforms is already fierce. However, as organizations look to rationalize existing legacy monitoring tools in favor of platforms that add more context, the overall size of the observability market will be measured in billions of dollars. Each IT teams will need to decide what type of platform makes the most sense for them based on costs and their preference for one capability a vendor might have that another doesn’t provide.

  • Sumo Logic Extends Observability Reach

    Sumo Logic Extends Observability Reach

    Sumo Logic, at its online Illuminate conference today, announced the availability of a bevy of extensions to its observability and security information event management (SIEM) cloud services that span everything from hybrid cloud computing to cloud-native platforms such as Kubernetes.

    The company also announced the general availability of a free Software Development Optimization (SDO) service, a business intelligence application that integrates and analyzes data collected from multiple DevOps tools to provide insights into software development pipelines in real-time. Based on metrics defined by DevOps Research and Assessment (DORA), a research arm of Google, SDO comes integrated with Jira, GitHub, Jenkins, Bitbucket, PagerDuty and OpsGenie and can be extended to other DevOps tools.

    Sumo Logic also updated its Application Observability service to be able to consume data generated by open source Prometheus monitoring tools as well as both Telegraf and Open Telemetry agent software for collecting and correlating traces with relevant logs and metrics. Dashboards and topology and entity models also have been added to create more intuitive workflows and cross-linking among troubleshooting playbooks.

    The company also announced the Sumo Logic Multi-cloud Observability service, which provides monitoring and troubleshooting capabilities across Amazon Web Services (AWS), Microsoft Azure, Google Cloud Platform (GCP) and hybrid cloud environments. In addition, it announced the general availability of Sumo Logic AWS Observability, a service that automatically ingests, collects, unifies and analyzes telemetry data from AWS services such as Application Load Balancer, Amazon Elastic Compute Cloud (EC2), Amazon Relational Database (RDS), AWS Lambda, Amazon DynamoDB and Amazon API Gateway. It is designed to detect anomalous events, including the timeline and scale of those anomalies, and then employs machine learning algorithms to surface the root cause of the issue.

    Sumo Logic is also making generally available a Kubernetes Observability service that automatically instruments and discovers topology and entities of microservices-based applications and automatically collects logs, metrics, traces and metadata to populate preconfigured dashboards and alerts. The company also launched a Sumo Logic Web and Edge Observability service to monitor and troubleshoot content delivery network (CDN) services from Akamai, CloudFlare and Fastly, as well as similar services provided by AWS, Microsoft Azure and GCP.

    Finally, Sumo Logic has enhanced its SIEM service to add support for chain, threshold and aggregation rule types and the ability to schedule searches of specific types of security events. The reporting and data ingest capabilities of the platform have been enhanced as well.

    Bruno Kurtic, vice president of product management and strategy for Sumo Logic, said observability takes traditional monitoring to the next level because as applications are instrumented, observability becomes a property of the application. That approach provides IT teams with the context required to resolve issues faster. Existing monitoring tools are isolated silos that generate data which IT teams then must correlate on their own to find the root cause of an issue. That approach results in time wasted that could otherwise be applied to more value-added tasks, such as developing applications faster, said Kurtic.

    Fresh off raising capital by becoming a public company, Sumo Logic is differentiating itself via a more unified approach to observability that provides deeper analytics, is more secure, and affordable through the usage of credits that IT teams and purchase and apply to any service as they see fit, Kurtic said.

    Of course, Sumo Logic is not the only IT vendor aiming to take IT monitoring to the next level. DevOps teams have no shortage of observability options. The challenge now is determining how best to act on that intelligence once it’s presented.

  • HashiCorp Adds Business Tier to Managed Terraform Service

    HashiCorp Adds Business Tier to Managed Terraform Service

    HashiCorp today announced it has added a Business tier to the HashiCorp Terraform Cloud that expands the managed service in a way that provides advanced security, compliance and governance capabilities along with the ability to execute multiple runs concurrently and take advantage of more flexible service level agreement (SLA) options.

    Meghan Liese, director of product marketing for HashiCorp, said this new tier addresses the requirements for enterprise IT organizations that are looking for a way to enable teams of developers to more securely provision IT infrastructure using open source Terraform tools.

    For example, the Business tier of the service provides integration with single sign-on tools provided by Okta, while auditing of logs is provided via integration with tools from Splunk. This tier also provides access to private networks with fixed IP addresses as well as self-hosted agents to interact with other management planes if required.

    HashiCorp reported that since launching a managed service last year for IT organizations that don’t want to provision the servers, it is now adding more than 5,000 new users per month, with 500,000 runs to provisioning infrastructure executed monthly.

    The other two existing levels of services provided by HashiCorp are free instances aimed at individual developers and a Team and Governance services that can be employed to create teams that manage and govern reusable instances of configurations.

    Liese said HashiCorp launched the Business tier in part to respond to the needs of enterprise IT organizations looking to automate the provisioning of IT infrastructure at scale. While there is a lot of free-rein usage of open source Terraform tools, Liese said enterprise IT organizations need to ensure security and meet compliance requirements.

    Those same enterprise IT teams also tend to provision IT infrastructure concurrently, which, Liese noted, means waiting for one configuration to be completed before another is launched isn’t practical.

    Terraform has gained a lot of traction among individual developers who have shown a tendency to prefer open source tools to provision IT infrastructure. That momentum has enabled HashiCorp to provide IT organizations with both commercial support for instances of Terraform they deploy and manage as well as via a service through which instances of Terraform are managed and updated by HashiCorp.

    Regardless of the path chosen, the number of IT teams provisioning IT infrastructure as code has increased substantially. Less clear is to what degree that provisioning is being done by developers versus IT operations staff who have mastered Terraform. At a time when many organizations are unable to add more IT personnel, the need to automate the provisioning of IT infrastructure has never been more acute.

    Of course, there are still more than a few IT teams who prefer to rely on IT administrators to provision IT infrastructure using legacy tools. However, as the pressure to become more agile continues to steadily increase, it’s now only a matter of time before the manual workflows constructed using those tools are rendered obsolete.

  • Barracuda Networks Partners With Microsoft on SD-WAN Service

    Barracuda Networks Partners With Microsoft on SD-WAN Service

    Barracuda Networks today launched a software-defined wide area network (SD-WAN) service that runs natively on the Microsoft Azure cloud.

    Klaus Gheri, vice president of network security for Barracuda Networks, said Microsoft has made it possible to launch an SD-WAN service using Azure Virtual WAN Hubs, a networking service based on a hub-and-spoke architecture that unifies networking services such as security and routing under a common interface. Those services span branch connectivity, multiple types of virtual private networks, cloud interconnects, firewalls and encryption services.

    Gheri said rather than having to replicate all those networking services, Barracuda Networks is layering a Barracuda CloudGen WAN service on top of the Azure Virtual WAN Hubs to provide a service that, like any other cloud service, can be consumed per billable hour.

    Developed in collaboration with Microsoft, the Barracuda CloudGen WAN service provides the management framework needed to convert Azure Virtual WAN Hubs into an SD-WAN service that IT teams can employ to securely connect remote offices to cloud applications or on-premises IT environments, he said.

    SD-WAN services today come in four basic forms. IT teams can deploy and manage their own SD-WAN appliances. Alternatively, telecommunications carriers make SD-WAN services available on their networks or a managed service provider (MSP) can create its own SD-WAN service by deploying the appliance on points of presence (PoP) on a global network it manages. More recently, cloud service providers have been making SD-WAN services available via the networks they built to connect all their data centers.

    Gheri said Microsoft is now taking that SD-WAN capability a step further by adding a management portal created by Barracuda Networks.

    A recent survey of 750 business and IT professionals conducted by Vanson Bourne on behalf of Barracuda Networks finds more than half (52%) are looking to employ SD-WAN services delivered via the cloud. In comparison, the survey finds 16% prefer to get SD-WAN from an independent vendor, 15% would opt for a telecommunications partner and 12% would rely on a value-added reseller.

    With more application workloads moving into the cloud, the way networks are deployed and managed is evolving rapidly. Instead of connecting branch offices to local data centers to access cloud applications, more organizations are employing SD-WANs to provide direct access to cloud applications without having to backhaul network traffic through a local data center. That approach significantly improves overall application latency and, in many cases, reduces the need to rely on leased MPLS lines from a telecommunications carrier.

    Rather than build those SD-WANs themselves, many IT organizations want to be able to access and manage them via a portal through which they can allocate bandwidth to applications as they best see fit. It’s not clear to what degree IT organizations will continue to prefer to deploy appliances versus consuming SD-WAN as a service. However, given the complexity of managing SD-WANs, there’s a high probability that SD-WAN services delivered via existing cloud networking infrastructure will soon become a widely employed alternative.

  • Commvault Extends Data Protection Alliance with Microsoft

    Commvault Extends Data Protection Alliance with Microsoft

    Commvault and Microsoft are extending their existing relationship to integrate Commvault’s data protection software with Azure Blob Storage.

    Azure Blob Storage is a service based on object-based storage optimized for unstructured data. Commvault last year launched the Metallic software-as-a-service (SaaS) platform, which provides a cloud-based approach to managing data protection, that runs on Azure.

    The two companies have pledged to extend that relationship to not only align engineering efforts but also enable their partners to more easily resell both Metallic and Azure cloud services under the same user contract.

    Manoj Nair, general manager for the Metallic service, said the Commvault offering presents IT administrators with a simple graphical user interface (GUI) and exposes application programming interfaces (API). That latter capability enables DevOps teams to automate the backup and recovery process via a cloud service, said Nair.

    Rather than having to rely on an IT administrator, the API enables DevOps teams to remove friction from the data protection process, he noted.

    The bulk of data protection processes are still managed by IT administrators. However, as DevOps processes continue to mature, data protection processes are becoming more automated. Developers not only want to be able to instantly recover data in the event of system failure but they also often use data protection tools to move data into and out of cloud computing environments.

    Nair said Commvault opted to extend its relationship with Microsoft in part because the amount of data being stored in the Azure cloud continues to expand exponentially as more organizations adopt Microsoft Office 365, Microsoft Teams and low-code applications built using Microsoft PowerBuilder tools. Collectively, those applications increase the amount of data gravity the Microsoft Azure cloud exerts. As the amount of data increases in the Azure cloud, the number of applications looking to access that pool of data increases steadily. As that data continues to grow, Nair said there will be a greater need for tools to protect that data.

    In general, Nair said many organizations underappreciate the need to back up and recover data stored by cloud service providers. The assumption is the cloud service provider will make it possible to recover data in the event of failure. In reality, cloud computing is based on a shared responsibility model between the end customer and the cloud service provider, under which responsibility for data protection—along with all other data management functions—belongs to the end customer.

    Of course, there is no shortage of data protection tools available. Many of those relied on today reside in an on-premises IT environment. In the wake of the COVID-19 pandemic, interest has grown regarding shifting data management tools to SaaS platforms that are more accessible. The issue many IT organizations will need to decide next is whether they want to rely on dedicated IT administrators to manage those processes versus reducing costs by employing APIs to automate a set of routine tasks that no one in IT especially enjoys managing.

  • New Relic Moves to Democratize Distributed Tracing

    New Relic Moves to Democratize Distributed Tracing

    New Relic has launched a service that leverages cloud resources to make analytics based on distributed tracing more accessible to DevOps teams.

    Andrew Tunall, general manager for New Relic serverless and emerging cloud services, said the New Relic Edge with Infinite Tracing service democratizes access to distributed tracing analytics by providing access via a software-as-a-service (SaaS) application that is managed entirely by New Relic. Rather than having to set up a platform to analyze distributed traces, Tunall said the New Relic Edge with Infinite Tracing service provides access to observability analytics for up to eight days.

    The service observes all application traces across distributed systems in a way that makes it easier to identify actionable issues, said Tunall. The amount of telemetry that’s emitted across a distributed system can easily involve tens of millions or even hundreds of millions of spans per minute. By keeping distributed tracing data on the public cloud, New Relic is also minimizing the amount of egress data from the cloud, which he noted serves to significantly reduce potential cloud computing costs given the fees cloud service providers charge for moving data off their platforms.

    Tunall said it’s become more feasible to employ distributed tracing rather than relying on sampling because modern applications are more highly instrumented. DevOps teams have realized access to telemetry data is at the core of any effort to enable observability within the context of best DevOps practices. The challenge has been that setting up the tools to achieve that observability goal has required the expertise of the equivalent of a site reliability engineer.

    The New Relic Edge with Infinite Tracing service, in contrast, provides easier access to observability tools based on distributed tracing to any member of the DevOps team, he said. That approach means for the first time in many cases, developers and members of the IT operations team will have access to a common set of tools for at least discovering the root cause of an application issue. In fact, the existence of such tools might go a long way toward fostering increased adoption of best DevOps practices.

    It’s not quite clear to what degree the rise of distributed tracing will impact the use of sampling to monitor IT platforms. In most cases, sampling is relied on to identify a potential issue, while distributed tracing provides the means to drill down to the point where the root cause of any issue is readily identifiable. However, as open source agents for capturing application metrics become more widely available and the cost of distributed tracing continues to decline, reliance on traditional sampling techniques might decline. At this stage, however, many organizations have not fully appreciated the difference between being able to completely observe an application and simply monitoring it, so it may be a while before distributed tracing is applied pervasively.

    In the meantime, at a time when applications are becoming more complex, the tools needed to manage them are, fortunately, becoming more accessible.

  • HPE Extends Reach of GreenLake Central

    HPE Extends Reach of GreenLake Central

    Hewlett-Packard Enterprise (HPE) has made available HPE GreenLake Central, a self-service portal through which IT teams can collaboratively manage and monitor instances of servers deployed in IT environments that are managed by HPE on their behalf.

    At its core, HPE GreenLake is a managed service that allows IT organizations to pay for IT infrastructure on a consumption basis. HPE meters usage and HPE ProLiant servers and bills customers accordingly. HPE GreenLake Central provides a portal through which IT teams can track usage themselves and provision applications both from HPE and third-party software vendors.

    Data management and file management software from Cohesity and Qumulo can be provisioned via the self-service portal. In addition, HPE GreenLake systems can now be co-located in data centers managed by CyrusOne.

    Keith White, vice president for HPE GreenLake, said HPE also provides via HPE GreenLake Central integration with Microsoft Azure Access Manager and Amazon Web Services (AWS) Access Manager services to make it easier for IT organizations to compare the cost of deploying workloads on-premises versus in the cloud, in addition to identifying potential compliance issues. IT teams still will need to access a separate portal provided by either AWS or Microsoft to spin up a virtual machine in the cloud.

    HPE claims to now have more than 800 enterprise customers consuming HPE GreenLake services. With many organizations opting to focus their efforts on building and deploying software, HPE is now making the case for a service through which it manages ProLiant servers and associated HPE storage on their behalf. In the wake of the economic downturn brought on by the COVID-19 pandemic, White said HPE expects to see increased demand for consumption-based pricing for IT infrastructure.

    Of course, IT teams have been consuming cloud infrastructure using various consumption-based pricing models for years. However, there are many workloads that for a wide variety of compliance, security and performance issues that still do not lend themselves to being deployed on a public cloud. HPE GreenLake provides the flexibility of a cloud service while still employing IT infrastructure deployed in a local data center.

    It’s unclear in the wake of the downturn how many additional application workloads might be moving into the cloud. The general expectation is that because many local data centers have been inaccessible during the pandemic, more organizations naturally will shift workloads to the cloud. However, a managed service from HPE also serves to eliminate the need to manage servers in an on-premises IT environment that are managed remotely by HPE. IT teams can remotely log into the HPE GreenLake portal from wherever they are located.

    Undoubtedly, the relationship between IT teams and vendors such as HPE is evolving. Many rote infrastructure tasks increasingly are becoming automated not just by the IT team, but also by the vendor that built the server or storage system. Of course, the automation being provided by the IT vendor only applies to their latest generation of infrastructure.