A few years ago, I had an idea about how to make publishing recipes on the internet more accessible and profitable. As a front-end engineer-turned-product manager, I could write code as long as it involved JavaScript. But I needed someone who could handle the whole stack, especially the back end—you can’t build a platform with frontend tools only. So I searched for a technical co-founder, poked around online forums and talked to friends. Eventually, I found a candidate (let’s call him Tom) who seemed like a good fit. He’d built a recipe app in the past and was comfortable with both the front and the back end. It seemed great. We struck a deal and dove in.
Tom started building the API and database while I made prototypes with a no-code builder called Bubble. I loved using Bubble. Without writing any code, I could build things fast and see what I was creating. Eventually, though, there were too many limitations with the no-code approach, including the lack of a Git repository for version control and history. So we decided to switch to full code with React Native mobile apps.
A few years prior, I’d switched career paths and became a product manager, but it had been a while since I had dug deep into writing code. And although I had a background in React, I felt insecure about building the frontend of a whole web platform on my own. But alas, you do all sorts of scary and undesirable things when you’re a startup founder!
After jumping into it, though, I quickly remembered that I really enjoyed coding. I picked up React Native pretty quickly and started building screens. Tom took care of the data while I took care of the UI. All was good.
Well, all was good until it wasn’t. We were a few weeks away from launch day and were finishing up. We even had a few early-access bloggers lined up to launch with us. And then, surprise! Tom decided to take a job as the CTO of another startup. His parting words were, “You’re technical enough; seems like you can handle it.”
I was floored. Aside from the front end, I had no idea how anything worked. We had cloud functions running on Pulumi hosted in Google Cloud, and I had no idea how they worked. I didn’t know how to train the machine learning AI models we used for ingredient recognition. The most I knew about SQL was that you used it to get stuff from a database. And to top it all off, our recipe scraping API was written in Python, a language I had no experience with, running a version that did not work on my M1 Mac. What in the heck was I supposed to do?
Well, I guess I did what any engineer would do. I figured it out step by step. When the Postgres database ran out of rows on the free Heroku plan, I figured out how to migrate it. When the recipe scraper API needed updating, I learned how to code in Python and deployed it with Docker. It was an incredibly stressful time. I was up against a looming launch deadline with a codebase teetering on collapse at any moment—mostly because I didn’t know how to hold it up.
The silver lining was the GraphQL API platform, Hasura. It was by far the easiest part of the stack for me to grasp. Understanding how our data was laid out was easy enough—I could simply explore it like a spreadsheet. I wasn’t sure how to build GraphQL queries, but the tutorials on the Hasura website helped me learn the basics and the query builder in the console did the rest. It’s no-code, but better—a no-code console makes it super easy to add new tables and modify permissions, and a Git repository keeps everything in check and easy to reference.
Once I understood how Hasura and the rest of the stack worked, I was able to finish the screens that I needed for launch.
Today, the company has grown significantly. We have a new co-founder, but she’s nontechnical. After figuring out how to run the entire stack, I decided I was technical enough to be the primary engineer. I’ve learned how to use all sorts of Hasura functionality that makes our lives so much easier—listening for events, firing off actions in our API to run business logic, and much more. Through all this, I now consider myself a full-stack engineer.
If our developers have what they need to create the best possible applications, they—and our customers—benefit
Goji Investments was founded on the principle of democratizing access to real estate, business lending, renewables and other alternative investments. The idea is to allow financial service organizations to provide traditionally unavailable investment opportunities to private investors on a global scale. A critical component of the Goji plan for success is the investment platform. Not only do we make the application available as a white-label solution, it can easily integrate into other platforms via APIs. We wanted to create a modular platform that we could update in pieces when needed and easily scale up as clients came online.
High-Performance Development Teams
A major reason for Goji Investments‘ success in these first few years is our high-performance development organization, which is instrumental in building and delivering the vision of the investment products needed to generate new business. As we’ve moved from simply building our applications into making them more scalable, we’ve focused on getting the right tools in place for Ops and Dev. Of course, bonus—it makes developers happier if they have cool tools to use.
One of the things we try to do is keep our application/platform deployment process as agile as the applications themselves—constantly looking to improve and making updates whenever necessary, whether needed to deploy new technologies and applications or based on feedback from the team. The idea is to keep our DevOps pipeline operating smoothly and efficiently.
One of our key operational strategies is that if we make our developers happy at work, they will deliver better quality applications, which results in happier end users. Of course, developers like to create to come up with innovative ways to deliver great features. One roadblock to coding innovation is performing repetitive low-level tasks, so we’ve actually gone out of our way to automate whatever we can and free up Dev resources for more value-specific application development.
Automating Deployments is a Start, but Just a Start
We automate the deployment process through GitHub. Each developer pushes their own services into GitHub themselves, where it goes through a quick review process. After review (if it passes), it’s merged into the master. Any master merge triggers build pipeline execution (which is using ThoughtWorks GoCD), and this automation includes several rounds of testing: unit test and integration test followed by an automated acceptance test. Developers have the option of executing additional tests themselves when desired.
Any new master is promoted into pre-prod, which mirrors production. When changes are finally rolled into production, we use HashiCorp Nomad’s blue-green deployment capabilities—if a problem were to occur (which means it was missed in official testing), Nomad takes care of any rollback needs.
The stack is fairly straightforward: The applications are written in Java and run on a DropWizard framework in containers. Nomad is our orchestration platform. One of our foundational principles when selecting application and infrastructure technologies is the ability to automate our deployment processes. We’ve done a fairly good job of automating anything we possibly could, but automating monitoring was more difficult. Our traditional APM tool was fine for alerting us to issues such as an EC2 crash or a resource availability issue for a reboot, but if we wanted to actually troubleshoot the issue we essentially just had to examine logs and hope we could see something out of the ordinary.
As much as everyone is excited about writing data into logs, combing through those logs to troubleshoot application issues is a waste of time and valuable developer resources. After all, operating 20 different microservices that cover everything from taxes and payments to customer notification required optimization of each element of the DevOps pipelines. The last piece we added was performance monitoring.
The Value of End-to-End Distributed Tracing
There’s a great line from Jurassic Park: “T-Rex doesn’t want to be fed. T-Rex wants to hunt.” Well, developers don’t want to be analyzing log files; they want to code. In fact, they want to be creating the next great feature. To get our dev team out of the weeds, we began thinking about a different way to get—and analyze—application performance data.
We wanted a system that added observability, monitored performance, managed service levels and included visibility from our end user requests all the way into our back-end systems. Oh yeah, we also wanted all of that to happen automatically so that our developers never had to worry about anything other than their own features. Installation, agent setup, discovery, mapping, alert configuration and reporting—as much as possible without requiring human setup.
We knew tracing was critical—so much so that we avoided missing any problems by specifying a 100% solution, wanting a complete trace of every request to the application.
Troubleshooting Application Performance Problems
The real reason you buy application monitoring software is to solve problems, so optimizing our ability to find bottlenecks and eliminate them is a key component of our monitoring solution. First, like the other aspects of monitoring, we didn’t want to have to spend time configuring thresholds for warning and danger alerts. Our need was for automatic anomaly detection with event analysis. Every little bit helps keep our dev team focused on dev, not analyzing data—especially in logs.
Of course, sometimes, you can’t help it; you have to look at log data, but we wanted to be smarter about that, too. We wanted our application monitoring tool to automatically integrate log analysis tools so that all data could be analyzed at the appropriate level whenever needed.
Don’t Forget Testing
Sometimes, testing gets lost in the value of a good monitoring solution. While we weren’t necessarily looking for a testing tool, we knew if a monitoring solution could also operate effectively in test (that’s not just the ability to run in test; rather, I mean the ability to add value in the testing process), well, so much the better.
It turns out that our applications are quite complex, and that complexity can create lengthier test cycles—commonly in this scenario:
We recently released a new feature for distributing dividends. As you can imagine, this is a fairly important feature, so we wanted to ensure that it operated as desired and expected. We were especially concerned with being able to scale the feature appropriately. We set up a stress scalability test that took 20+ hours to run (essentially processing hundreds of thousands of payments).
What we didn’t count on was having to stop some way into the test for someone to either submit an optimization update or actually fix a bottleneck—getting 10-12 hours into the test, then having to halt it and restart it—over and over and over again. We started thinking we might never finish.
This is one of the pain points we hoped to solve with an automated way of monitoring. By pointing the automatic APM solution at our test environment, not only did we not have to configure anything (or even set up a special start command) but we also got almost immediate feedback on any change (both positive and negative). It also pinpointed the exact location in the code where the problem occurred, so the developer could almost immediately update their code and initiate a restart of the test. Finally, we could pick any two runs and compare their execution and performance to identify the real problem.
Two things happened:
We were able to iterate different runs ~5 times faster.
We got such great bottleneck and debugging data from our solution that we cut the runtime of the test from 20 hours to less than one hour.
Give Developers the Tools to Shine
While all employees like to succeed, developers especially love when they can rise above their challenges and deliver high-performance code. We like to give our dev team the best possible tools to help them achieve this excellence. Approaching the decision process for selecting a tool for them should be handled no differently than thinking about your end users:
Identify pain points.
Find a resolution.
Execute the solution.
For our development team, that meant relieving them of low-thought repetitive tasks that we could automate and stop making them spend their time culling through performance logs.
Making the Right Choice??
The long and short of it is that we replaced our legacy APM tool with a solution that delivers the automation we crave and eliminates the need for log deep-dive analysis to solve any problem. It also supports log analysis with various integrations, which was important to us.
We get a trace of every single call, which is important to the Ops and customer support teams—and they profile every production process automatically, which gives our developers more than enough information to take action.
Ultimately, we’ve accelerated our application delivery and update processes, streamlined testing and monitoring. And our developers are super happy that we give them the tools they need and then challenge them to make the best possible applications using those tools.
I would like to share a recent case study on our organization, Logz.io, which battled a very serious performance issue, the solution for which turned out to be a small change in code but with a huge impact on all of our HTTP endpoints in our platform.
Among other topics, I’ll cover:
How we investigated and found the root cause.
Logs, metrics and tracing all together to have better observability.
How Jaeger, as a tracing tool, ease to visualize our potential bottlenecks.
How to correlate logs and traces.
Performance: Our Wake-Up Call
Some may say we are experts in observability and mainly in logging; after all, that’s what we do for a living. Once we encounter any performance issue, it should be no-brainer for us to fix it in no time.
That might be true in certain use cases, such as whenever there are few slow endpoints and identifying the root cause via logs is easy. But in practice, logs are not enough when the situation is more complicated. We’ll see this later on.
In our case, performance issues were reported especially during peak usage times—2-7 p.m. local time, overlapping between EU and U.S. customers.
We use our own product, just like any other customer, so we saw on our internal Slack channels that employees were experiencing increased latency over the same period of time.
Better Observability When Using Logs, Metrics and Tracing
To correlate users’ complaints and actual monitoring data, we usually check all three main pillars of observability: logs, metrics and trace data. Let’s have a closer look at how we used each one of them in this case:
Logs
Our log analytics product is built on top of open source ELK stack.
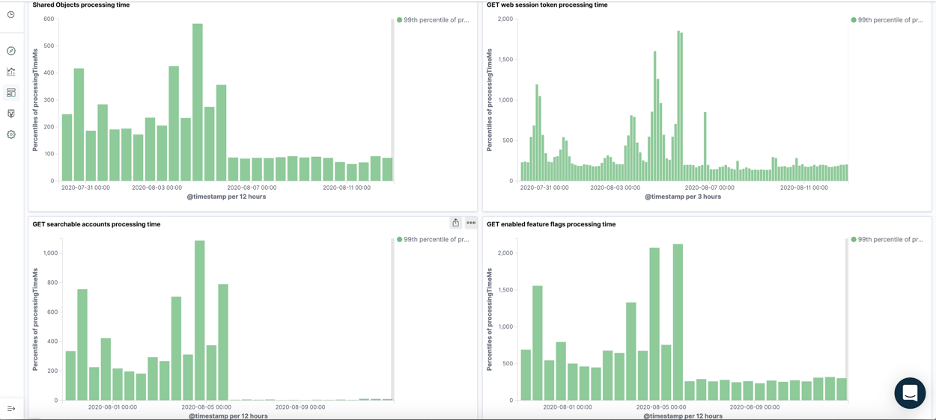
We use a custom field processingTime (the amount of time it takes for a backend endpoint to be processed) in our access logs and then visualize it over time in Kibana. That better picture can identify suspicious endpoints that take more time than anticipated in peak times. We can see below an example of an endpoint that consistently takes more time (ms) during the 2-7 p.m. window.
In addition to the processing time each suspicious request took, we saw growth in the number of requests to the microservice handling our user session tokens. Likewise, we noticed a very high load of requests during those same peak hours.
Metrics
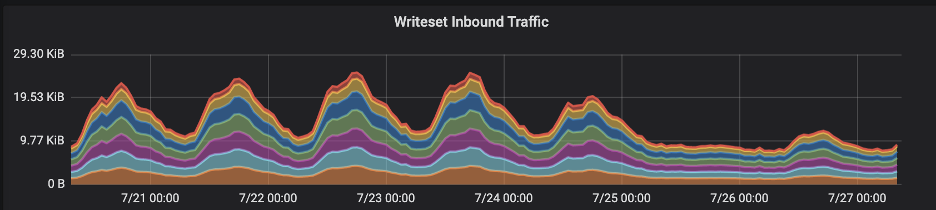
Our metrics product is built on top of open source grafana. In our backend infrastructure dashboards, we found consistent spikes in transaction commit size written into our distributed database (Galera). Those spikes correlated with the same peak times above between Monday and Thursday. Apparently, this might look pretty valid because these are our customers’ rush hours, but we’ll see later why it made us suspicious.
Additionally, we faced significant replication latency in our database cluster during the same period:
Distributed Tracing
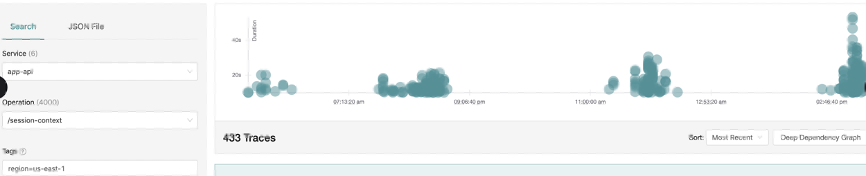
Last but not least, our tracing product is built on top of open source Jaeger. We checked for patterns of high latency by filtering out requests that took less than 5 seconds. Again, slow requests popped up more during peak hours.
Each type of representation of data has its own benefits, so with using Logz.io it was very easy to correlate all data and navigate between them to find the performance bottlenecks.
One of the must-have features to correlate logs, metrics, and traces is using the trace-id common tag. Alternatively, in lieu of it, another common tag such as request-id matches these requests throughout all of our microservices together.
Performance Investigation Deep Dive With Jaeger
As we already discussed, our goal was to find what made our application slower than usual during peak hours. We needed to trace our application flow to find out where the performance bottlenecks were. More importantly, we can track how we got there, i.e., find the request flows that led us to the suspiciously slow span. As modern microservice-based applications boom, it gets more difficult to trace things manually, by adding dedicated logs of before and after any needed code block. Moreover, it makes the code cluttered and unclear with unwanted log lines.
In our case, Jaeger made our life much easier. Especially for a new developer in the company who was not fully familiar with all of the involved components, it was easier to understand the business flow by identifying long-running spans before changing any code (which takes much more time).
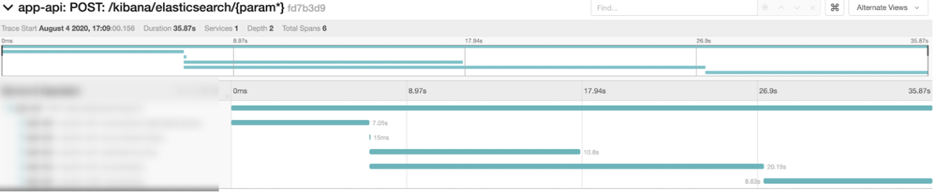
So, if we could point to the exact places in our code where performance bottlenecks, it would be super easy to fix it in no time. However, our case was a bit different. Virtually every endpoint in the back end was suffering at peak times while firing a search request:
Peak hours trace
Normally with slow search queries the suspicion falls on the database, in this case Elasticsearch. So, we correlated the above span from the POST /services/query request with our logs and realized that the actual Elasticsearch query only took 15ms! So, we were able to rule that out.
It’s important to emphasize that in non-peak hours, these microservices take 10 milliseconds at most:
Off-hours trace
As we can see, that looks way different from the example we showed before! So, why does it behave so dramatically worse in rush hours?
The Root of Performance Issues: We Found It!
We encountered pretty much the same slow pattern in all related endpoints when performing search requests. As a result, we were pretty confident that the root cause for all of it had to be in one of our core cache components. In other words, too many requests were delivered to our internal microservice (which serves the user session token object from the database) instead of getting it directly from the cache.
This hypothesis also fits the scenario above since more active users implies more SELECT and UPDATE queries for each user session token at precisely the same time we saw latency peaks in our graphs.
From there, finding the best solution was pretty straightforward and the fix took us just two lines of code! It was a matter of changing the configuration of our session token cache eviction policy.
Boommmm
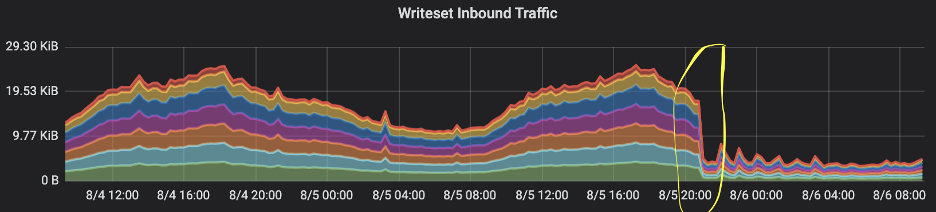
The most exciting part of these kinds of fixes is to see how all the graphs change immediately. The writes and reads traffic to and from the database, plus the high latency in many requests, dropped as soon as we pushed the fix live to production. The impact was absolutely clear in our application dashboards:
We could see the total size of transaction commits dropped right after the deployment.
Also, we saw the total number of requests to the problematic service cut off by more than 80%!
And most importantly, as soon as we deployed the fix, the latency dropped across all the impacted endpoints:
For the coup de grace, we were waiting to hear from our customers any positive feedback. And we didn’t have to wait long—we immediately received high marks.
Summary
We still have a long way to fully instrument our system, but even with what we did so far we see that the efforts have paid off. We got a really cool and meaningful view of our system, which makes us better understand our business flows and, more importantly in our case, to quickly identify any bottlenecks.
We already learned from our ongoing tracing adoption journey a few tips worth sharing:
Correlation between spans and logs is a must-have. The best practice for doing it is with a unique identifier such as trace-id or in case it’s missing with request-id. It brings a lot of value when you better want to examine a full request end to end by one click, which moves you to the respected logs page and vice versa. With Logz.io, you will get the log-trace correlation out of the box, which simplified things for us.
If your application is multi-tenant and you want a better view of traces of a specific customer, I’d recommend adding custom tags like customerId or userId.
If you want more finely tuned traces, consider adding custom spans for important pieces of application logic. Don’t just wrap every endpoint, which is the easy thing to do. If we suspect, for example, a slow query in the database, we can easily add in code for a custom span that will measure just this section and then it’ll be visualized under the parent transaction span, so we can see how much time it takes comparing the other spans.
Having Logz.io made our journey much smoother—having logs, metrics and traces in one consolidated platform without the need to install and maintain it ourselves and with built-in correlations.
How DevOps is helping one company ensure an active older population can remain independent
SOFIHUB home is designed to support older people who wish to live as independently as possible. However, its sensor-based system needed an upgrade to improve the user experience.
The SOFIHUB technology connects wirelessly to sensors placed around the home and learns the individual’s habits. When it detects deviation from the user’s routine or other issues, it asks if they are OK. Unless the answer is affirmative, it automatically contacts a nominated carer.
However, the existing products were created with a risk-aversion mindset and built to standards rather than user requirements, which sometimes impacted the user experience. “The market required a change,” said SOFIHUB CTO Ian Aitken.
For example, personal alarm pendants intended to detect falls generated four false alarms for every real fall they detected. A common cause of false alarms was the pendant accidentally hitting a piece of furniture.
In any case, only 4% to 12% of pendant owners actually used their devices, he said, mostly because they forgot to put them on after showering or dressing in the morning. Plus, many often regard pendants negatively, referring to them as “cowbells.”
So SOFIHUB changed its approach, placing movement sensors around the home to detect when the person moves from one room to another.
The SOFIHUB System
The sensors communicate via Z-Wave with the Raspberry Pi-based SOFIHUB home, which processes the data. The Raspberry Pi is capable, stable and cheap, said Aiken. But the finished product required additional custom electronics to provide power management and other functionality. The designers also added a microcontroller that monitors the Raspberry Pi and restarts it if necessary.
Caregivers receive alerts if the person is late to bed, late to rise or spends longer than usual in the bathroom, or if there is a lack of movement for longer than usual. Machine learning algorithms developed in conjunction with Monash University detect these patterns.
SOFIHUB is also able to deliver reminders such as those for appointments and birthdays or, working with a medicine cabinet sensor, when it’s time to take medications.
The optional SOFIHUB beacon is a panic alarm that can also generate alerts when it detects the user has left a geofenced area or has fallen. Since the hardware is basically a mobile phone without a dial pad, caregivers can call it to converse with the user.
Where the use of conventional pendants was about 10%, the use of the SOFIHUB beacon is around 60%, partly because the system reminds people to keep the beacon charged and take it with them. For example, it suggests they pick up the beacon from the charger once it has reached 80%.
The system transfers data collected by the SOFIHUB home to cloud-based infrastructure for longitudinal analysis and other purposes.
SOFIHUB Under the Hood
The company developed and must maintain several layers of software: code for the main board and the microcontroller within SOFIHUB home, code for managing Wi-Fi and cellular communications, and the code that runs in the cloud. SOFIHUB uses containers and infrastructure as a service (IaaS) rather than platform as a service (PaaS), so it can easily move from AWS to another host if necessary.
“We’re reasonably sophisticated,” said Aitken. For example, the company created a separate domain for a new corporate customer in around a day and a half, thanks to the level of automation within its DevOps processes.
The SOFIHUB service is also available through alarm center companies to ensure someone is always available to react in emergencies. Onboarding a new alarm monitoring company is usually a quick process, even if custom features are required. Sometimes implementing old protocols still used by some alarm centers takes longer.
“We are a highly skilled team of developers” and database experts, said Aitken. This “small, very agile team” works without dedicated operations staff, although two people specialize in building and maintaining implementation scripts.
The AppDev Toolkit
The team has adopted widely used tools (eg, Jira, Confluence, Slack, GitHub and CircleCI), and a well-developed release mechanism sees code start in a developer’s instance before moving into the AWS environment for additional testing.
From there, it progresses to the user acceptance testing environment to deal with any UI and browser-specific issues. After that, the code goes into production.
SOFIHUB does not do automated testing. Aitken said that’s because it actually slows development to an unacceptable degree, roughly doubling development time due to the effort needed to write the tests.
New releases occur every Wednesday with two fortnightly development cycles running side by side. Aitken said he expects the pace will slow as the product becomes mature and foresees monthly releases starting sometime in 2021.
How Red Hat’s Open Innovation Labs have helped accelerate Lockheed’s software development for the F-22 Raptor
As the key government contractor charged with helping the U.S. Air Force keep its F-22 Raptor jets in fighting trim, Lockheed Martin Aeronautics increasingly values software delivery speed as much as engine speed. So much of the continued evolution of these fighter jets depends upon continual upgrades of the software code powering all of the physical systems built into them, from tip to tail.
Until a year ago, these jets, which first rolled out of the manufacturing plant in the 1990s, were supported by the waterfall development methods of that same era. Lockheed executives and Air Force brass recognized that the F-22 needed a DevSecOps transformation, and fast.
“When you have a world-renowned platform like the F-22 Raptor, adversaries are constantly looking for ways to counter it,” said Michael Cawood, vice president of F-16/F-22 product development at Lockheed Martin. “This means we must constantly add capabilities and improve the F-22. And we must do it faster than ever before. We needed to transform our own organization and how we did things.”
To accelerate that process, Lockheed last year sent a small contingent of engineers through a residency program at the Red Hat Open Innovation Labs to fast-track the process of implementing an open source architecture onboard the F-22 while adopting agile development methodologies and DevSecOps practices. Since bringing back their learning to the organization, these engineers helped to catalyze a faster development process that has helped Lockheed introduce software features for the F-22 years ahead of schedule.
How Open Innovation Labs Works
Now in their third year of operations, the Open Innovation Labs were developed by Red Hat as immersive training grounds to help its enterprise customers figure out how to deliver better software, faster. A standard engagement has companies such as Lockheed pay for residency for anywhere between three to six developers and operations staff to get paired one to one with Red Hat employees—engineers, consultants and others—with deep knowledge in DevOps and agile development. They work with them in a time-boxed four- to 12-week engagement to build out application prototypes using DevSecOps practices along the way. The residents are also teamed with a designer and an engagement lead who doubles as an agile coach, typically working with the customer’s product owner for the prototype.
Obviously, Red Hat has a vested interest in training these people in technology such as its OpenShift Container Platform, getting them up to speed on how to orchestrate and manage containers and microservices. But the labs approach is in a different league than the standard vendor training program. It more closely follows the DevOps dojo model that enterprises like Target and Capital One are running internally to scale up cultural and process transformations across their IT organizations. Like those dojos, the working model is to build real software through a guided learning process that helps participants get hands-on experience in how to change the way they deliver software.
Red Hat runs the labs either out of a handful of dedicated spaces it runs around the world or within pop-up labs of the customer’s choosing. Besides Lockheed, other notable alumni include the likes of Volkswagen, UNICEF and Heritage Bank. According to a recent analysis by Forrester Consulting, participants in the Open Innovation Labs program are accelerating application development by more than 60%.
Lockheed’s Accelerated DevSecOps Transformation
In Lockheed’s engagement with the Open Innovation Labs, the organization sent out a cross-functional team of five developers, two operators and a product owner. They were tasked with building out a new application for the F-22 on OpenShift, using that process as a model for future development workflows. As a part of the process, Lockheed also worked with the labs to help it build out an internal dojo that could facilitate the scale-out of the knowledge gained by its small team across the entire F-22 development team. Six months after the initial residency, Lockheed managed to scale its OpenShift deployment and DevSecOps transformation across its entire 100-person team.
“By working with the Red Hat Open Innovation Labs team, we changed everything—our toolchain, our process and, most importantly, our culture,” explained Cawood.
As a result, the F-22 development organization has been able improve its ability to forecast for future sprints by 40%. More importantly, it has cut what was once an onerous five- to seven-year process of rolling out new software capabilities for the aircraft. Lockheed is on track to deliver new communications capabilities for the F-22 this summer a full three years ahead of schedule.
The ability to fail and recover quickly and frequently roll out new features are DevOps benefits any development team can appreciate. But when the team is building a security application that must protect users in real time, the ability to update and upgrade the product quickly isn’t just a nice-to-have—it’s a requirement. Security applications require rapid development to respond to security issues and must be tested continuously to ensure quality.
By design, Cyxtera’s AppGate SDP is a highly technical product. A comprehensive software-defined perimeter solution, AppGate SDP is designed to secure any application, on any platform, in any location. The product dynamically creates a one-to-one network connection between the user and the resources they need. These sophisticated capabilities make development and testing a challenge.
Testing AppGate requires a complex infrastructure that includes the network, user desktops, the application itself and a variety of scenarios. To ensure product quality, everything must be tested, including all upgrade processes on all versions of clients.
Previously, the AppGate team used an iterative approach to development, but the cycles were long. In some cases, developers had to wait up to two weeks for feedback on their build, making it difficult to maintain quality.
In an effort to reduce the time to feedback, the AppGate team adopted a DevOps approach. By automating testing, we sought to eliminate the barrier between developers and test results. Developers are most productive when you give them instant feedback. They are more eager to change their code when they’re excited about a feature they’ve just developed and want to see it succeed.
In addition to automating tests, we removed the QA team and created a single team of 20 developers who are responsible for coding, testing and implementing the feedback from tests and from customers. This organizational change created some cultural challenges.
Our developers needed a different attitude, and QA needed a different skill set to go from manual testing to development. That’s not a change you can do overnight, and sometimes it’s not even possible if a QA engineer has no ambitions to become a developer.
DevOps offers many advantages but can be challenging for organizations to embrace. For us, it took about a year of coding outside the product before developers began coding in the product itself. You need to invest time at the beginning to automate procedures, and that’s not always feasible in a normal project because development is all about quick gains and getting the product to market rapidly.
After about a year, our AppGate SDP team started to see speed and quality improvements in an order of magnitudes. The team of 20 has performed last year more than 2.5 million automated end-to-end product tests and created 560,000 virtual machines for testing alone. Those numbers are only possible with automation. If a security issue or a bug is identified in the field, the DevOps team can address it immediately. The team’s agility empowers them to respond to inbound customer requests as well.
An unforeseen benefit of moving to a DevOps model is the additional creativity the team enjoys. Test automation requires strict rules and processes, but instead of being perceived as a restriction, developers believe the structure gives them more freedom. Developers can write anything they want as long as the tests, code reviews, security checks, etc., are passed. If the tests weren’t automated, we’d have procedures in place for sign-offs, etc., to make sure everything is done properly. Now developers feel like they have more freedom, and that drives creativity and productivity.
The new model also provides a safety net, allowing the team to be creative without fear of failure because they know they can recover quickly. They get instant feedback on product quality and feedback for rapid failure. It’s better to fail fast instead of over several weeks, when it’s much harder to fix.
The AppGate team has the luxury of using the product they build on a daily basis. When developers request access to an application or system, AppGate looks at the user and device profile to enable secure, context-based access. This serves as another layer of testing, and basically makes every developer and employee a test user. It brings a lot of knowledge to the team on how the overall product works (so it goes way beyond the code they have developed), providing a better knowledge base for future improvements.
Automating tests enables you to scale at an unseen level, but you’re always testing the same use case repeatedly, and that’s not realistic. Using our own product all the time provides a lot of exploratory testing feedback. We’re testing a variety of traffic patterns and different ways of using the product, and we have immediate feedback. This feedback, combined with rapid development, empowers us to deliver a high-quality product.
PipelineFX’s extensive experience with monitoring tools and software development made it an easy decision to use open source projects in its product. The company found early success using open source time series projects to collect and analyze the data needed for its real-time billing offering. Although it was easy to use, PipelineFX was spending valuable development cycles maintaining the solution and decided to review the cost of hosting the solution themselves versus purchasing a hosted version. In its review, PipelineFX found it made better financial sense to go with a hosted version and rely on vendor expertise to keep the software up to date, keep the clusters fully optimized and rely on a 24×7 uptime.
DevOps practices halved the time it took this SaaS company to migrate to AWS
Australia-based Whispir provides communications applications as a service. One of its goals is to get products into users’ hands as soon as possible, and that requires development, operations and product staff working together, said Jonathan Swift, head of product and operations.
Whispir formerly operated from a co-location data center, a model that continued as it expanded internationally. But the time and effort needed to run the systems was not cost-effective for an organization of its size, so the company switched largely to AWS. Governance issues faced by some clients force the company to still run its own systems in certain geographical locations.
In the process, “[We] learned a lot about our app and how to make it cloud-ready,” said Swift. “Cloud isn’t free, cloud isn’t cheap” and is potentially more expensive than placing servers in co-lo data centers if the software isn’t built correctly.
For example, it makes sense to make the most use of a physical server as it is largely a fixed cost. But in the cloud, the fewer resources you use, the less it costs.
Crises Lead to Spikes
On the other hand, a lot of Whispir’s business is crisis-focused (eg, Caltex uses Whispir at its Kurnell oil refinery in Sydney to send emergency messages), and it takes a certain amount of time to spin up additional instances to deal with spikes in message volumes. “That was a real challenge,” said Swift.
Those crisis-communications clients expect Whispir to have sufficient resources to meet sudden demand. That’s an expensive proposition with co-located hardware, whereas Ccloud resources can be scaled up quickly, though not instantaneously.
Seasonality has to be taken into account. One relatively predictable driver of crisis messaging is Australia’s bushfire season. Unfortunately, this overlaps Christmas, which is a peak time for marketing messages. So Whispir plans to run at around 200 percent of its normal baseline capacity during the fire season. This is easily done with cloud infrastructure, which Swift describes as “a beautiful thing” in this context.
Some organizations are scared by multi-tenant environments. The ability to stand up dedicated instances on AWS is a great feature that Whispir can offer, especially to its clients in the financial sector.
The company’s DevOps practices had been focused on the co-location environment, so even though kanban still “works very well for us” after moving to AWS, some previous choices had to be revisited. In particular, new monitoring tools were needed to cope with the elasticity inherent in the cloud and because the focus expanded from the hardware to the whole stack.
Selected tools included the Zabbix open-source monitoring platform and Sumo Logic for trend analysis.
Earlier this year, Whispir moved all of its Australian customers into a “pure AWS” environment. There are some great tools for migration, Swift said, “but it’s not as straightforward or seamless as you might think.” He recommends doubling any initial estimate of the time required for such projects.
There were some nasty surprises: The first month’s bill from AWS was “huge” and it took a couple of months to determine the cause, even with the aid of AWS’s “really beneficial” premium support service.
Security requirements in various jurisdictions had to be taken into consideration, with updates to various procedures to ensure the new cloud environment was compliant. For instance, the procedures required when a physical system was decommissioned were well-understood, but how could they be translated into a cloud environment? One specific example is that an in-house storage device can be destroyed when it reaches the end of its life, but in the cloud it’s largely a matter of relying on the provider’s controls.
Avoid Lock-In
But Swift warned that “the challenge is to not lock yourself in” to a particular cloud provider. For Whispir, which operates a mixed cloud/on-premises environment (no cloud provider offers the right onshore facilities in New Zealand and the hardware that Whispir has installed in Singapore is too new to be replaced by IaaS), that is a requirement rather than a strategic choice.
Whispir would have avoided AWS-specific features that would make the platform easier to use and more difficult to get out of, despite the fact that using provider-specific toolsets can yield significant cost savings.
Whispir is keeping an eye on Azure—”great tools, great partnerships, great ecosystems,” observed Swift—and may migrate to Microsoft’s cloud in around 18 months.
A particular advantage is that Azure Stack can be run on private hardware, which could be useful if Whispir decided to enter a market where Microsoft Azure wasn’t present.
Either way, the intention is to go 100 percent cloud to the extent that is possible.
‘Infrastructure as Code’ Means More Power for Ops
The move to the cloud has made Whispir’s operations people more powerful, he observed. The infrastructure-as-code concept allows for rapid deployment, enables operations to contribute more to product development, reduces risk and enables the company to be more responsive to the market.
Furthermore, dealing with on-premises hardware still very much a waterfall situation, thanks to the delays and dependencies involved. But moving to IaaS means infrastructure issues sit comfortably within the kanban model.
IaaS also means that various network-related tasks simply disappear, but other issues arise in their place. For example, some external services used by Whispir (eg, SMS gateways) require the use of VPN connections from a known IP address, but with cloud infrastructure the best you may be able to do is specify a range of addresses. Whispir’s short-term fix was to route such connections through a specific server in the co-lo center, and in the longer term it found providers with less-restrictive arrangements.
Moving from co-lo to cloud would have been “incredibly hard” without DevOps, Swift said. It would have taken at least twice as long, he noted, and the company wouldn’t be able to run the mixed environment as well as it does.
“There’s no way we would have been so successful” without DevOps, he said.
Working closely with Automic, an international wholesaler and retailer of jewelery transformed a department of project managers, developers and operations responsible for all of the customer-facing websites into a DevOps organization. As a result, project delivery was completed with 90 percent fewer delays, and first customer-facing releases of projects could be delivered in less than half the time. The usability of its websites increased significantly, resulting in more customer traffic, longer average time spent on the sites and increased revenue.
Haphazard Development
Prior to the DevOps implementation, new projects were delivered by “waterfall” project management means. The cyclical resource planning process was based on the project portfolio and business priorities. Project managers then planned project milestones working closely with business stakeholders, business analysts and application developers. Analysts created specifications and developers were assigned to work on packages and tasks to implement them.
Different web technologies were used with varying levels of dev and ops expertise in each technology. The Operations team members usually fulfilled requests made during the course of a project as part of their overall daily tasks—for example, to provision a new environment, deploy a package or change the environment configuration.
This approach had a major disadvantage. Delays in one project impacted the overall resource planning and could have a cascading effect on other projects. Delays in projects could be for multiple reasons, such as waiting for business stakeholder impact, frequently changing requirements, unexpected sick leaves of developers or poor estimates. Other frequent causes included delays in operations tasks such as a deployment or provisioning of a new environment. These delays were caused by unaligned planning as well as a mismatch in priorities between projects and operations. Besides delays, some developers were underutilized, which also was exacerbated because they were specialized in a technology or component.
DevOps Transformation Solution
Working closely with the customer, Automic restructured dev and ops by:
Switching the development from a project to a product mode (cross-project development teams based on capabilities rather than assignment of individual developers to projects).
Moving project managers from development micromanagement to focus on major milestones and deliverables to the business.
Enabling some project managers as product owners (project management remained necessary).
Providing developers with agile methodologies through initial training plus ongoing coaching (six to 12 months).
Providing ops with an agile methodology.
Organizing both dev and ops into multiskilled teams focused on individual products rather than technologies.
Aligning ops into delivery teams, initially part-time and later full-time.
Giving delivery teams the end-to-end responsibility for their products, including their operations.
Standardizing the technology stacks within teams (but not across them) over time.
Delivering projects into production (or alpha, beta) in slices (releases) instead of just once to get early feedback and improve.
Results: Fewer Delays, Better Usability
By standardizing, this customer has transformed its dev and ops teams, creating an agile, scalable environment that can drive the business forward. The company achieved the following specific results:
Project delivery are now completed with 90 percent fewer delays. First customer-facing releases of projects now are usually delivered in less than half time.
The usability of websites has increased significantly, resulting in more customer traffic, customers remaining longer on the sites and increased revenue opportunities.
About the Author/Michael Schmidt
Michael Schmidt heads DevOps Practice at Automic, a management and technology advisory service established to help Automic customers to prepare for and transform their organizations toward DevOps. Michael spent his carrier as consultant, entrepreneur and in several product-related leadership positions. He has a passion for building lean IT organizations. Michael holds a joint MBA from New York University, London School of Economics and HEC Paris and a Master of Computing Science.
Cloud analytics provider Stytch leverages its cloud-based analytics for customers who want to centralize, fuse and model their data. “Our mission is to make it easier and faster for business users to get insights and make decisions,” said Taylor Frost, cloud operations engineer at Stytch.
Before the company implemented a DevOps approach, its primary software platform and some services were large monoliths maintained by disconnected teams. Stytch tested new features in isolated Jenkins jobs and performed quality testing and product releases manually in siloed realms that were out of sight and out of mind, Frost said.
Stytch’s Dev, Ops and QA were walled from each other, isolating the knowledge base of activities in any one group from members of the other two groups. Stytch teams did not share this information, and sister teams could not benefit from the insights this knowledge held.
What’s more, developers did not have transparency into the products and tools that manipulated the cloud-based infrastructure or the build pipelines. “This fostered an attitude of ‘it’s an (Ops/Dev/QA) problem’ and discouraged a sense of ownership of or responsibility for success, which led to an increasingly lengthy feedback cycle and slower, less frequent builds,” Frost noted.
Stytch lacked the orchestration and the down-in-the-weeds level of control it needed to enable real-time changes to labyrinthine back-end technologies without repercussions that could cause the customer base to suffer, and to speed and simplify deployment, she said. Standards such as Terraform or CloudFormation did not provide the fine-grained control of deployment that Stytch needed.
The company’s Ops was in charge of Python software libraries, but other groups including Dev and QA needed access. Stytch also has a performance team that the company was eager to include in Python library development.
Stytch After DevOps
Stytch is using DevOps to unite teams and divide the various software monoliths into microservices for continuous integration (CI) and continuous delivery. The company has already fed its core software platform through the new build pipeline a number of times, and continues to create even more automated and efficient deployment processes.
As it works to create homegrown Python orchestration libraries, Stytch is establishing a stronger grip on deployment. All teams connected to the pipeline including Dev, QA and Performance are actively expanding these libraries.
Stytch increasingly intermarries its Dev, QA, Ops and Performance teams and enables and rewards collaboration across the stretch of the DevOps pipeline. “Our goal is transparent, scripted change integration, from check-in to testing and deployment. We empower our developers to take responsibility for their work, from check-in to production deployment,” Frost said.
Stytch uses frequent meetings of a continuous delivery committee with members from all four groups to update the status of the pipeline. The company is swapping out Jenkins for Travis CI for builds and tests, making Dev more hands-on and able to gauge its work from start to finish.
“Developers are iterating on their pipelines in the same way that they iterate on their projects,” Frost said. Stytch is able to find and fix problematic code earlier in the pipeline while accelerating development cycles. Customers are pleased with the faster rate of innovation on the software platform they use.
New Infrastructure, Training = More Results
Stytch has made cross-pollination of expertise common for pipeline teams. “We have an annual training allowance and our engineer-led ‘Ministry of Propaganda” holds regular afternoon sessions to introduce new technology and practices,” Frost said.
As CI and continuous delivery processes grow, absorb and automate manual steps, related activities across the pipeline become more translucent for everyone. Both the Travis CI platform and the use only of scripted product releases and scripted tests for performance are increasing that transparency.
The metamorphosis that has spread throughout the teams with direct access to the DevOps pipeline now extends to the rest of the company, as needed, such as with marketing. Frost provided an example:
“Our marketing team was struggling to make good progress with regular releases of our WordPress-based website. Our engineers were fielding regular requests for basic tasks—starting and stopping servers, updating configuration files and retrieving logs,” she said. “We brought our engineers and marketing together on this. The result was a simple command-line tool that enabled our nontechnical marketing staff to perform complex actions on their own, including promoting their changes to the production environment.”







 It’s important to emphasize that in non-peak hours, these microservices take 10 milliseconds at most: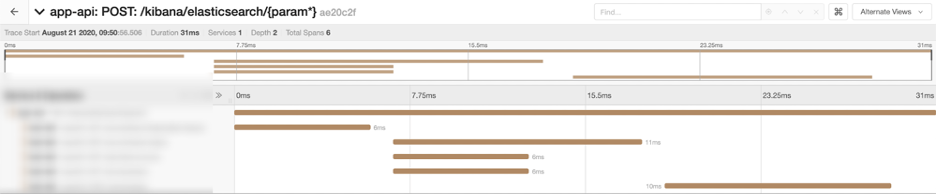






 Michael Schmidt heads DevOps Practice at Automic, a management and technology advisory service established to help Automic customers to prepare for and transform their organizations toward DevOps. Michael spent his carrier as consultant, entrepreneur and in several product-related leadership positions. He has a passion for building lean IT organizations. Michael holds a joint MBA from New York University, London School of Economics and HEC Paris and a Master of Computing Science.