Tag: business intelligence

  • Natural Language Query (NLQ) is Key for Self-Service BI

    Natural Language Query (NLQ) is Key for Self-Service BI

    Modern business intelligence (BI) and analytics software solutions offer more ways to explore data and find insights than ever before. However, ensuring everyone in the enterprise can use analytics independently, when they need it, remains a challenge.

    For analytics to be adopted across the full enterprise, your tools need to be tailored for all users.

    While many BI solutions today provide streamlined experiences, some data literacy and knowledge is required to fully understand them. Dashboards, for instance, are considered self-service BI tools, but they are often still too technical for the average person to use effectively.

    Today, only two out of five (40%) organizations report their people can analyze data without getting help from IT, according to Ventana Research. To better enable business users to interrogate their data independently, certain BI vendors now provide a natural language query (NLQ) capability that sits alongside their dashboards and reporting. Rather than having to search for answers in a traditional dashboard or chart, NLQ allows analytics users to ask questions of their data directly.

    An Overview of NLQ

    Natural language query is a self-service BI tool that provides the ability for an analytics user to ask a question using non-technical language and get an automatically generated answer instantly. Using data modeling and machine learning technologies to parse questions for key terms, NLQ scans related databases and generates a tailored report or chart that provides relevant insight.

    The integration and implementation of natural language query capability, as well as the complexity of the questions and the types of data supported, varies between vendors. The most common and traditional approach is search-based NLQ, which places a free text search bar somewhere within the user interface (typically on a dashboard) that allows BI users to begin typing a question and get a list of reports and charts generated quickly as potential answers.

    A smaller number of vendors also include support for voice commands in their NLQ solution.

    As NLQ increasingly becomes a part of BI ecosystems, however, some vendors have evolved their natural language offering to account for additional barriers: A user still has to know what question to ask, and how they can use it to avoid inaccurate or irrelevant results to their question.

    The new approach is called guided natural language query, or guided NLQ, which takes the concept of NLQ further by programming the solution itself to guide the user as they type a question, helping them structure it using pre-defined sequences and suggested prompts.

    This eliminates the burden of knowledge or any potential problems in accurately interpreting the semantics (language) of a user’s question, as the system itself assists them in building it, from start to finish. They don’t need prior technical knowledge or need to go to IT to get started finding answers from data.

    When employed correctly, guided NLQ can help make the use of analytics more pervasive and open up analytics for every type of business person in the enterprise—not just experts.

    Self-Service That Suits Every Enterprise User

    The aim of NLQ is to help workers not accustomed to traditional, structured BI tools find insights and information they need to inform and make business decisions, while also being a helpful tool for advanced users throughout the enterprise.

    For non-technical analytics users, NLQ is an easy way to get detailed answers from their data faster than exploring a dashboard or chart and use it as a springboard for their ad-hoc reporting.

    Similarly, advanced users can leverage NLQ, whether guided or traditional, to quickly generate a report or chart and further build upon it.

    Generated insights using NLQ can be added into existing analytic content, such as dashboards, reports and data stories, to enhance them with additional detail, relatively quickly and easily.

    Finally, NLQ can be embedded into the interfaces of your users’ workplace applications, to make analytics far more ubiquitous in their day-to-day workflows. They can ask a question, get an answer, and start exploring data much faster and more easily than via dashboards alone.

    Ultimately, having an awareness of your users’ varying self-service BI needs, and how the new wave of tools such as Guided NLQ can help to further open up analytics to more people, will help you ensure your analytics tools are adopted and usable by everyone throughout the enterprise.

  • Turbocharge Enterprise Apps With Contextual Analytics

    Turbocharge Enterprise Apps With Contextual Analytics

    Software product managers and developers typically treat analytics as a standalone capability—something to be integrated into their application’s dashboard or reporting module. As a product feature, analytics is undoubtedly a valuable tool. But offering it merely as a tacked-on function is an approach that lags behind where your users are today.

    When data analytics is limited to dashboards, users must switch away from their transactional environment whenever they need to interrogate data or derive insight. This disrupts workflows and interrupts trains of thought, creating friction for the user. Moreover, a standalone analytics capability doesn’t provide context or guided analysis. Users must look for anomalies or trends manually. As a result they’re less likely to dive into analytics to support good business decision making.

    Contextual analytics, on the other hand, gives users a powerful tool right at the point of their daily work. Contextual analytics is defined as any analytics solution that is integrated directly into an application’s core workflows. This approach delivers the benefits of analytics in the situational framework where decisions must be made.

    Embedding analytics in this fashion creates significant value for the user. Charts, tables and metrics sit side-by-side on the screen, alongside the application’s central functions. With one click, the user gains instant, guided and dynamic insight.

    Such an improvement is helpful for all kinds of business activity. Retail store managers can instantly access demand forecasts while creating weekly work schedules. Inventory managers can view trends and analyze stock without leaving their ordering screen. Supply chain, finance, logistics, sales and marketing, manufacturing—any process involving routine data processing can profit from contextual analytics.

    A Rich Workflow Asset

    When embedded into transactional workflows, contextual analytics can deliver two forms of understanding. The first comes from predefined visualizations, ranging from simple KPI numbers to line and bar charts and even contextual dashboards. These visualizations are presented based on user action; a customer’s purchase history, for example, can pop up in chart format while viewing the account record, enabling the user to make decisions about sales incentives or priorities for service.

    Second are dynamic analyses and alerts. These indicate that either thresholds have been crossed or anomalies in a record have been discovered, prompting the user to explore and take further action. Pop-up alerts can be invaluable in sales, production, finance or many other disciplines.

    For both predefined and dynamic contextual analytics, outcomes can be based on simple aggregations of transactional data or as the result of sophisticated data science modeling (e.g., propensity to purchase). Specific outcomes can be set by either the product manager or the user to maximize utility.

    Contextual analysis is ideal for supporting or triggering actions according to any business need. The capability enhances transactional workflows by providing metrics pertaining to a particular transaction; it will also trigger a new workflow via an alert or suggestion for action, based on the output of a data science model.

    contextual analytics

    Of course, none of this means that dashboard-based analytics aren’t still important. Users will always need to conduct broad data analysis. Dashboards and/or report analytics allow users to monitor overall business performance, drilling down when necessary into the details behind the numbers.

    With the secondary addition of contextual analytics, however, users can be continually guided in their decision making as they work. They receive a constant flow of deeper insight, supporting management tasks intuitively at a granular level.

    Deployment Framework for Developers

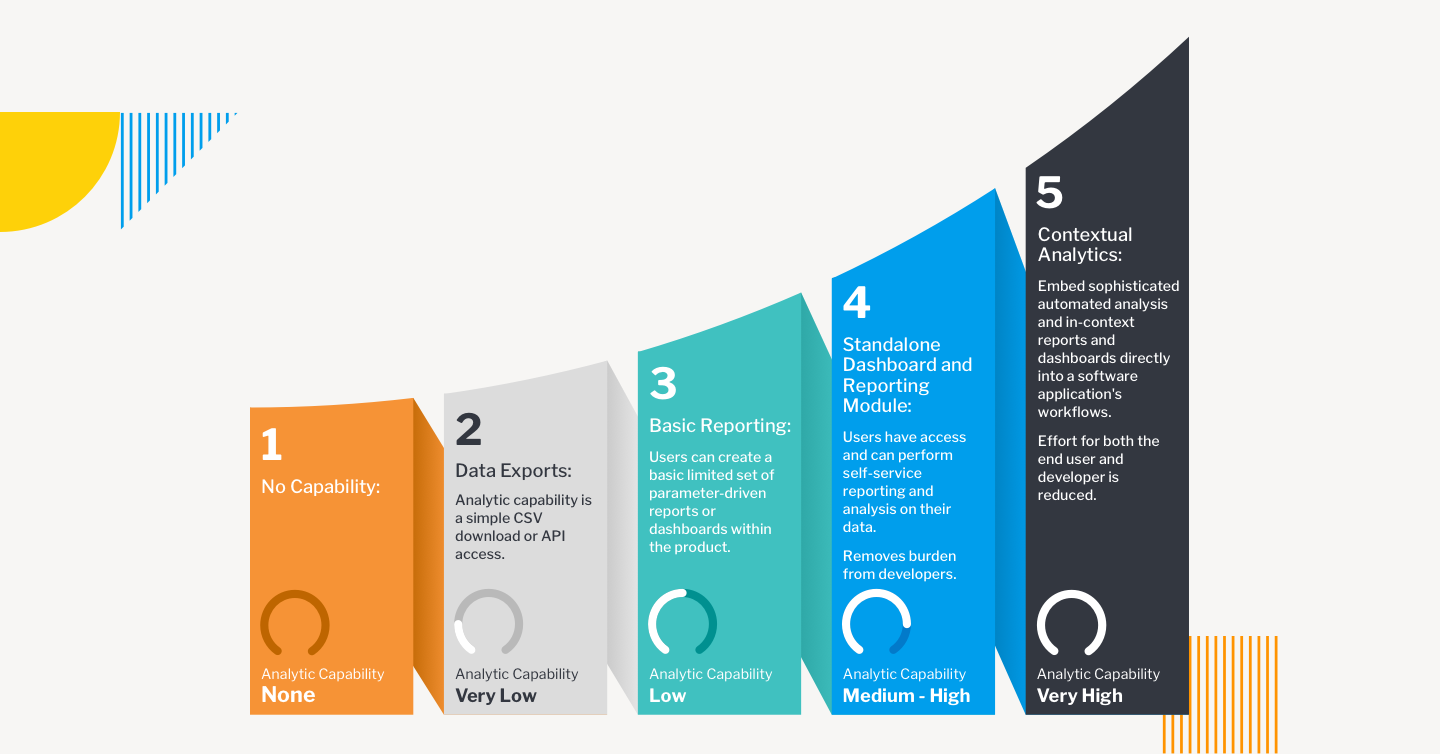
    Embedding transactional analytics into enterprise applications can be directed according to a maturity model. There are five possible stages of product development:

    • Stage One: No Capability. The main engineering focus is on bringing a new application to market. Minimal Viable Product (MVP) attributes lead development, and reporting capabilities are rarely included.
    • Stage Two: Data Exports. Analytics are provided based on customer feedback, but only through a CSV download or API access that allows the end user to analyze data in their preferred tool. The burden of building analyses rests with the customer.
    • Stage Three: Basic Reporting. A limited set of reports are supported by analytics, and in-house developers are tasked with creating the capability, often to the detriment of new features for the core product.
    • Stage Four: Standalone Dashboard and Reporting Module. This is often the end journey for most enterprise applications. Self-service reporting and analysis are available via out-of-the-box dashboards and reports.
    • Stage Five: Contextual Analytics. Sophisticated, automated analysis is available as part of the application’s core workflows, as well as at the dashboard. Users are guided to optimal decision-making at both the transactional and reporting level.

    These stages are not mutually exclusive. Especially for stages four and five they can be additive, so that end users will have a variety of mechanisms to access the data they need, at the time they need it.

    contextual analytics

    Accelerating Implementation

    Elevating the end user analytics experience is easier to achieve than it once was, thanks to BI vendors that specialize in embedded and contextual analytics built on an open platform. The best vendors are able to adapt quickly and easily to product development roadmaps, aligning features to meet specific needs and following up with administrative tools and automation processed to support the lowest possible cost of ownership.

    Working with an analytics vendor means development teams will have maximum support from prototype and design to integration, deployment and subsequent iteration. Options for Windows and Linux, on-premises or cloud will ensure the versatility, security and scalability required for highly marketable offerings.

    How Customers View Analytics

    As a product feature, analytics can often be dismissed as an afterthought—but your users don’t see it that way. BI analytics is increasingly seen as critical to business governance. Users want to glean as much insight as possible from the data they’re collecting—and on multiple levels. This means your users want to get more from your product, even in ways they haven’t yet imagined. Contextual analytics can provide that enhanced appeal for your application, putting your product out in front at a time when enterprise applications are more essential—and more competitive—than ever before.

  • Embedded Analytics Essentials: A Checklist for Success

    Embedded Analytics Essentials: A Checklist for Success

    Integrating the analytics capabilities into your application can be easier than you think

    Today, the ability to create and explore dashboards and reports, embedded directly into the apps your customers use every day, is no longer a luxury but a necessity to keep your product competitive and deliver value to users.

    Embedded analytics brings many benefits for different groups. For end users, it’s a valuable tool to explore their data and discover new insights. For analysts, it’s an integral capability for advanced performance analysis. For product managers, it’s the best way to enrich and cultivate a data-driven experience for your customers with the latest analytical capabilities, built-in.

    Moving away from decisions based on instinct toward decisions based on analytics and metrics delivered by centralized systems is one of the most impactful changes you can drive today. But for product managers in the business of delivering software or utilizing an application to drive customer interaction, the choices available for embedding analytics is a looming challenge.

    This article covers the key challenges, scenarios and checklist considerations product managers need to tick off before implementing any type of embedded analytics solution.

    Embedded Analytics: A Business Case for Buy vs. Build

    Typically, the decision around embedded analytics boils down to build or buy.

    Even with a need for fast technical integration and time-to-market pressures, many product teams first lean toward getting in-house developers to build embedded analytics into their app.

    It’s an understandable first thought, given many have a specific vision for their app that a third-party might not ‘get’ immediately. But opting to build-in analytics more often than not leads to long-term challenges that aren’t always initially obvious.

    The fact is creating an analytics platform from scratch is a complex task that takes years of work to create and refine. Aside from the advanced data expertise and technical integration required, having your developers focus on embedding analytics means they now have to:

    • Face a very high investment cost to recruit the necessary skills for implementation.
    • Provide all support, maintenance and upgrades for your homegrown BI functionality.
    • Replicate the look and feel of your core application to ensure UX consistency.
    • Match the analytical features of specialist BI solutions—a near impossible task.

    With the time and skills needed to build your own analytics into your app from the ground up, you could face higher costs, increased risk and delayed time-to-market for your product—not to mention less time innovating and improving the core product experience for your users.

    Your users ultimately expect to have data accessible to them for their day-to-day work. When they use your product, they will demand a certain level of reporting and analysis comparable to the BI tools they may already use in their own businesses at the moment—and yes, it will go beyond just having basic dashboards. If you don’t have confident answers for the most common questions required before building an embedded solution in-house—do you have the expertise, the manpower, time and knowledge—it’s not advised to pursue the build path.

    So, what about buying an embedded analytics solution for your application?

    What to Look for in an Embedded Analytics BI Solution

    Buying an established embedded analytics solution often does away with many of the problems of building it.

    You can shift away from home-grown reporting to a proven platform that can seamlessly integrate custom analytics into your app, amplify the reach of your product by engaging new and existing users with the latest analytical features, and even automate data discovery and analysis so you gain competitive advantage—though the last capability depends on the particular vendor.

    However, buying comes with its own very important considerations that your product team and business as a whole need to evaluate and answer before making a decision. Below, we list the most important things to look for in both the embedded solution and the partner behind it.

    Does it include everything I need to meet end-to-end operational reporting needs?

    Your users will have a range of functional needs from the embedded analytics solution you buy, so the first thing you must answer is whether it can cater to their day-to-day work and provide access to advanced analytics. For instance, your customers want to know what to do next: Some might only need tabular reports (traditional), while others will demand richly visualized and interactive dashboards that drive action (modern). Eventually, some may look to use automation and AI in their analysis (augmented). The best options are those vendors that let you embed it all—dashboards, authoring, charts, collaboration, data preparation and modelling, admin and security. How each element is embedded (iFrames, JavaScript libraries with REST API calls) and where embedded code can run (cloud, desktop, mobile, web) is just as important to factor in, too. It’s not just about having dashboards in your app, but ensuring you have future-proof capability that continuously scales with your users as their data needs grow.

    Can the solution be embedded seamlessly?

    It’s not just all about having the best and latest features. A cohesive, seamless user experience between the analytics portion of your product and the core software itself is a big part of delivering an exceptional product, so when choosing to embed analytics, ensure the solution allows your team to have exceptional control to make it look like a part of your app rather than like one different app hosting another. Many modern embedded solutions allow you to white-label; this is recommended to allow for consistent design across your platform, as you will eliminate your users’ potential concerns around security, performance or support with using another product.

    Can it help me ensure faster time to market?

    A common problem with creating an embedded analytics solution in-house is the investment in time and money it takes to get your product to market with the new capabilities. It’s also difficult to ensure the integration process can be done as quickly and efficiently as desired. The embedded tool you buy should accelerate that process and significantly reduce the development cycle, so your team is able to begin using your new analytics within days instead of weeks and your devs stay focused on improving your product’s core value instead of configuring reports.

    Next Steps

    Selecting an embedded analytics product can be a difficult task, but so long as you keep your product and analytics objectives aligned and follow best practices checklists, integrating the latest analysis capabilities into your application is not as far-off a future as you may think.

  • Logi Analytics Simplifies Dashboard Development

    Logi Analytics Simplifies Dashboard Development

    Logi Analytics launched a tool that promises to make it easier to design, build and embed interactive dashboards and data visualization within applications.

    Company CEO Steven Schneider said Logi Composer helps ease the task of creating data visualizations within the context of a DevOps workflow.

    Based on technology Logi Analytics gained via its acquisition of Zoomdata last year, Logi Composer enables DevOps teams to create interactive self-service dashboards for end users as part of a microservices architecture based on Docker containers, he said.

    To help achieve that goal, Logi Composer includes support for a range of Smart Data Connectors constructed as a set of microservices to access databases and other things.

    Schneider said as applications evolve developers increasingly are being required to embed business intelligence (BI) functionality within their application. However, he noted, most end users don’t want to move data into a separate BI application to analyze trends when they could be surfaced more easily within an application they are already using.

    The challenge has been finding a way to provide developers with a set of tools for building self-service visualizations in a modular fashion that makes them easier to build, maintain and update, he said.

    Of course, developers have been adding visualizations to applications for years. But most of those visualizations don’t let end users interrogate data—users now expect to be able to manipulate visualizations with a modern application at a much deeper level, said Schneider.

    A recent market study published by Dresner Advisory Services finds 62% of respondents consider self-service BI to be either “critical” or “very important.” A separate report published by Allied Market Research estimates the market for embedded analytics will generate revenues in excess of $60 billion by 2023.

    Data visualization is a critical aspect of every digital business transformation initiative. As organizations look to digitize more processes in the wake of the COVID-19 pandemic, the need for more robust data visualization capabilities within applications has become more acute. Most end users are unable to make sense of massive amounts of data without the aid of visualization tools.

    It’s unclear to what impact embedding BI capabilities within applications will have on standalone BI applications. There may always be analysts who want to pull data from multiple application sources to analyze trends. However, the bulk of users are likely to have their BI requirements met within an application that includes connectors to pull in external data when required. Applications that don’t include data visualization capabilities are not likely to be widely employed by users.

    Ultimately, embedded data visualization will reduce reliance on both spreadsheets and standalone BI applications. However, like most substantial changes to end user behavior, it may be a while before that cultural shift takes hold.

    In the meantime, DevOps teams should expect to see a lot more analytics functionality being embedded within applications. The challenge now is finding a way to streamline the development and deployment of those modules within the context of a larger application development project.

  • 3 Ways DevOps Can Increase the Value of Organizational Data

    3 Ways DevOps Can Increase the Value of Organizational Data

    There’s a reason the term “data mining” came into existence. Enterprises sit on a vast resource of information—millions of digital gems that, if fully extracted, can not only answer many of their toughest questions, but also help them meet their most ambitious organizational goals.

    DevOps professionals have a unique opportunity to impact this mining process. Their vision can transform the way their organizations utilize data by building fresh capabilities and strategies into the applications and platforms they create. Yet, recent advancements in data science, particularly the use of parallel processing platforms that interrogate massive datasets in near-real time, are changing the game as well. 

    Time-to-Insight Is Shrinking

    Parallel processing improves analytics along two important paths.

    First is the time requirement. When organizations are able to process billions of rows of data in milliseconds, it changes the value of that data. In many industries—financial services, for example—there is a big difference between a query that is answered in seconds or minutes, versus one that is answered in a fraction of a second. Those small deltas in time can make a big difference in the bottom line. As they say, time is money.

    The other path is the curiosity factor. In conventional analytics, the paradigm is to ask a question and get an answer. But if the user can ask one question, get the answer and then ask three more questions based on that result, without concern for a time penalty, it creates an opportunity to be more curious. This is a pain point that is underappreciated and largely overlooked in most organizations. Without speed and agility, decisionmakers can end up in a rut, asking the same questions over and over again because the time/value equation never improves.

    When queries only take milliseconds to answer, it’s easy to ask new questions, dig deeper into data and look at problems in entirely new ways. DevOps has the ability to leverage the potential of parallel processing to empower their organizations and significantly raise the value of data.

    Here are three of the more prominent ways.

    Use Multiple Processors to Scale Processes

    A central data repository facilitates analytics throughout the organization, especially for enterprises that make heavy use of business intelligence (BI). While a centralized location is advantageous, it also places huge demands on DevOps to deliver adequate performance.

    Parallel processing can support this approach, even in mixed GPU/CPU environments. Parallelized code allows a processor to compute multiple data items simultaneously. This is necessary to achieve optimal performance on GPUs, which contain thousands of execution units. However, optimizing hybrid execution also translates well to CPUs, which increasingly have wide execution units capable of processing multiple data items at once. Parallelized computation can improve query performance in CPU-only systems as well.

    Accelerated analytics platforms allow single queries to span more than one physical host when data is too large to fit on a single machine. Such platforms can scale up to tens, even hundreds of billions of rows on a single node and can also run across multiple nodes. Load times improve linearly with the number of nodes because loading can be done concurrently.

    Connect Data Silos for Deeper Understanding

    New insights arise when questions are asked not simply within one silo or another, but at the place where those silos intersect and relate to each other. No longer do decision makers have to look under one rock and then move on to five other rocks; instead they can treat their organization’s data stores as one complete, interconnected resource.

    The advantages of connected silos don’t stop there. Using accelerated analytics, it’s possible to combine internal datasets with external sources. Analysts may want to review the impact of demographic shifts on retail performance, for instance, or of weather on public safety.

    Use Advanced Analytics to Tighten Datacenter Security

    No one has to tell developers that cybersecurity is essential. Yet, the difficulty often lies in staying on top of the challenge—log files, for instance, can grow to billions of rows of data every day.

    The ability to pull security data into an accelerated analytics environment provides instant insight into data center security. Dashboards that incorporate such capabilities allow staff to interrogate log files and other security datasets in near-real time. Furthermore, spatiotemporal analysis—the ability to combine and analyze time and location data—is becoming increasingly valuable for intrusion forensics. When professionals understand what region of the world an attack is coming from, it becomes that much easier to minimize or stop altogether.

    Giving Data a Second Look

    Despite the incredible rise in big data, organizations don’t always turn to their repositories to answer their hardest questions. They assume the platforms they have, or the data they possess, are too unwieldy, slow or difficult to leverage.

    Organizations need to go back to the era in which there was confidence in the ability of data to answer those really hard questions. Too many teams have succumbed to asking only those questions they know data can answer, rather than asking harder questions that more advanced analytics solutions can uncover.

    With the right technologies and processes in place, the questions that seemed to be impossible are no longer insurmountable. The data that resides in the organization is more capable than anyone thinks. All one has to do is have the daring to ask.

  • How In-Memory Analytics is Solving Data Woes

    How In-Memory Analytics is Solving Data Woes

    The importance of data to business decisions and operations cannot be understated. On a daily basis, 2.5 quintillion bytes of data is generated. Managing that much data so the necessary intelligence is easily accessible or to make sure insights are not missed, can be incredibly challenging. Luckily, technology does exist that can help to significantly ease the strain of this deluge of data: in-memory analytics.

    Initially adopted by the finance industry—where complex, on-the-fly decision-making is required–in-memory analytics is incredibly adept at handling the analysis of substantial amounts of data very quickly. And as data more ubiquitous, and the development of public cloud services has made specialized hardware affordable to companies of all sizes, in-memory analytics technology is being applied in a variety of verticals from retail, to supply chain to healthcare. In addition, given in-memory computing enables a range of analytics features that are very useful to businesses of all kinds and extremely difficult to achieve with disk-based platforms, the technology is really poised to expand rapidly.

    Slice and Dice Any Which Way

    One of the hardest parts of being a data professional today is leveraging all the data at your disposal. Unfortunately, business intelligence (BI) pros are often constrained in terms of what portion of the company’s data they can and cannot analyze depending on pre-defined data queries and the limitations of their BI tools.

    In-memory analytics, however, enables analysts to explore data without any of those limitations. This creates an experience of train-of-thought analysis that helps businesses make deeper analyses and uncover valuable new insights into their market and their own performance. This means retailers for example, can have a global, precise view of the market and cross-reference data from sales numbers, client receipts and loyalty programs, to develop a better understanding of what customers expect from them.

    Figuring Out “What If?”

    Due to the vast amount of data involved, and the limitations of physical storage discs, the calculation of the impact of any business decision on complex KPIs can take a long time to resolve.

    By utilizing in-memory analytics BI pros can continuously compare and contrast “What If” scenarios—such as running stress tests for financial institutions or setting up disruption test cases for supply chain businesses—with a clear, immediate view of the potential outcomes, so they can be as prepared for the future as possible. This means businesses are able to limit the amount of times they are caught off guard or mitigate the impacts of any unexpected turns.

    Up-to-Date Data

    With how rapidly the world moves today, having data that is as current as possible is pivotal. Static datasets only updated once or twice a day can lead to significant, costly misjudgments in some cases. In-memory analytics on the other hand can support a continuous stream of data from multiple sources so analysts always work with the most relevant set of data. This means supply chain businesses, for example, can have real-time oversight over operations to better cope with any disruption that occurs and ultimately save millions of dollars in potential losses.

    The boom of data science has opened a new field of use cases for in-memory analytics, ranging from the validation of new algorithms derived from ML/AI to industrializing the building of new analytics views and dashboards. If you have invested heavily in data science, in-memory analytics could be the pivotal cog in generating the maximum output from each piece of your organization’s data infrastructure.

    — Antoine Chambille

  • Identifying and Abstracting Business Intelligence from Kubernetes Workloads

    Identifying and Abstracting Business Intelligence from Kubernetes Workloads

    In the age of big data, businesses are inundated with data points. While they know there’s an abundance of valuable resources available to them, making sense of this data to derive actionable insights is often still a challenge.

    CNCF industry survey data shows workload complexity and monitoring remain top challenges for enterprises in terms of using and deploying Kubernetes. Many understand there are valuable resources within these environments, but struggle to best identify and extract meaning from machine data. While most of this data is readily available, it just takes the right tools to gather and view intelligent insights.

    The Benefits of Open-Source Data Collection

    Perusing the CNCF website, there are a wealth of tools built around Kubernetes to enable not only monitoring but networking, storage and security. There is even a Kubernetes-specific package manager, Helm, to make the deployment and management of these resources easy and consistent.

    There are a couple of key benefits to taking advantage of these open-source collectors:

    1. They stay up to date. Each of these tools benefits from deep community support. As new versions of Kubernetes are released, the extensive use of each of these tools ensures they are quickly updated.
    2. They integrate with everything. Prometheus, for example, has an impressive list of integrations and exporters.  Regardless of your unique stack, it is likely that there is support for what you might want to export data from. The importance of these integrations cannot be overstated, as they enable the flexibility needed to grow and evolve a Kubernetes deployment over time.

    Ensuring Complete and Organized Metrics Collection

    Prometheus–endorsed by the CNCF–is the de facto tool of choice for metrics monitoring with extensive support for anything you might use to collect metrics data.

    Prometheus works by pulling data from all of the components and jobs running in Kubernetes since every component of Kubernetes exposes its metrics in a Prometheus format. The processes running behind those components then serve up the metrics on an HTTP URL. For example, the Kubernetes API Server serves its metrics on https://$API_HOST:443/metrics.

    Prometheus is particularly good at auto-discovering the jobs and services currently running in a Kubernetes cluster. As pods are added, removed or restarted, the Kubernetes Service construct keeps track of what pods exist for a given service. This auto-discovery capability is one of the primary reasons for Prometheus’ popularity, ensuring that all new and existing components are monitored.

    The Importance of Cluster Level Logging and Event Collection

    Kubernetes does not define a single standard approach to log collection, but the most common method is called cluster level logging. Cluster level logging deploys a node level logging agent to each node which then funnels data to a separate backend for storage and analysis of logs. The primary benefit of this solution is that if a pod dies, the logs detailing what happened are retained. Implementing node level logging, without funneling data to a logging backend, will not retain log data if pods die or are evicted, while cluster level logging ensures that data is captured and retailed. A common tool for implementing cluster level logging is Fluentd—or Fluentbit, a lightweight version of Fluentd—which acts as the node level logging agent funneling data to a logging backend.

    Events provide insight into decisions being made by the cluster and unexpected events that occur in Kubernetes. Events are stored by the API server on the master node and collected using the same method as log collection—via a node level logging agent like Fluentd.

    Establishing a Continuous Intelligence Dashboard

    Finally, collectors for logs, metrics, events and security can be easily deployed using Helm—an open source Kubernetes package manager. Helm can significantly simplify the setup process, reducing hundreds of lines of configuration to one. These collection plugins can be used on any Kubernetes cluster, whether one from a managed service such Amazon Elastic Kubernetes Service (EKS) or a cluster you are running entirely on your own.

    According to Sumo Logic’s recent Continuous Intelligence Report, enterprise adoption and deployments of multi-cloud grew 50% year-over-year, and 80% of users across multi-cloud environments are now utilizing Kubernetes architectures. As Kubernetes continues to become mainstream, it’s essential that businesses understand how these workloads operate and how to best extract valuable insights to inform business decisions.

    — Katie Lane

  • Anaxi Adds Reporting Capabilities to ALM Tool

    Anaxi Adds Reporting Capabilities to ALM Tool

    Anaxi today announced it has added reporting capabilities to its namesake application lifecycle management (ALM) tool that make it possible to update stakeholders about the status of software development projects residing in repositories such as GitHub and Bitbucket Cloud as well as project management applications such as Jira.

    Company CEO Marc Verstaen said reporting capabilities will make it easier to employ Anaxi to, for example, keep business leaders apprised of updates to software development initiatives by enabling IT leaders to generate a report similar to how business leaders today employ a business intelligence (BI) application to share sales forecasts.

    The Anaxi tool is designed to provide IT leaders with a single tool for tracking progress being made across multiple DevOps platforms. Verstaen said as more organizations begin to realize they are really software companies, interest in software delivery management tools is on the rise. The reporting challenge IT leaders face is the information they need to create a holistic report lies in multiple repositories because of the inherently fragmented nature of the DevOps tool chain, he said.

    To make it easier to adopt Anaxi, the ALM tool Data employs the same credentials organizations have created to access GitHub, Bitbucket and Jira. The Anaxi app connects directly to a user’s GitHub or Bitbucket repositories and Jira projects to ensure data privacy and security. Any action performed on the Anaxi applications is written back on GitHub, Bitbucket and Jira to maintain consistency across projects involving multiple team members.

    At its core, Anaxi is pulling metadata from DevOps tools to apply analytics to track individual developer productivity and team performance. IT leaders can, for example, analyze how much code has been added and removed, refactoring and code churn on a weekly basis. Anaxi can be used either in place of a project management application or as a complement to an existing project management tool to make analytics more accessible.

    The primary goal is to make it easier for IT leaders to identify DevOps bottlenecks and prioritize projects in a way that advances business goals. Too many organizations are writing more code than ever only to discover projects are being held up because a single component on which every other module depends is behind schedule. Many of the developers writing that code could have been working on other projects if IT leaders had been made aware of changes that needed to be made to the schedule based on the anticipated delay to another project. Anaxi essentially applies predictive analytics to software development projects to determine based on past histories the likelihood of a deadline being met, Verstaen said.

    Armed with that intelligence, IT leaders can either proactively reallocate how resources or allocated or inform business stakeholders to changes in delivery schedules. In either case, Versaten says the goal is to enable IT leaders to avert any software development crisis that might arise.

    The Anaxi app is free to use by teams of up to 10 members. Teams of more than 10 users will be required to adopt a premium plan priced at $19 per month per user.

    — Mike Vizard

  • Dynatrace Extends APM Reach Into Business Analytics

    Dynatrace Extends APM Reach Into Business Analytics

    A growing number of providers of tools widely employed by DevOps teams that are extending their reach into business analytics has been joined by Dynatrace. The provider of a namesake application performance management (APM) platform unveiled a set of business analytics applications aimed at application owners who need to understand how changes to the  application experience their organization is providing ultimately impacts the business.

    Ajay Gandhi, vice president of product marketing for Dynatrace, said Digital Business Analytics applications from Dynatrace extends the single-agent architecture Dynatrace created for its Software Intelligence Platform to make it easy to employ an APM service delivered via the cloud into the realm of business analytics.

    The difference between the applications being made available by Dynatrace and traditional business intelligence (BI) applications is the agent software Dynatrace developed enables application owners to track all events in real-time, said Gandhi.

    As organizations launch digital transformation initiatives, Gandhi said many discover they lack visibility into the actual end user experience. The suite of Digital Business Analytics applications provides access to a set of applications that enables application owners to track transactions as well as metrics such as conversions and revenue performance by product, customer segment and geography.

    Gandhi noted organizations don’t necessarily need to have embraced best DevOps practices to derive value from the company’s analytics applications. However, those that have embraced DevOps are likely to appreciate the value of these applications because they view themselves as a software company that happens to build a specific product or digital service.

    It’s not clear to what degree application owners may be willing to give up relying on spreadsheets and legacy BI applications they have relied on for decades to manage the business. However, a case can be made for aligning the business to IT more closely by tracking the events in real-time as they occur across application environments and the IT infrastructure on which they depend. In fact, the one thing that has always differentiated Dynatrace is its ability to leverage an artificial intelligence (AI) engine, dubbed Davis, to surface events and deliver actionable intelligence by identifying the root cause of an issue, said Gandhi.

    Other DevOps vendors that are venturing into the realm of business analytics include CloudBees and GitLab. As these vendors increasingly realize that business processes now frequently revolve around DevOps processes, they all see an opportunity to extend their franchises by providing analytics applications that are aimed well beyond their existing base of IT users. Less clear right now is which set of tools within a DevOps toolchain will serve as the primary source of data for those analytics applications. However, Gandhi did note that unlike continuous integration/continuous deployment (CI/CD) platforms, APM services can provide real-time visibility into the actual digital experiences that change as various events impact production applications.

    Regardless of the ultimate source of data, however, the one thing that is certain is the level of insight business users can have into application development and deployment processes trends is, for better or worse, about to increase substantially.

    — Mike Vizard