Tag: big data

  • DDoS Defense: Can You Tell Friend from Foe?

    DDoS Defense: Can You Tell Friend from Foe?

    In many organizations, networks are at the core of the business, enabling not only internal functions such as human resources, supply chain and finance, but also the services and transactions the business depends on for revenue. That makes network availability critical. Any interruption of access from the outside world turns off the revenue spigot, impacting profit and creating a poor user experience that can damage customer satisfaction and result in customer loss. The worse the outage, the worse the damage. That’s why speed is so important in detecting, diagnosing and responding to denial of service (DoS) and distributed denial of service (DDoS) attacks.

    One of the chief challenges in responding to an attack is to distinguish friend from foe. Without a way to drill down into traffic details and examine host-level traffic behavior, it can be difficult to tell the difference. Traditional network analysis technologies based on pre-cloud architectures have been too limited in their compute and storage capacity to do more than perform predefined alerting and summary reports. That’s just not enough information to really get to the heart of what’s happening in a complex networking scenario.

    Fortunately, new big data techniques allow us to dig deep into huge volumes of network traffic details so that it’s possible to understand what is really going on. With a properly implemented big data platform, you can pivot your views of data to gain insight rapidly, in operational time frames, so you can act to mitigate an attack or remediate a more innocent but still painful network issue. We’ll examine data that is readily available through common network traffic flow telemetry exports such as those provided by routers and switches enabled by NetFlow, sFlow or IPFIX.

    Starting at the Top

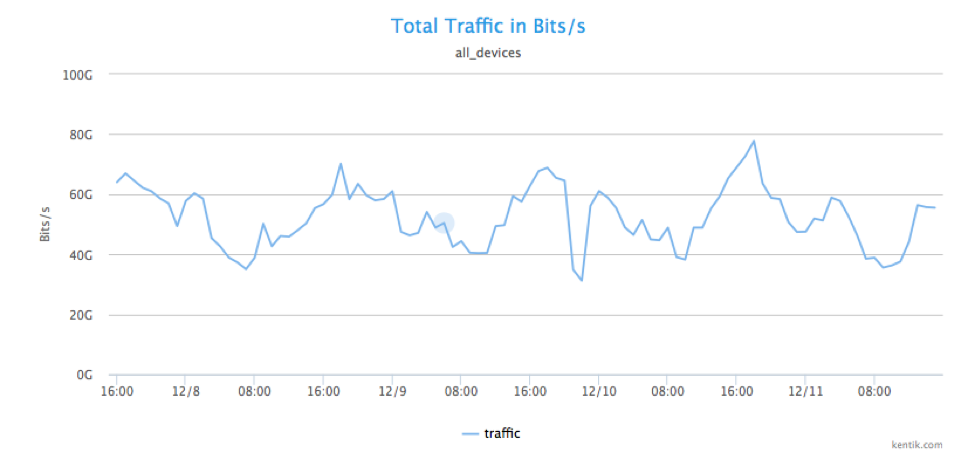
    Let’s say we’re seeing symptoms of an attack in our infrastructure. We’ll use traffic flow summary data to quickly scan total traffic in bits per second just to see if anything stands out.
    Picture1

    There’s no obvious traffic spike from this view, but then again the network we’re looking at is running at an average of 60 Gbps, so that doesn’t mean there aren’t worrying things going on at deeper levels of the network.

    Analyzing Source Geography

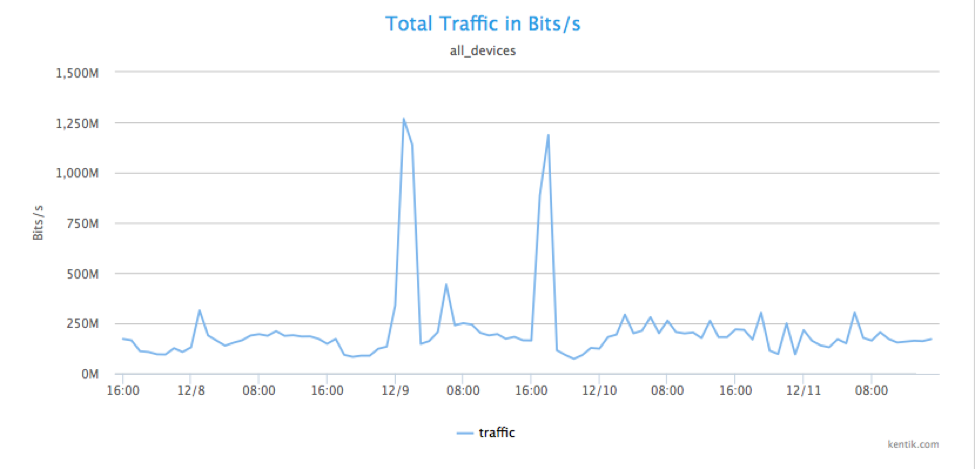
    One of the things that big data is good at is fusing many data sources together. By combining NetFlow data with GeoIP, we can look at traffic by source geography. In this case, the network doesn’t get a lot of traffic from China, so what happens when we filter total traffic by China as source?
    Picture2

    A ha! That analytical pivot produces a graph above, showing two obvious spikes that are well above average. Below, we zoom in on the time of the spikes.

    Picture3

    Analyzing Unique Source IPs

    The spikes themselves are suspicious, but is this just a large data file transfer? We can find out by looking at how many different source IPs are sending traffic. To look at host-level details, note that we’ve gone beyond the point where you can use summary information. At this point, we are analyzing raw NetFlow record details.

    Picture4

    Those raw NetFlow details sure are useful, because there is, in fact, a huge increase in the number of unique source IP addresses sending traffic to particular destination IPs. This tells us that we’re not looking at a large file transfer from a single machine, but a highly distributed set of senders. Botnet much?

    Who’s Getting Hammered?

    The next step is to  to determine which IP or IPs are getting all this (probably unwanted) traffic from 14,000 or so individual host IPs.

    Picture5

    The ability to dig into high volumes of host-level NetFlow details again proves its utility. We can see that the main target is a solitary destination IP address. There’s really only one likely explanation for traffic from thousands of hosts in a country which you have no business dealings with to a single IP that suddenly spikes from nearly nothing to more than 1 Gbps: This is a DDoS attack. Note that this isn’t a mega attack, but it still can cause real problems for whatever is running on that individual host and anything else that depends on it. If it’s your DNS server, the attack might make it impossible for lots of other servers and applications to function.

    Going Deeper

    Now that we know it’s a DDoS attack, we shouldn’t stop because we don’t know whether that attack is coming from other countries besides China. We pivot our analysis again to widen our lens.

    Picture6

    Lo and behold, there is indeed DDoS traffic coming from multiple countries, including the United States, Japan, Russia, Sweden, China, Taiwan, Brazil and Estonia. Good to know.

    Characterizing the Attack

    Next, we want to know specifically what type of traffic we’re seeing and what that tells us. We’ll group the traffic coming from all those source host IPs by protocol.

    Picture7

    Clearly, this is  UDP-based attack. Now we’ll look at the destination port(s).

    Picture8

    We can see that the UDP traffic is being sent to multiple ports, and it’s obvious that we’re experiencing a DNS redirection/amplification attack occurring on port 53, with a lot of port 0 UDP packet fragments being generated as collateral traffic.

    Is Something Underneath This Attack?

    So far we’ve gotten a lot of insight into the details of the DDoS attack from full NetFlow details. But is this volumetric DDoS the main event, or are we being distracted from looking for other, less obvious threats? We can see a lot of packets being sent to port 4444 (green line in graph).

    Port 4444 is the UDP port for the Kerberos service, and is—at least for Windows machines—a well-known target for buffer overflow attacks, often used to insert trojans such as Hlinic and Crackdown.

    So, potentially there are two types of attacks going on in parallel: a DDoS attack and a buffer overflow trojan insertion. Many security blogs and publications note that DDoS attacks often are used to obfuscate other exploits. This very well may be an example of that technique.

    Getting a Handle on Attack Mitigation

    Characterizing the attacks leads us to mitigation. One way is to take the attack traffic and group it by x/24 source network addresses:

    Picture9

    We now can take two mitigation steps:

    • Ask our upstream ISP to drop this traffic or send it to a scrubbing service or device, if we have one.
    • As an added precaution, drop all traffic from these countries going to port 4444 on our own routers.

    Conclusion

    One of the benefits of being able to dig into full-resolution NetFlow data is that you can get operationally useful insights without needing in-line devices. You also get more freedom to employ a portfolio of mitigation methods. Big data is the way forward if you want to have full details at your disposal to deal with DDoS attacks.

    About the Author / Alex Henthorn-Iwane

    AlexAlex Henthorn-Iwane is the Vice President of Marketing at Kentik. He has more than 20 years of experience bringing new technologies in networking, security and software to global markets. Henthorn-Iwane leads the global marketing strategy for Kentik and help the company bring its innovative story and solutions to network-dependent organizations around the world. Connect with him on LinkedIn, Twitter or SlideShare.

  • Things to Know When Planning for Cassandra Backup

    Things to Know When Planning for Cassandra Backup

    NoSQL databases such as Apache Cassandra, MongoDB, Amazon DynamoDB, Azure DocumentDB and others are being adopted by enterprises to meet the data requirements of next-generation applications. Specifically, Apache Cassandra database provides linear scalability, a flexible consistency model and shared-nothing architecture that enables enterprises to scale their database footprint according to performance needs.

    As mission-critical applications are being deployed on Cassandra databases, there are enterprise data management requirements also, such as backup and recovery. Today, there are various options available for backup and recovery of Cassandra. These options have pros and cons, which I will elaborate on in this blog post. It is important for a Cassandra database administrator (DBA) to understand the pros and cons of these options before choosing any option and validating products and solutions available to achieve enterprise goals for backup and recovery.

    Let me first point out the important features that DBAs should look for while planning the backup:

    1. Secondary Storage footprint: Efficient storage utilization is key for any backup and recovery design and plan. The backup data set may be much larger than primary setup depending on the retention period of the backup data. Hence, if storage management is not efficient, customer storage capital expenditure could increase multifold, defeating the purpose of data protection.
    2. RPO and RTO: Recovery point objective (RPO) is the maximum targeted period in which data might be lost from an IT service due to a major incident. Recovery time objective (RTO) is the targeted duration of time and a service level within which a business process must be restored after a disaster. Typically, enterprise requirements for these next-generation applications dictate very small RPOs and RTOs.
    3. Backup performance: This is the time spent in backing up the desired data set. Typically, the backup performance should be scalable enough to match the data change rate at the primary cluster. In addition, the time spent in taking the initial full backup of the primary cluster also matters, so periodical backup is not affected.

    Cassandra Backup Options

    Now let’s take a look at four options available for performing Cassandra backup:

    Snapshot-based Backup

    Cassandra provides native node-level snapshot option via the nodetool command. Snapshot creates a hard link to existing Cassandra data files and expects users to delete it after backing up the files. This way, despite changes in Cassandra data, the backup is performed from snapshot files.

    Pros:

    • Simpler to manage: It requires periodical snapshot commands on each of the nodes, triggering backup on snapshot files and removal of snapshot files after backup.

    Cons:

    • Not a true backup: Node-level snapshot doesn’t mean cluster-consistent backup and such a simplistic strategy will result in heavy repairs upon recovery.
    • Potential large RPO: The snapshot operation is not trivial, as it requires flushing of all in-memory data on disk and, hence, frequent invocation of snapshots will impact the production cluster’s performance dearly.
    • Large storage footprint due to data compaction at primary cluster: As part of data compaction, Cassandra merges multiple data files on a node into a new file and, hence, reduces multiple versions of a record to a single and latest version. Compaction not only helps in reduction of data at the primary cluster, it also improves the read performance as it reduces the number of files to look up for a record. As a side effect of compaction, it’s possible that same records will appear in multiple versions, as they are merged into a new compacted file. It isn’t a trivial task to filter out already captured records from a compacted file. Depending on various aspects such as workload type, compaction strategy or versioning interval, compaction may cause multifold more data to be backed up, causing a serious impact on CapEx planning.
    • Snapshot storage management at primary cluster: Cassandra expects users or admins to clean up snapshot files after they are no longer required. It requires a reliable job to clean up the snapshot folders; otherwise, they may affect the primary cluster’s availability due to lack of storage.
    • Siloed solution: Enterprises require multiplatform backup and recovery product and native tools are built specifically for a particular database and don’t scale for multiple databases.

    Incremental Backup

    Cassandra supports incremental backup functionality. If enabled, every time Cassandra flushes memory content as a new file, a hard link for the new file is created in the incremental backup folder. Once the backup of these files is done, the administrator is supposed to delete these hard links. The best part of incremental backup is that the hard link is created only for newly created file due to the flushing of in-memory data contents. Files created due to compaction are not hard-linked.

    Pros:

    • Better storage utilization: There are no duplicate records in the backup, as the compacted files are not backed up.
    • Point-in-time backup: Companies can achieve better RPO, as backing up from the incremental backup folder is a continuous process and, hence, versioning can be done more granularly.

    Cons:

    • Space management at primary cluster: With this option, companies need a reliable space management process on the primary cluster. The incremental backup folder must be emptied after being backed up. Failure to do so may cause serious space issue on the primary cluster.
    • Creates lots of small size file in backup: Since incremental backup facilitates a backup of new files created due to the flush of in-memory data from Cassandra, typically the file size is small. This leads to many small files, making file management and recovery not a trivial task (and fairly expensive compared to the RTO guarantees customers want and expect).

    Incremental Backup in Combination with the Snapshot

    Incremental backup in combination with snapshots is another rudimentary way to take Cassandra point-in-time backups. Periodically, data is backed up from the snapshot, while incremental backup-based files are used for point-in-time needs. This means periodically the incremental backup-based files, which are already covered via snapshot-based backup, must be deleted.

    Pros:

    • Fairly large-size backup files: Only the data between periodical snapshots are from the incremental backup.
    • Point in time: It provides a point-in-time backup and restores.

    Cons:

    • Space management in backup: After every snapshot, the incremental backed-up data needs to be cleaned up. Also, for backed-up files from the snapshot, a large backup storage footprint due to compaction at primary always is a concern.
    • Operationally very heavy: This method requires DBA admins to script solutions; this is not scalable for enterprise scale.

    Commit-Log Backup in Combination with the Snapshot

    This method is similar to incremental backup. Rather than backing up the newly added SSTables, DBA admins archive the commit-log. Periodical snapshot-based backup provides the bulk of backup data, while the archived commit-log is used for the point-in-time backup.

    Pros:

    • Point in time: Snapshot-based backups in the combination of commit-log archival provide a point-in-time backup option.

    Cons:

    • Space management: Again, the commit-log archival space management is admin’s responsibility; this method results in operational heavy solution (OpEx).
    • Restore complexity: The restore is a lot more complex, as part of restore will happen from the commit-log replay.
    • Storage overhead: Snapshot-based backup will have a storage overuse issue because of duplication of data due to compaction. This results in a very large use of secondary storage and, thus, a very high CapEx expenditure.

    Summary

    Overall, Cassandra provides multiple options for backup. Typically, snapshot-based backup in the combination of commit-log archiving/incremental backup is used if the point-in-time restore is a requirement. If point-in-time restore is not a requirement, simple snapshot-based backup is much easier to implement, though it is not a true backup and will result in heavy repairs.

    Most of these options require significant manual effort and are error prone. They work for staging or preproduction and test/dev environments that are smaller in scale and can sustain data loss and high RTO. However, for large enterprise customers and production deployments, there are key requirements such as data reduction via novel compression/de-duplication techniques, various failure handling and faster recovery with desired consistency.

    For mission-critical, always-on applications where minimizing data loss and operational resiliency are important factors,  administrators should consider leveraging next-generation data protection products from companies that specialize in this area.

  • Useful Big Data Terminologies, Part 1

    Useful Big Data Terminologies, Part 1

    As data continues to increase at an evermore rapid pace, organizations struggle to deal with this data torrent, let alone use it to analyze and capture value. The ways used to understand this big data also is increasingly rapidly, which introduces myriad terms used to define these methods.

    The follow is an attempt to provide natural explanations to some of the significant terms and technologies you will come across when you’re getting into big data.

    Algorithms: Mathematical and analytical formulas that also include statistical processes used to analyze data. Algorithms are implemented in software to analyze, process the input data and produce output or results.

    Analytics: The course of depicting conclusions based on the raw data. With the help of analysis, otherwise-meaningless numbers and data can be converted into something useful. The emphasis here is on interpretation and not on big software systems. That may be why data analysts are very experienced in the art of storytelling.

    Biometrics: Using analytics and technology to identify people by one or many of physical characteristics, such as fingerprint recognition, face recognition or iris recognition.

    Cassandra: A very well-known open-source database management system managed by the Apache Software Foundation, which has been constructed to handle high volumes of data throughout distributed servers.

    Cloud: A term used to describe data or software running on remote servers rather than locally. Data stored in the cloud is usually reachable over the internet, wherever the owner of that data in the world might be.

    Database: A systematized collection of data, such as schemas, charts or tables. A database management system (DBMS) is software that helps in data analysis and exploration.

    Data Mining: This term can mean different things for different context. To the layman, it means the automatic examining of large databases. To an analyst, it refers to the pool of statistical and machine learning methods used in the databases.

    Dark Data: The information collected and managed by a business that is never put to use, yet sits waiting to be studied. Most companies don’t realize they have a lot of this kind of data lying around.

    Data Scientist: A skilled expert in extracting value and insights from data. A data scientist typically is someone with skills in computer science, analytics, mathematics, creativity, statistics, communication and data visualization, as well as strategy and business.

    Gamification: The process of creating a game-like environment in areas that typically would not have games, such as websites, to attract users and increase engagement. In the terms of big data, a gamification is a powerful tool for incentivizing the data collection.

    Hadoop: An open-source software structure that works mainly by processing and storing files and data. Hadoop is known for its big processing power, which makes it easy to run a host of tasks alongside. It helps companies access, save and analyze enormous amounts of data.

    IoT: An acronym that stands for internet of things. Principally, it defines an ecosystem of things, from diapers to self-driving cars, that can communicate with each other via the internet. Their sensors generate a large amount of data that can be analyzed.

    Machine Learning: A highly casual way performing data analysis. Machine learning mechanizes logical model building and trusts on the ability of the device to adapt. With the use of algorithms, models dynamically learn and improve themselves every time they process any new data. Machine learning is not new; however, it is receiving massive attraction as a modern tool for data analysis. It allows devices to grow and acclimatize without demanding numerous hours of extra work by the scientists.

    MapReduce: A model for programming, generating and processing massive data sets. It does two different things: the Map, which includes rotating one dataset to the other, more valuable and fragmented dataset made of bits known as tuples; and the Reduce, which takes all of these fragmented tuples and breaks them even further. It results in a useful breakdown of information.

    NoSQL: Database management systems that do not use relational tables used in most old-style database systems. The data retrieval and storage system is designed for managing massive volumes of data without tabular categorization.

    SaaS: An acronym for software as a service, a method of application delivery in which vendors host applications and make them available through the internet. SaaS providers deliver their services via the cloud.

    Spark: An open-source computing structure developed at the University of California, Berkeley, and donated to the Apache Foundation. It is used for interactive analytics and machine learning.

  • 5 Development Trends Reshaping Testing

    5 Development Trends Reshaping Testing

    There’s no shortage of new development trends, but virtual reality, containers, big data, hyperconnected apps and IoT are affecting testing the most today.

    If you like change and challenge, it’s a fun time to work in software. Some technology developments, such as cloud computing, have been gaining speed slowly over many years. That steady progression has meant that developers can stay on top of trends easily and be informed about market changes. Other areas, such as containers, have come to fruition much faster without as much notice. Development teams have had to scramble to stay ahead of these trends, hoping to capitalize on a their efficiency gains while staying ahead of the curve. Here’s a look at five important software trends which are having a profound effect on testing.

    Containers

    Docker made containerization cool and exciting in 2013, even though containers have arguably been around for many years, if not decades. Developers love containers because the technology makes it much easier to set up and install software in different environments, such as in the public cloud or in a private data center. Containers wrap up all of the infrastructure components that otherwise would be installed separately into one easily portable package with a common standard. And since multiple containers can run on the same hardware without creating problems, you can do more with less infrastructure. Typically, containers can move between different environments with relative ease—a nice benefit for multicloud infrastructures. Containers have evolved quickly from an experimental platform to a mainstream infrastructure technology, with many major businesses taking advantage of containers to deliver their product at scale.

    Testing considerations: It’s hard to find much at fault for containers when it comes to facilitating software testing. Because of the ease in setting up test environments and moving code from one environment to another during the production cycle, testers can work much faster. Before containers, there was a lot more waiting around by both developers and testers. When it takes two weeks to set up an environment for a testing cycle that took two hours, teams would tend toward less frequent releases or would do less testing. Now, it is a matter of minutes to set up a testing environment. This is great for companies and development teams that value testing and want to test more frequently with greater access to a variety of environments.

    Another boon with containers is stability. In the past, bugs sometimes appeared due to configuration errors from setting up dev/test environments. Given the plug-and-play nature of containers, there’s little if any concern about the proper configurations being completed before a testing environment can be used. Security has been an ongoing concern with containers, especially in highly regulated sectors such as health care, government and financial services. In those cases, companies may have to support two versions of the code—one in a containerized platform and one in a more traditional virtual or bare-metal environment. We believe this will be a short-term situation as containerization technology matures and becomes adopted across all industries.

    Big Data

    Whether you want to use this vague and overhyped term or not, big data is simply a new way to refer to larger than normal data sets. Big data became a big trend as the hardware and software to store and manage it got a lot more powerful and cheaper, and the cloud shift helped to centralize data sets into one location. Some large companies and research organizations are seeing interesting results from big data projects already, whether in more targeted drug development (precision medicine) or just-in-time environmental data for farmers. Now, every Tom, Dick and Harry is trying to get into the big data market, which means there are too many solutions to count. A natural weeding-out process will occur over the next few years, as the prominent big data players and NoSQL standards converge into two or three leading providers.

    Testing considerations: Big data applications bring value through the way they manage and/or analyze data, not so much through the user interface. Therefore, testing for big data applications is going to require more technical, database-oriented skills. Those skills are also different from the typical relational database skills of the past, given the fact that big data platforms typically are designed to manage structured and unstructured data. These are open source tools and systems such as NoSQL and Hadoop, along with large vendor systems such as SAP HANA. Testers in this field will need to be constantly adapting learning these new technologies.

    Virtual Reality

    Investors have funneled $8.8 billion into the sector since 2012, according to SuperData Research. Google, Facebook, Microsoft, Samsung and HTC are all in the game. The market is segmented between VR, augmented reality (AR) and mixed reality (MR) and consists of both traditional (PC/console) and mobile device applications. VR is a fully immersive, fully virtual experience that mimics reality, while AR and MR are different variations of blending real and virtual environments together. VR applications aren’t just for gaming anymore: We now are seeing the technology being used for product design and collaboration, tourism/travel and entertainment, including film.

    Testing considerations: VR is an emerging technology still, with many different types of platforms, no clear leaders and no real standards in place. That makes it more difficult for developers and testers to make strategic decisions around technology. As well, there aren’t any great tools for automated testing in these environments yet. Therefore, the need for manual and real-world testing will add time and cost to the project. Yet, investing in doing this right is critical for ensuring optimal user experience. In virtual reality environments, it’s difficult to simulate experiences, such as testing for motion sickness, without actually playing with the real devices. This is especially challenging with the newer mobile platforms, such as Google Cardboard, which incorporate a viewing device that transforms the mobile phone into a VR headset. That experience simply can’t be simulated accurately on a PC, a common testing strategy for other mobile apps. Companies testing mobile VR apps may need to invest in the purchase of dozens or hundreds of different mobile devices to gain an accurate picture of how the application performs for most users.

    Hyperconnected Apps

    Web-based and consumer apps comprise the bulk of hyperconnected apps, characterized by having deep, often real-time integration with other applications. Instagram and Facebook, Gmail and Google Calendar, Salesforce and their wealth of apps—these are just a few examples of hyperconnectivity. The advent of REST APIs has facilitated far easier and cheaper integration so any company can build a platform of third-party software in ways they couldn’t have imagined five or 10 years ago. Similarly, with the explosion of the app economy, including open source software, it doesn’t make good economic sense to write 100 percent of code in your application any longer. Product value is increasing the result of how developers can patch together different technologies in innovative ways.

    Testing considerations: Given the importance of APIs in hyperconnected applications, a primary testing consideration will be ensuring the performance validity of those connection points. It’s imperative for both developers and testers to be aware of API update schedules and to test those updates immediately for any negative impact on the application. Beyond API testing, load and performance testing are also important considerations for hyperconnected applications, which typically involve heavy and/or unpredictable transaction processing. Overall, these types of testing are much more technical in nature than manual UI testing and will require testers to expand their skill set to optimize value.

    Internet of Things (IoT)

    The interest in (and hype) for the IoT sector rivals the largest IT trends, such as big data. Initial applications have focused on connecting devices, such as home lighting and thermostat systems, which use sensors to stream data to smartphones. Over time, we will see more device-to-device connections such as a thermostat collecting data from a smoke detector to ensure that the house isn’t on fire if the temperature rises dramatically. Products such as Amazon Echo and Google Nest might be at the heart of many new consumer-based IoT applications, but there is also ample potential in sectors such as utilities, health care, industrial equipment and government (a.k.a. smart city initiatives).

    Testing considerations: As IoT applications mature, connectivity complexity will grow. IoT applications can involve many components: the hardware of the smart device or product and the software that controls it, along with the user applications that interact with the product. When troubleshooting an issue or vulnerability, a tester must investigate the applications that collect, analyze and display the IoT data, the various network connections across which that data travels, the IoT appliance’s hardware and its software. Hardware testing must incorporate typical scenarios such as what happens to the user experience when a device starts to run low on battery or goes offline. Testers will be most valuable when they have experience in both hardware and software testing; alternatively, an organization can have two teams of testers but they must be in very close contact. IoT apps should also be configured to collect and deliver more alerts and logging data than mobile apps, due to the higher number of components involved. This will make it easier to prevent, troubleshoot and fix problems when they arise.

    About the author/Kevin Dunne

    Kevin Dunne picKevin Dunne is VP of Strategy and Business Development at QASymphony.


  • Continuous Delivery and Deployment: A Tale of Two Models

    Continuous Delivery and Deployment: A Tale of Two Models

    EnerNOC (Energy Network Operations Center) is an energy intelligence software provider with more than 1,300 employees in its Boston headquarters and international locations. The public firm helps global customers to efficiently consume energy. “Our mission is to change how the world uses energy, helping customers to improve profitability and visibility for better decision-making and sustainability by focusing on how they buy energy and when and how they use it,” says James Nichols, principal engineer and cloud architect at EnerNOC.

    A regular user of Splunk (the company uses other DevOps tools and platforms as well, including AWS and Oracle), EnerNOC has fully automated monitoring in its perpetual drive to move past continuous delivery and on to continuous deployment.

    Embedded in EnerNOC’s story of why it uses continuous development and continuous deployment models is a chapter on its move to fully automated monitoring.

    EnerNOC DevOps Models

    EnerNOC’s DevOps model is in constant transition toward full automation. Currently, it has fully automated deployment, fully automated monitoring and semi-automated quality assurance (QA), which pull the company’s continuous development approaches.

    A change to “builds on commit” of smaller applications within the legacy software monolith at EnerNOC came hand in hand with further automation, targeting what the company calls “trustworthy continuous deployment,” Nichols says. That was the crux of EnerNOC extending itself into deployment automation.

    Wherever the model is not fully automated and continuous in deployment, it remains continuous delivery. “Most of the variance between the approaches is due to aspects of the delivery pipeline that still have manual processes; these parts are usually comprised of the remaining manual testing procedures,” says Nichols.

    Change Control Necessitates Two Models

    EnerNOC develops and maintains mission-critical software that must pass through a change management approval process. This process includes communications within and across the company and customers, as well as user acceptance testing. This is where the manual testing comes in. Only at the end of this approval pipeline can EnerNOC pass the software baton into the hands of production.

    Due to EnerNOC’s tightly yoked systems and the manual testing, change control remains, along with a mix of continuous development and semi-automation with fully automated continuous deployment. “DevOps is a cultural movement as well as a technical one, and so the existing model could evolve with the organization’s quality and maturity evolutions,” says Nichols. If the manual testing and the relationships between systems give way to more fully automated testing and more amenable relationships, QA could more closely embrace full automation.

    Monitoring Challenges/Achievements

    EnerNOC’s application diversity includes hybrid software with a foothold in the Amazon cloud, in EnerNOC’s data centers and on-premises. “We use three tiers on top of Oracle in the data center. In AWS, we use a combination of big data, cloud-friendly and serverless technologies,” says Nichols. Business transaction data traverses many machines that belong to service groups’ stakeholders. “The distributed, decentralized architecture makes troubleshooting, performance management, security operations and production operations challenging,” notes Nichols. Better monitoring was the answer.

    EnerNOC wanted to offer nontechnical users easy access to systems-level monitoring data with transparency into the many systems through a single pane-of-glass dashboard with readily available system notices and troubleshooting abilities. “We would use Splunk to do this and then feedback everything we learned from using Splunk into driving our DevOps and engineering processes into the future,” he says.

    The EnerNOC DevOps performance team built the dashboard that accompanied the Splunk service, ensuring it would register the performance metrics that are of value to the organization. The performance, product management and development teams maintain an awareness of the metrics and receive the related alerts. “The development team incorporates the ongoing metrics early in the development life cycle to improve application performance,” says Nichols.

    EnerNOC first applied Splunk to web logs for operational capacity planning, then used Splunk to give the Ops team transparency into the function of its new real-time data product that was working in production. As new products came on board, the organization added them to Splunk to provide Ops teams with dashboards, at the urgent request of Ops team members.

    Current Status: All Systems Good

    EnerNOC applies Splunk to test and production systems for views into consistency and acceleration. “Splunk is our primary alerting infrastructure for low-level system metrics like CPU utilization as well as for complex business transactions that span multiple systems,” says Nichols. Splunk has eyes on application health, cluster state across machines, expected systems tasks and suspect or known-bad system behavior, as well as the presence or lack of any significant event.

  • Application Monitoring in the Age of Big Data

    Application Monitoring in the Age of Big Data

    Operations (or ops, as it is known colloquially) has been necessary since the first shared systems came online in the ’60s. While the job title didn’t necessarily exist, the same questions needed answers then as they do now:

    • Is it up and accessible?
    • Is it responding in a reasonable time frame?
    • Is it performing better or worse now than previously?

    In a simple system, say a static web site, these questions are answered easily by requesting the page. In an automated fashion, of course.

    However, when you look at any “late model” technical infrastructure, you’ll find many, many moving parts. These range from border routers to web servers, work queues to databases and data caches to big data clusters. There are thousands upon thousands of computing instances, software processes, network storage devices and network links that can go down, up or just plain wonky. This means potentially millions of places where things can go wrong.

    How do you keep an eye on all of these potential issues? How do you know if they’re responsive? How do you know if things are getting better or worse?

    Some Monitoring Progress

    The “old” method was to write some sort of monitoring script that polled some data that you thought would represent the overall health of that component. Through the years things have gotten more granular. Our monitoring script libraries have grown and we’ve even instrumented our applications with counters (statsd, librato, etc.) and come up with big data storage (opentsdb) to house all of these data points.

    The question remains, Do we have any more clarity than before? We unarguably have more data points. So we must know more about the performance of our systems, right?

    Turns out, in practice, we just have a lot of data and a lot of people attempting to decipher what that data means. If you’ve worked in operations you’ve been up at 2 a.m. looking at status dashboards with green, yellow and red icons and many, many graphs, all in an effort to answer the question: What is going on?

    Sure, some incidents are easy: An instance was retired, or a fiber line was cut somewhere in Kansas.

    I’m talking about the ones that aren’t so clear cut, so to speak:

    • Site feels slow
    • Median response times are up 25 percent from yesterday
    • Usage is down week over week compared to some relevant time frame

    How do you answer those questions in a haystack of data points, up/down status and, in some cases, just plain noise? Application performance managers (APMs) came along and gave us tooling in the app frameworks and the browser. Now we have visibility into which calls are performing poorly and how our app “feels” to the end user.

    This has helped by breaking down the haystack into smaller haystacks and provided a way to search and sort potential performance issues. However, most APM tools depend on instrumenting code such as Java, .Net or Ruby, and are not able to provide monitoring insights for the rapidly growing open source frameworks such as Grails, Akka, Netflix OSS and the like. We’re still left with the haystack problem: What is going on?

    When I’m up at 2 a.m., stumbling over to the computer to find out what issue PagerDuty has alerted me to, I don’t really want to pore through page after page of graphs and up/down status. What would be really helpful is a system that can aggregate all those monitoring data flows and statuses, actually apply some intelligence. Then it could tell me, “Look at this response time of this component, and this metric is reporting something anomalous. This is most likely causing your issue right now.”

    In other words, it would be helpful to have a system that can show both the symptoms and the root cause of the issue. That system also would provide high-quality, high-value information about my infrastructure and combine anomaly detection with root cause analysis to provide real root cause detection.

    One new startup, OpsClarity, is hoping to make troubleshooting more accurate and efficient by combining data science and anomaly detection with root cause analysis.

    Perhaps this is the long overdue beginning of the next age in monitoring.


    About the Author/Michael Hobbs

    Michael Hobbs HeadshotMichael Hobbs is the director of Technical Operations at Expa, a startup studio based in San Francisco. Significant experience in building, operating and automating highly scalable application infrastructures has allowed him to contribute to the success of Infusionsoft and Stumbleupon, among others. Michael continues to put that expertise to work at Expa by advising and assisting the next generation of Internet companies. Michael is also a significant contributor to many open source projects, including dokku and herokuish.

     

  • 4 Tech Imperatives in 2016 to Prepare for Tomorrow

    4 Tech Imperatives in 2016 to Prepare for Tomorrow

    Around the start of every new year come a bevy of predictions about what’s coming (or what someone, or some vendor, or some analyst hopes is coming) in the year ahead. Rather than do that, based on recent conversations with many CIOs, I’ve collected what I think are imperative to-do’s for CIOs and IT leaders to ensure their enterprises can innovate in the years ahead.

    If you don’t already have these in your crosshairs, here are four tech imperatives for 2016:

    Action Item 1: While IoT gets the buzz, groom those mobile app backlogs
    The world has gone mobile. That’s no secret. Mobile analytics firm Flurry found that business productivity apps grew 125 percent in 2015, because most every employee today is armed with a mobile device and more comfortable than ever working on mobile devices. And mobile enterprise investments will continue.

    Currently, however, most enterprises still have considerable mobile backlogs. In the year ahead, it’s imperative they address those backlogs. This investment in mobile apps will continue, so enterprises must clear through the clutter and groom their mobile app backlogs. This year you’ll hear more and more about the Internet of Things, or IoT. (I know, I know, how can we expect to hear more about IoT in ’16 than we did in ’15? Trust me, we will.) Companies first must focus on enterprise and productivity-enhancing apps, while planning and preparing systems and plans for the expansion to IoT.

    In the next few years, IoT will include access to wearables and their data, enterprise office equipment, office buildings, cars and virtually anything else that can be tethered to the Internet. But, for now, the focus for most enterprises must be on clearing their mobile app backlog and grooming their mobile app pipelines, and then setting the stage for the architecture that will be required to support their eventual IoT efforts.

    Action Item 2: Get a tight focus on micromoments
    These days, employees are making every second of the business day count, even when they’re away from their desk. Most employees aren’t sitting, working in front of computer monitors; today, most everyone is on the move and spending more time working on small-screen tablets and smartphones. This has changed how we interact with each other—and our applications.

    Today, workers have short exchanges in text or on social media, short discussions on the phone, and short interactions with their apps. Rather than settling in and computing at a desktop PC, we are computing on our mobile devices while we walk office to office, or are waiting in a conference room for a meeting to start. We are computing, more than ever, in “micromoments.” Guiding developers to develop strategically for mobile is still an imperative for CIOs this year.

    What do I mean? Development teams must ensure their apps are built so users can engage in the context of their moment, based on their location, the task they are undertaking or perhaps the time of the day. Thus, apps must be developed so that data can be entered quickly and easily and consumed readily. And the micromoments app experience must be congruent with those on notebooks and tablets, when people typically are settling in for longer stretches of work and concentration.

    Action Item 3: If enterprises haven’t already, they need to develop their IoT brokers and management platform strategy
    All of those IoT devices we mentioned above will need to be managed. This will require cloud-based platforms that will:

    • look at the data,
    • protect the traffic from being attacked,
    • accept legitimate traffic,
    • dispatch it to where it needs to go,
    • save the appropriate data for long-term analytics,
    • send other data for real-time analytics and response, and
    • enforce security and privacy policies.

    Managing the security, storage and traffic will be a strategic effort in the years ahead, and the groundwork needs to be set sooner rather than later.

    This year is the time to build the strategy for your enterprise’s IoT platform strategy, so the IoT data can be managed properly and management can scale as the use of IoT grows. Think this won’t apply to you? Think again. Gartner predicts that there will be more than 25 billion IoT devices by 2020, up from 4.9 billion today—and a good portion of them will be enterprise IoT devices.

    Action Item 4: Create the data-driven culture
    Big data analytics has touched nearly every aspect of business, from health care, with data-driven medicine saving hundreds of millions annually, to electric utilities managing the grid more intelligently, to helping marketing teams understand and pinpoint their target audiences with more intelligence and precision than ever before possible.

    What’s often forgotten about big data analytics is that success here is about much more than databases, storage, dashboards and data scientists. It’s as much about creating a data-driven culture in which decision-makers in the organization are motivated to make the most of the data and analytics to move the organization forward in the best way possible. Strategically, CIOs want to create this culture, make as much data as possible available to employees, and deliver the data to them in the context of their roles. They want to develop platforms that democratize the data to as many people as possible so they can seek the insight they need.

    Enterprises today already have a lot of the critical data in their software, ERP systems, employees and customers. In the years ahead, IoT devices will create additional tsunamis of data to be analyzed and acted upon for strategic advantage in the earlier years and to simply maintain the status quo in the years beyond. That’s why it’s so important to get this on the strategic radar today.

  • Why You Need to Embrace Automation

    Just in case you hadn’t noticed: The robots are coming.

    Well, you probably had noticed. It’s hard to miss. Newspaper articles and blogs everywhere herald their arrival. The stories usually follow the same general formula: A catalogue of amazing things that robots (really, AI systems) can do. Debate about forced unemployment vs. people freed up to do more interesting work. And then some comments about whether it’s for the good or bad. You can generally infer the general tone from the choice of image accompanying the story: a cute Japanese robot with a plastic smile or a more sinister face with the Terminator’s jawline.

    Of course, workplace automation has been around for almost as long as we have had workplaces. Each new wave of technology disrupts the employment landscape in its own particular way. However, this time it’s serious: It’s not just manual labor that’s under threat, but increasingly, we’re told, white-collar workers are being supplanted by machines. A recent McKinsey report has generated a wave of headlines: “Even the CEO’s job is susceptible to automation,” wrote Patrick Nelson at Network World; and Ana Swanson at the Washington Post reported, “How robots will even affect the jobs of people we thought were immune.”

    Not surprisingly, a closer read of the McKinsey material gives a more nuanced appraisal than a headline can offer. Few of us will actually be replaced by a robot, but many workers will lose some part of their current jobs to automation. The McKinsey report states that up to 45 percent of the activities that employees perform today could be automated, but very few occupations will be automated entirely in the near or medium term. The things that require creativity and emotion remain uniquely in the domain of humans, and they are likely to remain there for quite some time.

    It’s against this background that we see a steady increase in what is often referred to as robot journalism: machines writing news stories. So far, these applications rely on scenarios where the general ‘shape’ of a story remains pretty consistent because of the regularity of the data underlying those stories. For example, a report on stock performance is always going to mention the current stock price, what the stock price was at some particular point in the past, the price highs and lows, and perhaps something on volume or analyst sentiment. These reports often are found in the back pages of a newspaper, and are the stories that few journalists actually want to write, since they allow almost no space for creativity and emotion.

    The reality is that today’s news-writing software is still a long way from replacing human journalists. Which is not to say that what a robot journalist produces isn’t useful; it surely is. Last month I spoke about robot journalism at the news:rewired conference. It was fascinating to see how most of the major news media are exploring how to get robots on staff. So while we’re going to see more robot journalists, it doesn’t necessarily mean fewer human journalists. A recent study by researchers at Oxford University and Deloitte explored how susceptible various jobs were to automation—journalists ranked 285th out of 366 jobs, with an ‘automation risk’ of just 8 percent.

    But if you really want to see where the action is regarding automated writing, just look at it from a different angle. Rather than Natural Language Generation displacing people from their jobs, it’s offering a solution to the problem of shortage: A shortage of workers or expertise. And that story isn’t about news; it’s the Big Data story. You can take issue with the astounding numbers that are thrown around, but even if they’re out by a factor of 10, they’re still significant: by 2020, about 1.7MB of new information will be created every second for each person on earth. But less than 0.5 percent of all data is ever analyzed.

    In 2011, McKinsey noted, “The United States alone faced a shortage of 140,000 to 190,000 people with analytical expertise, and 1.5 million managers and analysts with the skills to understand and make decisions based on the analysis of big data.” And subsequent reporting points to massive year-on-year leaps in demand.

    Regardless of how few or how many people are displaced by robots, they are not all going to become data scientists. The only way this volume of data will be analyzed and explained is if we have machines doing it for us. And that’s the real calling and promise of Natural Language Generation (NLG). Interactive visualizations and dashboards don’t cut it; the meaning in all that data will be lost unless we call in the robots. But you need more than robot journalists, tirelessly churning out one formulaic story after another. You need articulate robots that use sophisticated NLG to construct fluent narratives from idiosyncratic data sets. So, accept the data reality, embrace automation, and find an NLG robot to explain the insights buried in your data.

    About the Author:

    2,41 CWDr. Robert Dale, Chief Technology Officer and Chief Strategy Scientist at Arria NLG, is recognized as one of the world’s foremost experts in Natural Language Generation (NLG) research and Development, having authored or edited seven books and 160 papers on computational linguistics. He was a Professor in the Department of Computing, Director of the Centre for Language Technology at Macquarie University.  He co-authored the seminal textbook “Building Natural Language Generation Systems” with Arria NLG Chief Scientist and co-founder Professor Ehud Reiter.

  • 7 things 2016 has in store for the future of DevOps and IT

    7 things 2016 has in store for the future of DevOps and IT

    With only a couple weeks left in 2015 it’s time to start looking ahead to what next year has in store. Let’s be honest—most of us have already mentally checked out for the holidays anyway, so it’s already 2016 for all intents and purposes. I spoke with a handful of industry experts to get some thoughts on what we have to look forward to in 2016.

    Let’s just jump right in:

    1. Log Management will play a larger role

    According to Christian Beedgen, CTO of Sumo Logic, log management will emerge as the most underrated opportunity for IT. “Thinking about log data may seem too far in the weeds for most tech industry professionals. However, using analytics to monitor, manage and gather insights from logs will be the only near-perfect way to make sense of the increasingly complex and cloud-based architectures.” Log management isn’t exactly new or cutting edge, but Beedgen believes that 2016 will see more vendors trying to move into the log management space, and more organizations trying to use log management to make sense of their big data mess.

    1. Business leaders will demand better insight

    On a similar note, Rick Fitz, senior VP or IT Markets for Splunk, believes that analyzing data and metrics will also play a role from a business strategy perspective. “In 2016 we will see data science demystified, moving from Ph.D. to MBA, with easier ways emerging to consume, analyze and correlate machine data. As business leaders increasingly go digital, this will result in greater “digital insight” into engagement, satisfaction, competition, effectiveness, response, revenue and other business goals.”

    1. Sharing economy will transform IT

    Companies like Uber and AirBnB have transformed entire market segments. The sharing economy has changed the way businesses engage customers and deliver services, and that includes IT through aspects such as cloud services, microservices, APIs and more. Fitz predicts, “Next year this ‘Uberfication of IT’ will turn into a ‘Balkanization of IT,’ driving stakeholders to demand better insight, governance and control of federated technologies to integrate adoption, usage, monitoring, security, cost control and more across shared services.”

    1. Enterprise DevOps will grow rapidly

    The DevOps revolution has taken IT and app development by storm in recent years, but most of the traction has been in startups or smaller businesses that have more freedom to shift gears and embrace new concepts. Enterprise adoption has been growing, but at a much slower rate. Andi Mann, chief technology advocate for Splunk, said, “In 2016 we will see rapid acceleration of DevOps with 50 percent or more of large businesses finally adopting ‘Enterprise DevOps’ — a pragmatic, scalable approach to adopting the culture, process and technology changes at the heart of DevOps.”

    1. The singularity approaches

    OK. That may be an ominous over-statement. In a nutshell, Sumo Logic’s Beedgen claims that the line between machines and humans will continue to fade. The foundation of this is automation—leveraging technology to perform mundane or routine tasks and sift through mountains of data exponentially faster than a human can. As artificial intelligence evolves, though, the scope of what can be automated expands as well. “In automating processes, a human can today wield the power of a legion of operators with a single hand,” stated Beedgen. “Likewise, machine learning will increasingly be adopted for its usefulness in augmenting human understanding of complex interaction and large data sets by uncovering the unknown unknowns.”

    1. Automation and analytics will improve IT service health

    DevOps and microservices have transformed many areas of development and IT infrastructure, but many organizations still rely on decades-old monitoring tools, arcane metrics, and specialized admins dedicated to managing the cumbersome process. Splunk’s Fitz thinks that is getting ready to change. “In 2016, IT analytics will be liberated as easy-to-use dashboards will correlate all sources of service health—legacy tools, APIs, mobile apps, Web logs, wire data, containers and more—while predictive analytics will automatically respond to prevent quality issues.”

    1. DevOps is here to stay

    From the point of view of DevOps practitioners or companies that have adopted DevOps tools and practices, this may seem both painfully obvious, and yet still be good news as well. Christian Beedgen predicts not just that DevOps is here to stay, but that the importance of DevOps and the sphere of influence affected by DevOps will expand. “Increasingly, DevOps will permeate all manner of businesses that rely on information technology to compete. Bimodal IT (the practice of managing two separate, coherent modes of IT delivery) will become the equivalent to “private cloud”—the last forced resistance of the old guard. Both will be forgotten in a short number of years, as public cloud and lean and agile processes dominate the businesses that still compete.”

    There you have it. Now you can enjoy your holiday break in peace and come back in 2016 with an idea of what you have to look forward to in the year ahead.

  • DevOpsSec – Creating the Full Triangle

    DevOpsSec – Creating the Full Triangle

    Introduction

    As a discipline, DevOps emphasizes uniting development and IT operations teams through modernized culture, integrated tooling and processes in order to increase the frequency, quality and business alignment of software roll-outs. But while developers and IT Ops teams need to be in lockstep, security cannot be an afterthought.  Rather, DevOps teams need to adapt to include security as an integral part of the agile triangle.

    The challenge facing DevOps teams today however is that incorporating security into their day-to-day work is not always easy or intuitive. Security often runs one step behind or out of sync with lean DevOps teams. In addition, the besieged security professional or team often faces a never-ending barrage of breaches, designed by a large, amorphous and highly motivated hacker ecosystem and resulting in a continually escalating threat environment. In an effort to save time, agile developers may leverage existing code in rapid iterations and quickly deploy them to production through continuous delivery pipelines, without considering existing architectural defects or knowing its defect profile and potential for security vulnerabilities. This can expose organizations to huge risks if left unassessed and mitigated.

    Fortunately, “security at the speed of agile” is entirely possible, allowing organizations to bring new software products and services to the market, while staying in control. Here are some best practices for better aligning security with DevOps objectives, evolving beyond just DevOps to DevOpsSec:

    Shifting security “left” in the DevOps chain

    Like functional quality testing (making sure an application works as it’s supposed to), security testing needs to happen in the earliest possible stages of the development process. Traditionally, the application lifecycle has followed a sequential model – ideation, development, testing and finally, production. Functional testing used to occur only during the testing phase. But now, developers are taking on more responsibility, which helps prevent defective code from getting “baked in” further down the application lifecycle, where it becomes much more time-consuming and costly to undo. However, security is also an extremely important part of the quality equation, and if a security defect isn’t detected early on, a very unpleasant surprise is likely in store as the application gets closer to production. Building in and continuously integrating static code analysis and dynamic security testing into the Agile application lifecycle is a key success factor to delivering a high quality, secure application experience in production.

    Automating security testing, for both developers and testers

    In agile environments, DevOps teams are under constant time pressures. As noted above, developers are expected to develop more and more code, all while assuming greater responsibility for functional quality. Testers, too, are under increased pressure as more frequent application roll-outs mean more testing, in less time. For these reasons, if security testing is going to take place earlier on in the application lifecycle, basic security tests need to be automated. Since security threats are constantly evolving, this kind of automation will not completely rule out all security flaws in production. But it will allow developers and testers to spend more time on their core functions – namely development and functional testing – while lowering the attack surface, once an application does reach production.

    Leveraging Big Data analytics 

    Data generated from DevOps processes and operations, particularly related to automated security tests, often hold a wealth of insights which can be used to step up security validation efforts throughout the application development lifecycle. For example, what code types show the most vulnerabilities and therefore may need more rigorous testing? Which groups of developers are discovering the most security holes in automated tests – such that their development processes may need to be refined — and which groups may not be testing enough? How long are basic security tests taking on average, and how does this need to be factored into roll-out timelines? This type of data can help DevOps teams prioritize and optimize their security testing, and better reconcile security testing requirements with velocity and resources to hit anticipated delivery dates. Also, while using Big Data analytics in production will always be useful (particularly when it comes to detecting new security threats, and determining new automated testing needs), applying Big Data analytics earlier on, to DevOps pre-production data, can prevent more security flaws from making it into production in the first place.

    Fostering a shared vision and objectives

    To date, real progress has been made uniting developers and IT operations teams together in DevOps organizations. Traditional roles and responsibilities within DevOps teams continue to evolve and coalesce, and that’s a good thing. Developers are contributing to testing and taking more responsibility for overall quality. IT ops teams are thinking like developers, analyzing and feeding production data back to developers and testers so they can fine-tune and modify their offerings. Data flows left-to-right, and right-to-left are becoming more automatic and continuous.

    But increasingly, security professionals need to be included in this mix. Developers need to think with security considerations in mind – for instance, will a new feature they want to add to an application bring increased security risk, and if so, how can this risk be minimized? Conversely, security professionals need to think like IT ops teams; for example, making sure a new mobile app doesn’t potentially create a hole for hackers to penetrate back-end systems, and if a hack were to happen, how to contain it and minimize the impact. Only by capturing the right data, communicating and committing to working together can everyone in the DevOpsSec chain make the best, most well-rounded decisions that factor in all concerns, with business success being the top priority.

    Conclusion

    Often, DevOps teams may view security teams as potential logjams preventing them from doing what they want to do – deliver working software quickly to delight users and create competitive edge. But if security in the software supply chain is not addressed, the results may do the exact opposite, frustrating users, freezing business processes or worse, causing massive financial liability and loss of brand goodwill.

    Security is a key ingredient of application quality. By addressing security earlier in the development process; increasing security testing automation; leveraging Big Data analytics and incorporating security in the DevOps mission, organizations can achieve true DevOpsSec and deliver applications that are high-quality, through and through.

    About the Author/ Kelly Emo

    Kelly-Emo- Director-Lifecycle-and-Quality-HP.jpgProduct MarketingKelly Emo, Director, Lifecycle and Quality Product Marketing, HP, Kelly has been involved in all things IT for few decades, including engineering, product management, and product marketing across application development, SOA and middleware, enterprise architecture, IT operations, quality and testing. She now focuses on application lifecycle management, quality, agile development and DevOps. She has worked in other organizations at HP, BEA Software, and Jamcracker Inc .Kelly has a BS in Computer Science from Cal Poly, San Luis Obispo and an MBA from Santa Clara University.