Tag: big data analytics

  • Apache Druid’s Role in Modern Data Analytics

    Apache Druid’s Role in Modern Data Analytics

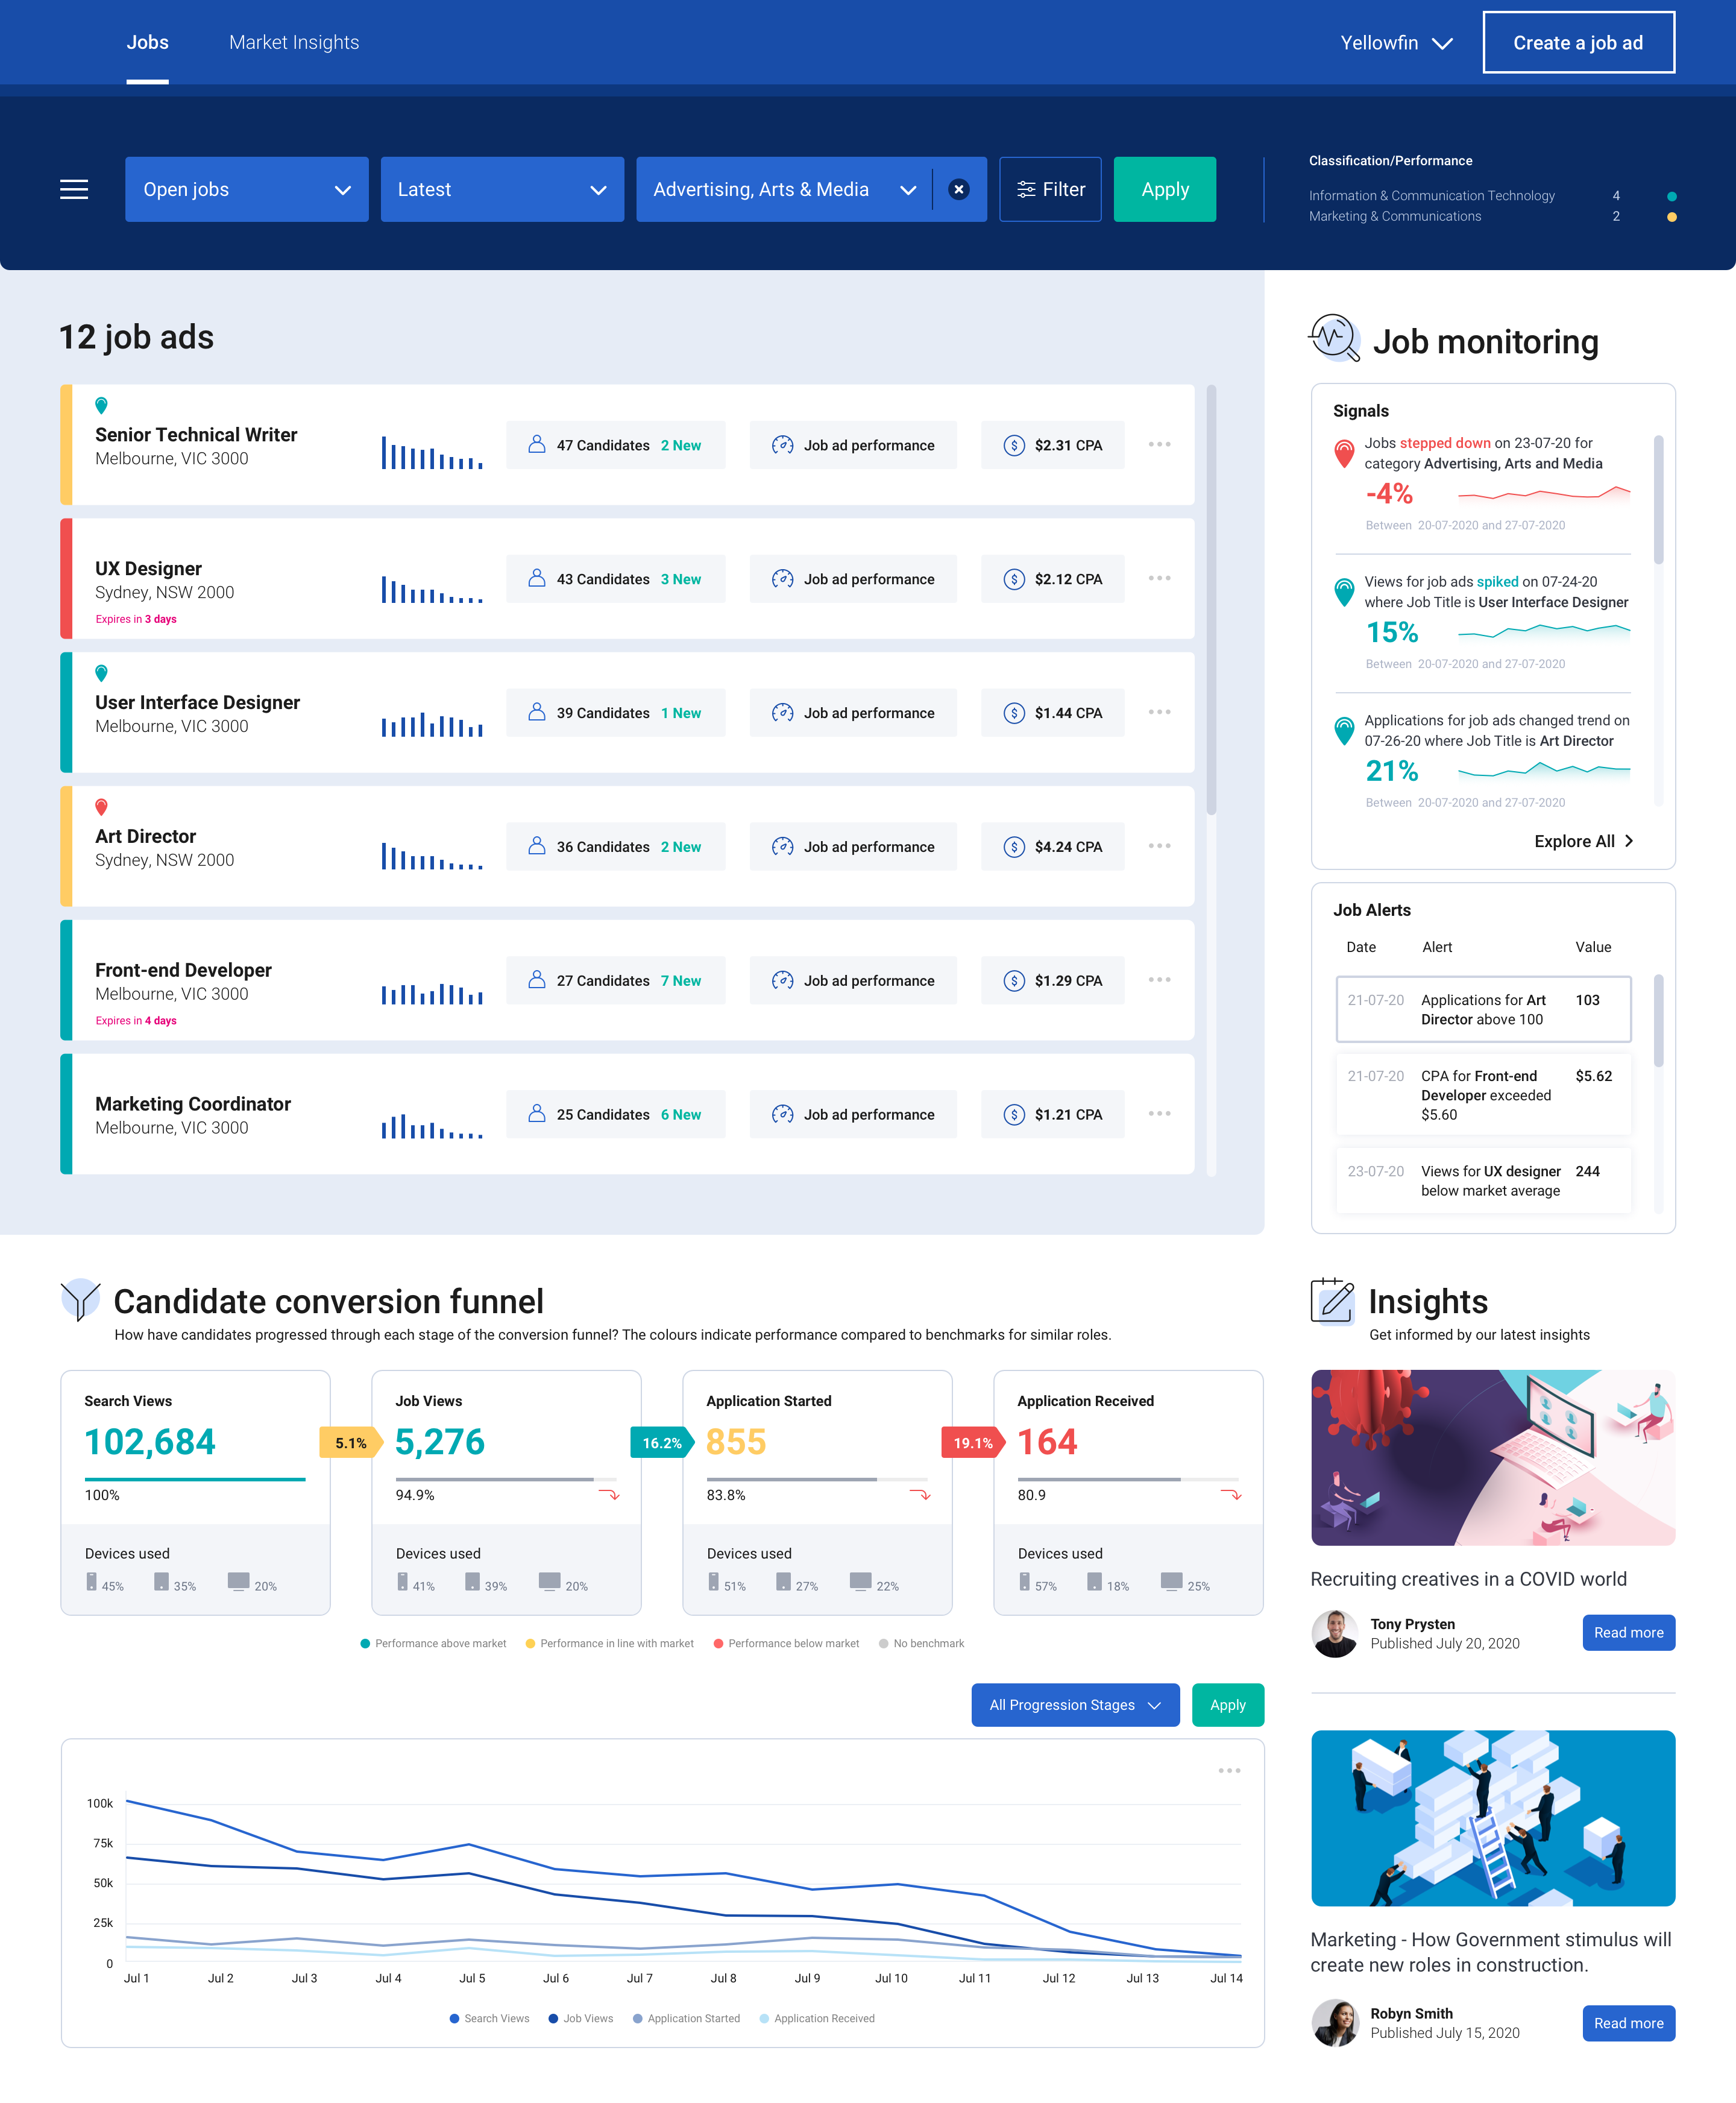
    From Twitter and Netflix to Salesforce and Confluent, modern analytics applications are being built by developers across the world’s leading digital businesses to create digital tools that serve real-time analytics to hundreds or even thousands of concurrent users.

    Looking more closely at what these apps do reveals some critical, strategic technology decision-making. In particular, why do developers increasingly turn to Apache Druid instead of the myriad of other databases out there?

    In general, they look to Druid to build apps that deliver on a range of objectives, including creating operational visibility at scale, customer-facing analytics, rapid-drill down exploration and real-time ML pipelines. Let’s take a look at each of these in turn:

    Operational Visibility at Scale

    Building apps for operational visibility can include a wide range of use cases, such as product analytics, digital operations, observability, fraud detection and IoT. In each situation, developers need to minimize the gap between events created and time-to-insight.

    From a technology standpoint, there are several databases that can analyze events in real-time, including stream processors like Apache Flink or ksqlDB, time-series databases like InfluxDB or TimeScaleDB and also key-value stores such as Redis. The problem is that all of these technologies share the same inherent limitation for analytics: They aren’t able to process OLAP-style queries effectively at any meaningful scale.

    For instance, if the app in question calls for analyzing time and non-time-based dimensions over the past month, assuming ingestion was one million events per second, that would equate to more than 2.6 trillion events. Any database that supports stream ingestion can query the current status (setting aside the challenge to handle ingestion at this scale) and, to an extent, basic aggregation of numbers and counters. Difficulties can arise, however, if the app requires aggregation across all of these events, “group by” on non-time-based attributes or high concurrency. Using the wrong database leaves users looking at the ‘spinning wheel of death’ as they wait for results.

    In these circumstances, devs turn to Apache Druid. A real-world example explains how: Salesforce engineers built an analytics app using Druid to monitor their product experience. The app enables engineers, product owners and customer service reps to query any combination of dimensions, filters and aggregations on real-time logs for performance analysis, trend analysis and troubleshooting. As a result, their query results are returned in seconds with billions or even trillions of streaming events ingested every day.

    Customer-Facing Analytics

    On the face of things, the technologies offered by Twitter, Forescout and Atlassian don’t have a huge amount in common. Look beneath the surface, however, and they all apply analytics to more than just internal decision-making. They have also created analytics apps and processes to provide their customers with powerful insights as part of a value-added service or a core product offering 

    What does that teach other organizations? When building analytics for external users, a whole different set of tech challenges must be addressed. While concurrency is clearly a key consideration, the database should also support current and future user growth with ease. The thing is, concurrency also has to be delivered economically, or it can have a huge impact on infrastructure costs.

    Similarly, delivering a good interactive experience is dependent on sub-second query response performance—it has become a minimum user requirement almost everywhere. Instead of fighting PostgreSQL or Hive or any other analytics database to meet the performance requirements at scale, Druid offers the performance devs and users expect.

    Take Confluent, for example, which is a popular event streaming platform. They built their cloud-based monitoring service, Confluent Health+, with Druid. Having initially used a different database, they discovered that, as their data volume grew, their legacy pipeline struggled to keep up with their data ingestion and query loads. By switching to Druid, they have been able to create the impressive user experience developers everywhere are focused on delivering.

    Rapid Drill-Down Exploration

    Generally speaking, the primary role of reports is to fulfill a simple requirement: Deliver data in a consumable form. What organizations are increasingly looking for, however, is a deeper level of insight and understanding that shows why something happened. They can take this information and apply it to a wide range of possibilities, such as solving, anticipating or preventing future problems or opportunities.

    Addressing these ‘why?’ questions means data has to be analyzed at tremendous speed to reveal root causes. While this is a simple proposition when the data set in question is small, when dealing with data drawn from today’s high-volume sources, such as cloud services, clicks and IoT/telemetry, the underlying database has to correlate a few to hundreds of dimensions across highly cardinal data with billions to trillions of rows. That presents a much more difficult challenge.

    Indeed, when data is analyzed at a huge scale, full table scans are simply too slow. Exacerbating the problem is the typical query-shaping techniques used to speed up performance have expensive tradeoffs:

    Looking at real-world use cases once again helps demonstrate the role of Apache Druid in situations such as these. For example, developers at cybersecurity company HUMAN built an analytics app for internet bot detection using Apache Druid. Previously, their cloud data warehouse was too slow to keep up with their need to drill into massive web traffic quickly. Today, their Apache-powered app gives their data scientists the ability to aggregate and filter across trillions of events instantly, meaning they can classify anomalies and train their machine learning models to detect real-time malicious activity.

    Real-Time ML Pipelines

    For many people, analytics is synonymous with viewing a synthesized data set presented via a UI like a chart, graph, report or dashboard. Increasingly, however, new operational workflows are completely automated without any human intervention or data visualization.  

    Google Maps is an example of this use case, given it optimizes routing based on real-time and historical traffic flow and patterns. Another example is Reddit’s use of Apache Druid to deliver real-time ad placement within milliseconds of a new visitor arriving on the app. In this context, there is no data visualization to interpret; it has been replaced by automated decisions derived by inference. These performance requirements play particularly well to the capabilities offered by Druid.

    Across a growing variety of demanding use cases, devs are adopting Druid to build inference-based capabilities into their apps. From diagnostics, recommendations and automated decisions, today’s organizations need instant query responses of high cardinality, alongside highly dimensional event data at scale and in real-time. Delivering performance levels like this is becoming increasingly important for businesses focused on innovation, quality of service and competitive advantage.

  • 5 Ways to Transform DataOps With Human-in-the-Loop Automation

    5 Ways to Transform DataOps With Human-in-the-Loop Automation

    We are in the middle of a data renaissance. Today, it’s not just about data instrumentation but also learning how to make DataOps a real business advantage for the entire organization. Data has become an inextricable part of products, used to enhance the quality of user experiences. Reliable access to data and the integrity of that data is imperative to drive innovation and business success.

    But just like any process, problems will arise. There will be pipelines that break or data that isn’t instrumented properly. The question then becomes, how can teams more quickly identify problems and continually improve? How can the journey toward data integrity become one of iteration and improvement?

    DataOps teams are by no means strangers to automation—automated CI/CD pipelines and infrastructure-as-code (IaC) are a huge part of their skill set. But there are some components of automation that are less pervasive throughout DataOps, ones that can help promote data integrity and encourage a culture of improvement. 

    It all starts with a different approach to automation—a human-in-the-loop (HITL) approach. Human-in-the-loop automation enables parts of a process to be fully automated while enabling humans to step in at critical points to take action, make decisions and decide the path forward.

    Here are five ways to use human-in-the-loop automation to drive continuous improvement and achieve optimal data integrity.

    Create Better, Earlier Interruption of Problems

    As is life, inevitably things break, issues arise and teams need to step in to remediate. The goal should be to enable better interruption of these problems when they do occur—identifying issues earlier and bringing the right stakeholders together more easily and swiftly.

    HITL automation can help teams not just identify issues earlier but kickstart the incident response and coordinate across teams and stakeholders. Ideally, automated workflows can be triggered from an incoming signal; for instance, from an observability tool like DataDog or BigPanda. An incident response could be started automatically, triggering further automation—like creating tickets, starting a Zoom meeting, creating a Slack channel and bringing together the right team members. 

    By instantly bringing the right people together, the team can investigate collaboratively and more quickly understand the state of the issue. HITL automation should then enable teams to run further scripts to take action and remediate as needed.

    Bake Improvement Into the Process Through Self-Documenting Workflow

    Many companies today are asking, “How do we make sure that we have that full integrated loop, down to the collection point?” Communication between teams is critical to this endeavor. But even before teams can collaborate on improvements, they need to understand the current state of their data so that if, for instance, a team finds that a report isn’t providing what’s needed, there’s a really clean way to get that communication back to the DataOps team to improve the instrumentation in the first place.

    HITL automation can bake improvement into DataOps workflows by automatically documenting every human and machine action throughout a process. Because it’s connected through APIs to all a team’s tools and services, a self-documenting workflow slurps up every action and creates an audit trail. This audit trail is the basis by which teams can more accurately understand not just the integrity of their data, but also how teams are implementing and running processes.

    Bring Human Data to the Forefront of Improvement

    DataOps teams play a big role in making sure the right data is being collected. However, a lot of people are still using systems that are very manual. They may have a good understanding of their log and monitoring data but still don’t have a good sense of the human data around their organization—what processes and workflows people are running.

    Understanding how humans run processes is just as important as understanding technology problems. The self-documenting workflow described above should include documentation of human data, from manually-run scripts to Slack or Teams conversations and, ideally, even auto-update tickets so even maintaining a system of record becomes less manual. Only by looking at the full picture—of human and machine data together—can teams find areas of improvement in their automation, communication and workflows.

    Take an Incremental Approach

    Don’t let “perfect” be the enemy of “done”. Every great transformation I’ve seen started with a small team, a great mandate, and strong support from the executive team. Adding tons of new technology and hiring more people may not be the silver bullet teams need.

    Instead, teams should look at the expertise they have in-house first—the people, technology and processes. Then, begin by taking an incremental approach. HITL promotes incremental, approachable automation by enabling teams to first codify institutional knowledge, analyze, learn and then begin to automate pieces in small batches.

    Diving head-first into a fully automated approach can leave teams in a worse state than nothing at all. Automation is a journey—we learn by doing, by recording human and machine data and then, using insights as our guide, begin to find real value in small doses of automation. These small steps can make a huge impact and, over time, add up to substantial business value.

    Buy for Industry Standards and Build for the Gaps

    As I mentioned above, teams should first start by evaluating their current resources. What skill sets and technology do they already have and how can they use those resources to achieve their data goals? At the same time, many teams starting their automation journey face challenges—lack of development resources, scripts that live on one person’s machine, difficulty bringing all the human and machine data together into a recorded timeline.

    To help data teams effectively and reliably implement HITL automation, investment into an off-the-shelf platform can help bridge the gaps teams and organizations have. Platforms should enable automation through low-code interfaces while providing code-level customization. This combination enables teams to buy for industry standards while building for the gaps—not managing the platform means development resources can be focused on expanding and improving automation.

    Platforms should enable teams to easily connect to APIs and adapt to custom APIs. The continuous change of DevOps processes and tooling coexist with rapidly changing APIs. Therefore, the most promising automation platforms must manage the complexity of APIs, enabling users to focus on the intent, not the mechanics of custom APIs. Automation technologies should seamlessly handle identity, authentication, pagination and caching. 

    Find Leverage With HITL Automation and Drive Business Impact

    As data becomes increasingly ingrained in product life cycles and user experience, automation holds the key to faster innovation, product quality and enhanced reliability. Creating a culture of continuous improvement and implementing technology like HITL automation that promotes data integrity throughout the product life cycle is where I’ve seen the greatest leverage for organizations. 


    To hear more about cloud-native topics, join the Cloud Native Computing Foundation and the cloud-native community at KubeCon+CloudNativeCon North America 2022 – October 24-28, 2022.

  • Dynatrace Adds Grail Data Lakehouse to Observability Platform

    Dynatrace Adds Grail Data Lakehouse to Observability Platform

    Dynatrace today announced it has added a data lakehouse, dubbed Grail, to the Dynatrace Software Intelligence Platform to make it simpler to aggregate all the observability data an IT team collects.

    Bob Wambach, vice president of product marketing for Dynatrace, said Grail will initially drive analytics of log data but in time will also be applied to additional types of application development, security and business intelligence data.

    The goal is to streamline processes such as data indexing and rehydration across a unified observability platform that eliminates the need to maintain multiple disparate repositories, he added.

    Grail, at its core, is a causational data lakehouse based on a massively parallel processing (MPP) analytics engine that will initially be made available on the Amazon Web Services (AWS) cloud. IT teams can use the Dynatrace Query Language (DQL) to query data stored in the data lakehouse. Additionally, the Davis artificial intelligence (AI) engine that is already embedded within the Dynatrace Software Intelligence Platform will be able to apply machine learning algorithms to the data stored in Grail.

    Data lakehouses have recently emerged as an approach to enable organizations to apply the structure of a data warehouse platform to massive amounts of data that previously would have been stored in a data lake. In effect, a data lakehouse combines the attributes of both types of platforms for centralizing the management of data. One of the biggest issues with any approach to observability is the massive amount of data that winds up being stored to allow DevOps teams to track issues over time.

    Of course, it’s up to each individual IT team to determine how much data they want to save to drive analytics, but the more data they save the more cloud storage costs will naturally increase. Grail provides a purpose-built means of consolidating data silos in a way that reduces the total cost of observability, noted Wambach.

    In general, because of the need to embed a data lakehouse capability, most observability platforms will be consumed as a software-as-a-service (SaaS) application. That means the number of IT teams that will likely build and maintain their own observability platform will be limited. IT teams are also now struggling to manage increasingly complex IT environments made up of both cloud-native applications built using microservices and legacy monolithic applications. In fact, a global survey of 1,303 CIOs and senior IT practitioners commissioned by Dynatrace found 71% of respondents believed the explosion of data produced by cloud-native technology stacks is beyond the ability of IT staffs to manage without help from an AI platform.

    It’s not clear how quickly IT teams will be migrating from legacy monitoring tools that are designed to track specific metrics to observability platforms that promise to make it easier to identify the root cause of an issue by simplifying the launch of queries against a massive pool of data. However, as organizations continue to become more dependent on software, it’s apparent that the level of tolerance for any kind of disruption is steadily declining; it’s now more a question of when rather than if a different approach to managing IT will be required.

  • The Advent of Intelligent Software Engineering 

    The Advent of Intelligent Software Engineering 

    Today, to maintain competitiveness, every company needs to behave like a software company and deliver new solutions with high velocity, quality and reliability. New features need to be introduced at a rapid pace, but with high-quality expectations. At the same time, deployment releases and operations are getting complex, debugging and traceability in production are increasingly difficult, security is more prominent, uptime and reliability needs have scaled up dramatically … the list goes on.

    In short, traditional software engineering is changing radically.  Some trends causing this disruption include:

    • Cloud is eating software. And that has not only changed the infrastructure where software is hosted but also how applications are architected, developed, packaged and deployed. Cloud is driving the adoption of cloud-native technologies; serverless components and containerization have changed how we build applications. The hard line between development and infrastructure team is getting fuzzy. 
    • Cybersecurity is now a boardroom concern. Rising cyberattacks and malware threats have left everyone vulnerable. Traditionally, software was released every few months, leaving enough time for security testing by specialists. Today, with the advent of very rapid release cycles, security checks need to start early in the development process.
    • AI/ML is the new electricity but is causing shocks. AI/ML-powered use cases are finding their way across platforms, and across industries. Traditional software engineers are not familiar with AI/ML and ML developers are not familiar with engineering disciplines and best practices, leaving a big divide in engineering maturity.
    • When one company raises the bar, others are expected to follow. Consumer expectations are constantly changing. They expect the same experience that they get from Amazon, Uber and Google from every application. It is expected that you provide a seamless, frictionless experience that your platform is available anytime, on any device and that it is fast and secure. 
    • APIs are fueling innovation: Innovation at speed and scale is not easy, but APIs can enable exactly that by tapping into the collective power of the crowd. Today, any developer can use platform-provided APIs to build a new, innovative solution. An API-first mindset is emerging, and the app store model (e.g., Apple App Store, Salesforce AppExchange, AWS Marketplace) has changed how we think of innovation and creating new platform extensions. 
    • Low-code/no-code platforms are quickly evolving, making it easy to develop small, situational applications without writing any code. Citizen developers are emerging. 
    • Modern architecture paradigms drive new ways of working. Modern platform architecture has evolved significantly in recent years from monolithic applications to SOA to microservices- and API-based distributed platforms. Event-driven architectures have gained prominence. Streaming architecture has become increasingly popular to support massive scalability. This has a significant impact on how engineering teams are organized and how they build, test, deploy and manage new platforms. 
    • Legacy platforms are slowing down growth. Legacy applications built 20+ years ago needs to be modernized for today’s context. Modernization is a massive exercise depending on the age, technology and the size of the application. But modernization is easier said than done. The legacy and the new worlds need to coexist for a while and need a bridge strategy from both a technology and cultural perspective.

    To meet these changing demands, engineering needs to become a lot more intelligent.  

    The Advent of Intelligent Engineering

    We can bring intelligence to engineering by using more data to manage projects, leverage AI/ML analytics to bring improve engineering productivity and predictability, leverage more automation and apply the right process to the right problem. 

    Data-driven Decision-Making in Engineering 

    Engineering teams use numerous tools in the development environment for code repository, bug tracking, code scanning, build, test, deploy, etc. Popular tools include Azure DevOps, GitHub, Atlassian and Jenkins, among others. These tools generate lot of granular data. All these data silos can be aggregated and used to track interesting metrics around:

    • Developer productivity: How much time is spent on writing how much code versus other activity; story points delivered versus committed
    • Software quality: Number of bugs generated; rate at which bugs are being fixed; number of bugs that slip into production 

    Additionally, on top of this data, one can build an intelligence layer using machine learning to draw hidden insights, highlight co-relations and conduct better root cause analysis. These insights can bring greater predictability to engineering outcomes. For example, whether or not developers can meet a release schedule, the level of quality, etc.

    Data provides evidence of how your teams are performing. It helps in removing potential roadblocks and enables better communication with all stakeholders. It can be used to better manage project performance and be leveraged for objective decision-making. Despite the availability of this data, engineering leaders are still operating in the dark. Decisions are made based on intuition and gut feel rather than on hard data. It’s time to become more intelligent by using data in project performance tracking and decision-making. 

    Elevate Productivity and Predictability of Engineering Services With AI

    AI/ML is disrupting every industry and is now finding its way into software engineering. AI/ML-enabled developer tools are emerging that can be leveraged across the software engineering life cycle. These tools can not only save time for repetitive activities but also improve software quality in large and complex tasks. 

    AI/ML-enabled tools can enhance a developer’s daily life from coding to testing. Today, AI-powered tools can scan and analyze code to provide intelligent code completion suggestions, flag any deviation from coding best practices (naming convention compliance, variable misuse, etc.), perform peer review, convert code from one language to another, find security vulnerabilities, etc. Dynamic application security testing (DAST) solutions use AI to discover potential attack vectors in milliseconds which would otherwise take a few days. AI/ML can help auto-generate HTML code from hand-drawn UI sketches. AI/ML also can help developers automatically generate unit tests from existing code and provide suggestions about improving tests.  

    In fact, testing is the biggest category that can benefit from AI/ML-based intelligence, specifically in large complex applications. QA teams who rely on manual testing are not able to keep pace with the rate at which code changes and releases are done today. AI/ML-enabled tools can help testing teams in a number of specific ways. 

    • Change impact analysis: AI/ML can help with coverage analysis and identify which tests need to run based on what has changed in the application.
    • Test creation: AI/ML can help test teams create test cases from plain English descriptions and can also learn how to improve tests over time; AI/M also can automatically heal broken tests. AI-powered tools can automatically convert manual UI tests to API tests.
    • Visual testing: AI-powered image comparison technology can enable visual testing to analyze the UI screen differences detected across tests. 
    • Test analysis: AI can analyze test cases and defect metrics to increase test coverage while reducing the number of tests.

    It’s time to become more intelligent by using AI-powered tools to augment engineering teams, improve their productivity and bring predictability. 

    Intelligent Automation: Beyond Development Processes

    Today, there are a lot of automation options in the software development life cycle. DevOps enables automation of build, test and deployment of new versions of your software. You can also automate other activities such as test automation, code scanning, performance test, etc. DevSecOps enables automation of security processes (e.g., code scanning for vulnerabilities) into the engineering life cycle. AI/ML-powered tools can further drive automation improvements (e.g., improve flow in your CI/CD pipelines.) Overall, automation enables higher team productivity and results in the rapid or on-demand release cycles required for business agility.  

    Automation is not just limited to development activities, it also applies to other parts of the engineering life cycle, for example:

    • Infrastructure-as-code (IaC) tools can automatically provision and configure cloud infrastructure environments (storage, network, etc.).
    • Monitoring tools can automate monitoring for availability, production load metrics and security problems and generate alerts. 
    • Log management: The number of logs generated in today’s ecosystem is vast and it is impractical to collect them manually. Log management tools can automatically aggregate and analyze information from logs.

    Leveraging automation aggressively and using it throughout the engineering life cycle can make software engineering much more intelligent. You should be automating repetitive tasks and low-value processes and use the saved time for higher-value activities.

    Making Agile Smarter

    There are several popular software engineering methodologies available such as Agile, Scaled Agile, the Spotify model and more. Regardless of the methodology or process you use, intelligent application of the right methods and tools to the right problems can make them more effective, efficient and intelligent. For example, traditional Agile processes were originally designed in the manufacturing space and were then adapted to develop mature software. But in today’s fast-changing market, development teams need to rapidly and continuously try new ideas either to demonstrate new business features or for technical validation of emerging technology. This is true not only in the early stages of new product development but also on existing platforms where you need to keep pace with changing market dynamics. Be ready to experiment.

    We need to get smarter about selecting the right process and tailoring it to your needs rather than let the process dictate your outcome.

    If Software is Eating the World, Complexity is Eating Software

    While product engineering has been around for a long time, modern software engineering is a lot more complex than just writing code and following Agile processes. Intelligent engineering practices can get solutions to market faster with better quality and reliability and gain more time for innovation to keep up with today’s speed of business.

  • Turbocharge Enterprise Apps With Contextual Analytics

    Turbocharge Enterprise Apps With Contextual Analytics

    Software product managers and developers typically treat analytics as a standalone capability—something to be integrated into their application’s dashboard or reporting module. As a product feature, analytics is undoubtedly a valuable tool. But offering it merely as a tacked-on function is an approach that lags behind where your users are today.

    When data analytics is limited to dashboards, users must switch away from their transactional environment whenever they need to interrogate data or derive insight. This disrupts workflows and interrupts trains of thought, creating friction for the user. Moreover, a standalone analytics capability doesn’t provide context or guided analysis. Users must look for anomalies or trends manually. As a result they’re less likely to dive into analytics to support good business decision making.

    Contextual analytics, on the other hand, gives users a powerful tool right at the point of their daily work. Contextual analytics is defined as any analytics solution that is integrated directly into an application’s core workflows. This approach delivers the benefits of analytics in the situational framework where decisions must be made.

    Embedding analytics in this fashion creates significant value for the user. Charts, tables and metrics sit side-by-side on the screen, alongside the application’s central functions. With one click, the user gains instant, guided and dynamic insight.

    Such an improvement is helpful for all kinds of business activity. Retail store managers can instantly access demand forecasts while creating weekly work schedules. Inventory managers can view trends and analyze stock without leaving their ordering screen. Supply chain, finance, logistics, sales and marketing, manufacturing—any process involving routine data processing can profit from contextual analytics.

    A Rich Workflow Asset

    When embedded into transactional workflows, contextual analytics can deliver two forms of understanding. The first comes from predefined visualizations, ranging from simple KPI numbers to line and bar charts and even contextual dashboards. These visualizations are presented based on user action; a customer’s purchase history, for example, can pop up in chart format while viewing the account record, enabling the user to make decisions about sales incentives or priorities for service.

    Second are dynamic analyses and alerts. These indicate that either thresholds have been crossed or anomalies in a record have been discovered, prompting the user to explore and take further action. Pop-up alerts can be invaluable in sales, production, finance or many other disciplines.

    For both predefined and dynamic contextual analytics, outcomes can be based on simple aggregations of transactional data or as the result of sophisticated data science modeling (e.g., propensity to purchase). Specific outcomes can be set by either the product manager or the user to maximize utility.

    Contextual analysis is ideal for supporting or triggering actions according to any business need. The capability enhances transactional workflows by providing metrics pertaining to a particular transaction; it will also trigger a new workflow via an alert or suggestion for action, based on the output of a data science model.

    contextual analytics

    Of course, none of this means that dashboard-based analytics aren’t still important. Users will always need to conduct broad data analysis. Dashboards and/or report analytics allow users to monitor overall business performance, drilling down when necessary into the details behind the numbers.

    With the secondary addition of contextual analytics, however, users can be continually guided in their decision making as they work. They receive a constant flow of deeper insight, supporting management tasks intuitively at a granular level.

    Deployment Framework for Developers

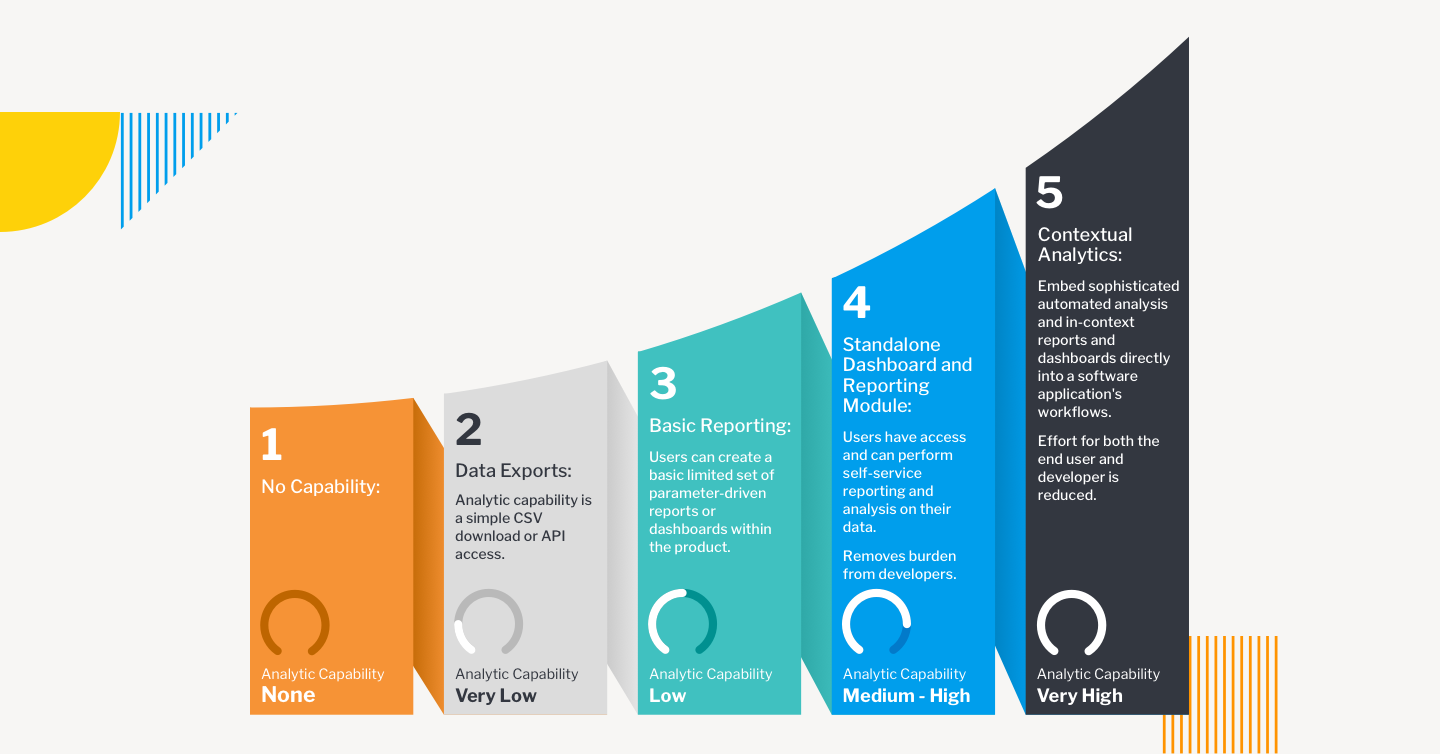
    Embedding transactional analytics into enterprise applications can be directed according to a maturity model. There are five possible stages of product development:

    • Stage One: No Capability. The main engineering focus is on bringing a new application to market. Minimal Viable Product (MVP) attributes lead development, and reporting capabilities are rarely included.
    • Stage Two: Data Exports. Analytics are provided based on customer feedback, but only through a CSV download or API access that allows the end user to analyze data in their preferred tool. The burden of building analyses rests with the customer.
    • Stage Three: Basic Reporting. A limited set of reports are supported by analytics, and in-house developers are tasked with creating the capability, often to the detriment of new features for the core product.
    • Stage Four: Standalone Dashboard and Reporting Module. This is often the end journey for most enterprise applications. Self-service reporting and analysis are available via out-of-the-box dashboards and reports.
    • Stage Five: Contextual Analytics. Sophisticated, automated analysis is available as part of the application’s core workflows, as well as at the dashboard. Users are guided to optimal decision-making at both the transactional and reporting level.

    These stages are not mutually exclusive. Especially for stages four and five they can be additive, so that end users will have a variety of mechanisms to access the data they need, at the time they need it.

    contextual analytics

    Accelerating Implementation

    Elevating the end user analytics experience is easier to achieve than it once was, thanks to BI vendors that specialize in embedded and contextual analytics built on an open platform. The best vendors are able to adapt quickly and easily to product development roadmaps, aligning features to meet specific needs and following up with administrative tools and automation processed to support the lowest possible cost of ownership.

    Working with an analytics vendor means development teams will have maximum support from prototype and design to integration, deployment and subsequent iteration. Options for Windows and Linux, on-premises or cloud will ensure the versatility, security and scalability required for highly marketable offerings.

    How Customers View Analytics

    As a product feature, analytics can often be dismissed as an afterthought—but your users don’t see it that way. BI analytics is increasingly seen as critical to business governance. Users want to glean as much insight as possible from the data they’re collecting—and on multiple levels. This means your users want to get more from your product, even in ways they haven’t yet imagined. Contextual analytics can provide that enhanced appeal for your application, putting your product out in front at a time when enterprise applications are more essential—and more competitive—than ever before.

  • Visualization Shines a Light on IT Metrics

    Visualization Shines a Light on IT Metrics

    Modern IT departments operate in a pressure cooker. Their highly distributed infrastructures are spread across legacy data centers and hybrid and multiple public clouds. Now, the Internet of Things (IoT) and the edge are part of the mix.

    Massive amounts of data are flowing through these multifaceted environments, and it falls on IT to make sense of it all, ensuring that issues don’t become problems and that it’s viable to produce measurable outcomes for the business. Dashboards are instrumental for visualizing and quickly making sense of that data.

    Metrics – numeric representations of data measured over time – give IT operators and site reliability engineers (SREs) a window into how a system has historically behaved. That data provides insights as to how the system(s) should perform in the future, and aids investigations when something goes awry. IT monitoring tools act as giant data lakes, holding time series data, while dashboards give everyone from IT administrators to C-level executives ways to easily digest the data.

    The visualization market is evolving. We’re seeing different kinds of databases, such as Prometheus, which bring with them new tools to leverage the data. Prometheus (PromQL) is growing in popularity in the DevOps space and becoming the standard for monitoring containers and microservices because it makes it easier to manage time series data. PromQL also comes with client libraries that include four core metric types:

    • Counter: Represents a single monotonically increasing counter where the value can only increase or be reset to zero on restart.
    • Gauge: Represents a single numerical value that can arbitrarily go up and down, such as CPU utilization.
    • Histogram: Samples observations and counts them in configurable buckets. It also can provide a sum of all observed values.
    • Summary: Samples observations and provides a total count of observations and a sum of all observed values. Configurable quantiles are calculated over a sliding time window.

    Selecting Visualization Charts

    Selecting the appropriate visualization dashboard for each user is important to maximize the value of the data. There are traditional line and bar charts, single value tiles – which display a single data point at a specific point in time – and lists and gauges, which offer a single value at a specific point in time in a series.

    Newer visualization types are now becoming common to address the various use cases in ITOps and DevOps. Let’s walk through a few:

    1. Honeycombs offer big-picture views of IT infrastructure, yet also display detail. The hexagonal display mirrors those in a honeycomb, and helps DevOps pros slice and dice the data based on attributes or tags. Each hexagon represents a specific host or resource, and can be organized in logical groups of elements. The colors change when thresholds are reached, and the hexagons can be sized differently based on the value of the metric. Consider a case of many AWS EC2 instances scattered across the globe. Each hexagon can represent an individual instance, and they can be grouped based on the “region” attribute. This honeycomb chart would let administrators see how each infrastructure site is performing.
    2. Gauge metrics use a language like PromQL to set a ceiling and a floor. If the user creates alert conditions based on particular thresholds, the dashboard will indicate if a certain resource has reached its threshold by changing the color. A gauge that turns red may indicate a critical problem, for example. Managed service providers have SLAs with clients to maintain uptime. If a problem arises, a red indicator on a gauge tile lets the IT administrator know immediately that the SLA agreement has been breached, and that an issue needs to be addressed.
    3. Heatmaps provide a graphical representation of the volume of data points within bucketed ranges. The color of each cell of a heatmap directly reflects the density of certain metric value ranges. Heatmaps are used to display group trends and spot outliers, which make them useful when viewing metrics with a wide distribution of values.

    Role-Based Requirements

    Picking the right chart depends in part upon the people viewing the data. CXOs, IT managers, sysadmins, SREs, network engineers and network operations center (NOC) operators will have different, yet overlapping, requirements.

    For instance, SREs want to ensure the reliability and resiliency of the infrastructure, so, through their dashboards, they look at everything from availability and latency to performance, efficiency and capacity planning. They can quickly spot outliers like server downtimes or memory issues and immediately begin to troubleshoot.

    CXOs, conversely, don’t need to get into the weeds of infrastructure operations. They use dashboards to gain a macro view of metrics for performance over time across websites and networks. They need to understand the correlation between IT metrics and business services and applications. Dashboards should be able to connect those dots.

    Other Considerations

    Finding the right visualization option is important. Once that is done, there are some other steps to take to ensure you get the insights you need from your dashboard:

    Positioning and ordering: Dashboard tiles should be placed in a logical order, with important high-level statistics near the top and the deeper, and more granular metrics progressively moving to the bottom to give users a quick understanding of system performance.

    Design: A well-designed dashboard with consideration paid to color schemes and themes also will make it easier for stakeholders to digest and understand the data.

    IT infrastructure performance is crucial to the health of a company. Massive amounts of data streaming out of systems can help IT administrators and others keep up-to-date about that performance and the overall end-user experience. Dashboards offer flexible ways to quickly view and understand the metrics; IT organizations now have a growing range of charts to choose from that can present the data they need in a way that works best for them.

  • An Analytics Workload is a Critical Data Management Tool

    An Analytics Workload is a Critical Data Management Tool

    From an organizational perspective, an analytics workload is a way to gain a data-driven business advantage. Analytics workloads can serve a primary objective that translates to an actionable business impact (such as analyzing A/B testing results, understanding user retention or finding anomalies in a flow, for instance) or can serve in a supporting role for analysis (such as improving dataset quality, preparing a dataset for user consumption or adhering to a data-related regulation).

    Ideally, a workload should have a measurable ROI and should be monitored on key performance metrics such as business impact, time to deliver, cost of execution and total spend versus allocated budget. Managing workloads this way is extremely challenging for data teams. In reality, the impact of big data analytics projects – and the effort and resources spent on them – tends to be unpredictable.

    You can place workloads on a spectrum: on one end, you have workloads that are very close to their business consumers. On the other end, you have workloads that serve auxiliary and support purposes. The latter are the hardest to track, budget and measure their return on investment (ROI).

    Query vs. Workload

    When data platform teams are tasked with evaluating and implementing the infrastructure needed for an analytics workload, they tend to look at it from a technical requirements perspective. An analytics workload is a set of queries that read and write datasets; it consumes compute, storage and memory resources and has an expected level of availability, robustness and performance.

    One traditional approach for improving cost and user experience in a workload is to focus on specific queries – identifying the slow, heavy and expensive ones and optimizing them one by one. While many single queries can be made better (faster, cheaper) by rewriting and optimizing, this approach often misses the big picture, leaving money on the table.

    Knowing Which Queries to Focus On

    Stripped of workload context, queries can only be evaluated on cost or response time. But business-critical queries may not be the most expensive, nor the slowest ones. Having the full view of the workload allows for prioritizing efforts much more effectively.

    Behavior Fluctuations

    The most important query on Mondays is probably very different from the most important query on Fridays, so the effectiveness of optimizing one or both queries may be small. The workload perspective enables you to identify patterns and leverage insights for effective optimization.

    Cloud Elasticity

    Unlike legacy data platforms, the cloud enables a brute-force approach to solving performance problems by adding elastic resources on demand. While this approach can work to improve a specific query, cost quickly gets out of control when applied to all queries. Understanding the workload is key to distinguishing when a brute force solution is right, and when you need to spend the time to build a different data flow.

    Cloud Decoupling

    In legacy IT environments, where queries were competing for a limited pool of resources, optimizing a single query had significant impact. But in cloud environments where resources scale elastically, queries compete with each other on a much smaller scale, if at all. Therefore, optimizing single queries has very little impact on the overall performance of workloads.

    Measuring Performance by Looking at the Median

    The heaviest or slowest queries are in the top percentile of queries. When trying to improve the overall user experience, the median performance can matter more, but it is indirectly affected when handling the extremes, so it tends to be less effective.

    The Long Tail

    In many workloads, a few highly visible queries can paint a misleading picture. It is common to have less than ten queries responsible for 20% of the load, and thousands of undistinguished “simple” queries responsible for 80%. Therefore, when data teams are trying to reduce cost, focusing on the most expensive queries may draw attention away from lower-hanging and easier optimization opportunities in “simple” queries.

    “Big Picture” Optimization

    Actions that improve a query (such as changing the layout of a dataset) may result in unintended consequences to other queries. Only a workload perspective can help evaluate the wider impact across other queries.

    The Cluster Approach to Optimizing Big Data Analytics

    Another traditional approach to optimizing data platforms is analyzing behavior from the cluster perspective. Most data platforms offer decent cluster monitoring of technical metrics, such as CPU load and RAM usage.

    But, focusing on cluster-based KPIs will draw attention away from the elements that have the highest impact. Understanding the workload entails understanding the business logic of queries: repeating query patterns, hidden dependencies, failure modes.

    Looking at this from a cluster perspective limits you to technical parameters, such as CPU usage. Without understanding the workload, data teams will miss issues such as a repeating calculation (to be made into an ETL flow) or an inconsistent calculation flow (like having different ways to compute the same business KPI).

    In environments where clusters are shared between different workloads, data teams often encounter additional challenges:

    Workloads Have a Business Context, Clusters Don’t

    From a cluster perspective, there is no inherent prioritization between queries, and data teams find it difficult to focus only on business-critical workloads. The outcome is often reverting to focusing on specific queries, which doesn’t offer an effective solution.

    Workloads Have Different Needs

    Take, for example, an ETL workload which may require a large amount of RAM, run hours and which must be finished by 7 am. An interactive data product workload may be composed of thousands of queries that each must return in under 2 seconds. Analyzing the cluster as one unit can lead to suboptimal behaviour of both workloads. While this example can be considered simple to detect, many workloads that seem similar can have widely divergent needs.

    As data lakes gain momentum as production-grade, big data analytics architecture, data teams need to shift attention from optimizing queries to measuring, analyzing and optimizing workloads. In the early days of big data, data warehouses were isolated data platforms tasked to deliver insights for a very specific set of business questions. But as the cloud rapidly evolved, the mere migration of data warehouses to the cloud is not enough. The next stage is moving production workloads to the data lake.

    Storage is so much cheaper, and organizations want to run queries on any dataset, whenever they need it. It’s this heterogeneous collection of many different queries that requires workload-level visibility to ensure each workload can truly meet performance and budget requirements.

  • DataOps: DevOps Plus Big Data

    DataOps: DevOps Plus Big Data

    In traditional DevOps, there are the complimentary forms of development operations (that I call DEVops), and development operations (that I like to call devOPS). Between them they automate the toolchain and bring the people working on getting an application out to users onto the same team—not necessarily the same organizational team, but using their strengths in tandem to meet the needs of the business.

    DataOps is an interesting extension of DevOps. You still need all of the coding side to get data into the system and queries consistently maintained. You still need all of the operations side to get your database/noSQL/whatever up and running. In fact, while the development side in a DataOps environment might be (but isn’t necessarily) lighter, the operations side is almost always more complex. No matter the big data engine in use, it is a complex system in addition to other supported systems in a normal environment. My first installation of a big data environment (Cloudera, as it happens) was a weeks-long learning voyage. Only after I’d completed it did I use an automation tool (which is no longer available) to make it easy. My second round was hours … But it assumed the knowledge I had gained in the first attempt.

    The other bit of DevOps—ongoing monitoring and management—is also more complex in a big data environment, but we’ll come back to that in a moment.

    Once the normal DevOps systems are in place, ETL/data import tools will need to be supported also. The volume that these tools crunch through in a day makes their inclusion in DevOps in a data-heavy environment critical. If the data uptake is slow or the data itself inaccurate, there is an impact on the organization. This step also requires inclusion of data scientists, people who traditionally have not been pulled into the DevOps model. But they are the ones that can gauge the accuracy of data, and normally are responsible for data acquisition anyway.

    Which brings us to the monitoring and management stage of DataOps. Normally when we talk monitoring and management in DevOps, we are talking about tools that ultimately help with things like availability, responsiveness, auto-scaling and recovery. DataOps needs all of these things, like any other application does. And we’ve already mentioned that it has a complex environment embedded in your complex environment. But it also (some would argue more importantly) needs data monitoring. A knowledge of the state of the data is imperative. Whether from a piece of code gone wrong or data poisoning, monitoring the health of big data archives is essential to keep results from getting out of whack. This monitoring will again involve the people who know the data—data scientists by whatever title. This iterative process will need to run relatively constantly, checking on whatever makes the data valuable, normally using cross-field checks to verify that data hasn’t somehow been corrupted, or comparing trending averages to current average to monitor for sudden swings in results.

    Of course, for a system (and in research there are many) that spins up, finds results and spins down, the monitoring part is less essential, but for anything that keeps accessing and adding to the data pool, it is the key to a healthy application or application portfolio based upon the dataset.

    If all that sounds a bit intimidating, you’re not alone. The phrase “DataOps” has been around for a few years, and while data scientists use it, it hasn’t yet gained serious traction in the enterprise. Here’s how I would approach it as CIO: Given that DevOps is running on other projects, that is the low-hanging fruit. Given the rate of change for servers (as queries—particularly long-running ones—increase and decrease, systems needs change is one example), traditional DevOps is a greater benefit to big data than many other corporate systems. So roll out DevOps first without serious concern for DataOps beyond how DevOps impacts ETL—not ETL data quality, but ETL data availability/performance. Only when the system and the team are in place and the software/hardware/code part of the overall system is fully in a DevOps environment, start looking at ways to move data into it. Data monitoring will be the big one, but ETL under the initial round of DevOps implementation will have shown places it could be improved and ETL data integrity can be added, so improving those areas also. A measured, step-by-step approach that builds off of organizational experience is key here. Data monitoring and management will require different tools than normal DevOps monitoring and management, so having the data scientists look into available toolsets and how they mesh with existing tools early on will help with eventual implementation.

    Make no mistake, it is a big job, moving large data driven environments to DevOps. But the benefits are increased awareness of data quality and data quality issues, along with more responsive systems and teams that DevOps offers every business application. The amount of data available to any give organization is currently on a massive increase as IoT, open datasets, partnerships and ML drive greater pools. It is worth getting the automation and cooperation of DataOps into the mix as early as possible.

    — Don Macvittie

  • Digital Transformation Strategy? Think Cloud

    Digital Transformation Strategy? Think Cloud

    A few years back companies used innovation and digital transformation mostly to differentiate themselves and to stay competitive. The drastic growth in digital and cloud computing over the last couple of years have changed this mindset.

    Today, organizations have to be innovative and leverage the latest technologies just to sustain and stay in business. Enterprises that implement online retail business, online banking and several other online services aren’t considering those channels simply as another route to increase their revenue—they have realized that online services are fast becoming their primary revenue channel. According to Forrester’s Report, “The Digital Business Imperative,” data analyzed just for three months showed that 84 percent of U.S. banking customers had used online banking for their transactions and 43 percent of the customers had used a mobile phone for these activities.

    Organizations are working at a very fast pace reviewing and analyzing their processes to seize opportunities for digital transformation. It is important to understand that to realize digital transformation, companies may need to completely re-engineer their current processes to make use of technologies such as the internet of things (IoT), big data analytics and artificial intelligence instead of doing patchwork on existing processes to adapt to digital technologies. It is also important for senior IT executives to consider digital initiatives in tandem with their cloud strategy instead of treating them in isolation. There is absolutely no doubt that the scale, speed and massive infrastructure requirements such as compute power, storage and other associated platforms to support these technologies are best provided by the cloud. The question to ask is, “Are we going to develop and host the infrastructure we need to support digital, or are we going to leverage the constantly improving robust infrastructure and services that cloud providers are offering?”

    Organizations that plan for massive growth and transformation are usually the ones that invest considerably in technology to support innovative ideas. Advancements in the digital space help fuel innovation, but without a solid cloud strategy accompanied by agile development processes, ideas are likely to remain simply as ideas on paper and will take forever to get materialized into products or solutions that provide value. In today’s context, digital and cloud are almost inseparable due to the robust infrastructure, services and tools available on the cloud to support digital initiatives. All leading cloud providers offer competing solutions and services to help organizations move forward with their digital initiatives at a rapid pace.

    In my previous article, “Transforming with the Cloud: If Not Now, When?” I touched upon some of the key areas that organizations should be considering with regards to transforming their businesses with the cloud. I have attempted to structure this article in a similar fashion, with the focus being on the role played by cloud to support some of the key digital technologies such as artificial intelligence, big data and analytics and IoT. The idea is to provide a very high-level overview of the digital landscape and how the leading cloud providers are helping enterprises with their digital initiatives.

    Artificial Intelligence

    The digital revolution, which centered around mass production of computers and communication devices, has changed the way businesses have operated over the last several decades, resulting in constant improvements ranging from generating new ideas for products and services to innovative product designs to improving the customer experience. At present, the world is going through another, possibly even stronger wave of revolution. It is the use of artificial intelligence to perform complex cognitive tasks to solve business problems in ways that previously were either highly complicated or extremely resource-intensive. Most organizations deal with business propositions that yield small to medium value and require a high volume of human work, such as reviewing large numbers of documents such as RFPs to understand requirements and estimate costs versus returns to determine whether to proceed with those proposals. AI is proving to be the best alternative to handle cases such as these that are currently being dealt by human beings, but the volume of work involved challenges businesses on the feasibility of continuing those without AI.

    AI systems try to mimic the human brain, which uses patterns to generate perceptions, and logic to drive the structured approach of analyzing a situation from a rational perspective. AI systems process large volumes of data that could come in from various sources such as sensors, online applications, textual data from social media and the like. AI processes the data using perception to analyze patterns and incorporates machine learning to utilize structured evaluation methods and rational decision-making, not only to extract pieces of meaningful information, but also to assemble such pieces of information to make valuable decisions.

    Cloud plays a significant role in enhancing the power of applications that incorporate AI. Almost all major players in the cloud business have developed AI services that use powerful cognitive engines to process structured data such as relational databases and unstructured data from NoSQL databases, sensors and other technologies that get uploaded to the cloud. The robust pattern-matching algorithms and the powerful logic component built into these cognitive engines are highly sophisticated. Data and compute power are the two most critical requirements to make these engines effective. The engines predict more accurately with larger datasets. AI applications such as image recognition, video analytics, natural language processing and speech recognition leverage machine learning using highly sophisticated neural networks that perform detection and prediction from large volumes of data. Parallel processing with the use of graphics processing units (GPUs) make these data processing and computations faster. Building and implementing such robust GPU-based parallel processing engines on-premises would be a very expensive and resource-intensive initiative. Cloud addresses this problem by providing APIs to access several machine learning services such as video analytics, speech recognition, process automation, vision detection and natural language processing. Behind these APIs are complex infrastructures that combine the power of clusters of GPU-based compute engines, neural networks and data lakes.

    Amazon’s AWS Marketplace offers machine learning and AI software solutions from several major software vendors to help AWS customers increase the efficiency and productivity of their businesses. AWS’ artificial intelligence solutions offer several pretrained services that can be utilized by developers to add intelligence to their applications via simple API calls. Advanced deep learning functionalities are provided by Amazon Lex, which chatbots could incorporate for automatic speech recognition and natural language processing abilities. Similarly, AWS provides Amazon Polly to build applications that can convert text into speech delivered in natural sounding male or female voices. Amazon Rekognition, meanwhile, uses technology to analyze billions of images, so applications can be developed to search images, detect and compare faces, objects and scenes.

    Google Cloud also offers competing products and services to support their customers’ AI initiatives. Google Cloud Natural Language provides powerful machine learning models that analyze text to provide meaningful insight such as customer sentiments about a product via conversations on social media. Google provides Cloud Speech-to-Text, a service that understands about 120 languages and converts audio to text. Similarly, Cloud Text-to-Speech can convert text to natural-sounding speech in 30 different voices and in several languages. Google also provides products such as Cloud AutoML, a suite of machine learning products, and Cloud Machine Learning (ML), a managed service that can be leveraged by developers and data scientists to build powerful machine learning models.

    Microsoft Azure provides the infrastructure, tools and services to build smart applications with data that can live in the cloud, on-premises or on edge devices. Several products and tools are available via marketplace, and Azure provides sophisticated AI services to integrate the tools to develop intelligent business applications. Powerful chatbots could be developed by integrating Azure Bot Service, language understanding and external systems such as Office 365 and Dynamics CRM to streamline and automate common activities. Another example is an automated failure detection system for assembly lines built based on Azure’s image classification system using a convolutional neural network to help improve the identification of faulty electronic components. Azure also provides Visual Studio Code Tools to build, test and deploy AI solutions. The powerful AI Toolkit for IoT Edge from Azure enables IoT devices with AI that runs locally through pre-built deep learning models. Last but not least, Azure’s Machine Learning Studio helps develop and manage predictive-analytics solutions.

    Big Data and Analytics

    With the growth of internet, cloud and social media, there has also been an exponential growth of data across the world. According to statistics on big data generation in the last five years, the average volume of data created in the world every day is about 2.3 trillion Gigabytes. When the nature of the data was more structured and organized, companies relied on data warehouses and BI applications to help make important data-driven business decisions. Traditional data warehouses were built based on relational databases that could be queried using SQL; the data could be extracted, transformed and loaded from one or more data sources via ETL jobs that ran up to several times a day. This overall approach has proved to be ineffective when it comes to handling and modifying continuous streams of real-time data flowing in from multiple dissimilar sources such as social media, IoT, the public web and relational databases. Big data analytics, which helps examine large structured and unstructured data sets, has become a major enabler for enterprises to make critical business decisions by providing insight and knowledge with data mining, predictive analytics and forecasting. As big data processing evolved, the concept of data lakes came into existence. A data lake is a centralized repository that allows the storing of structured and unstructured data as is and enables the use of a variety of tools and approaches to answer business questions.

    The ability of the cloud to scale vertically and horizontally makes it the ideal platform for big data hosting and analytics. With vertical scaling, it is possible to increase the capacity of a server by adding resources as needed by the applications. Horizontal scaling allows expanding hardware as the processing requirements increase. Hadoop, which leads the big data revolution, is designed as a distributed system so that it can take advantage of scaling. Parallel processing is an important part of its design so that the system can process several independent small tasks such as serving data stores and file systems, processing streaming data and handling queries in tandem. Cloud-based systems offer high bandwidth, enormous amounts of memory and scalable processing power to help big data applications with improved real-time processing and analysis of streaming data. Cloud undoubtedly is an obvious choice for applications running large workloads and storing enormous volumes of data. Cloud providers offer highly scalable database services coupled with tools and services to support information-management, business intelligence and analytics.

    All major cloud service providers offer competitive and comprehensive tools and approaches to process big data at the volume and velocity that your business demands, while at the same time being conscious to reduce the associated operational costs. To perform faster and efficient transfer of petabytes of data to the cloud, AWS provides solutions that employ different techniques such as network multiplexing, reduced storage footprint via data deduplication and compression and advanced data replication. AWS offers services including Amazon Elastic Compute Cloud (EC2) and Simple Storage Service (S3) to provide the elasticity needed for your data lake along with your choice of database products, ETL and reporting tools via AMS Marketplace solutions. Similarly, with Microsoft Azure HDInsight, solutions can be developed using open-source frameworks such as Hadoop, Spark and Hive to analyze streaming or historical data. To process large volumes of data, HDInsight offers a broad range of cost-effective solutions for ETL and data warehousing. Azure HDInsight offers specific cluster types such as Apache Hadoop, Apache Spark, R Server and Apache HBase, with cluster customization capabilities such as adding components, utilities and languages.

    Internet of Things

    IoT is the concept of connecting devices such as security sensors, surveillance cameras, smartphones, smart watches and other wearables and even household appliances such as washing machines, refrigerators and several others that have the ability to communicate and transfer data over the network without direct human interaction. This disruption in technology has not only empowered individuals and families with greater control of their household systems and appliances, but enabled organizations with data that provide greater insight into critical areas of business interest, opening the doors for innovative products, solutions and new business opportunities.

    The rate of adoption of IoT by businesses is growing exponentially as the number of connected devices continues to increase. As per Gartner’s recent study, businesses could already be using as many as 3.1 billion IoT devices today, and by 2020 this number is likely to rise to about 7.6 billion. According to an article in Forbes, IoT will have an impact in all industries, from manufacturing to logistics to health care. We are not too far from the days where nearly everything in the world will be connected. IoT is at present playing a dominant role in optimizing production, managing supply chains, tracking assets, making financial decisions and improving the customer experience. Digital transformation of the fitness industry has been remarkable. Wearable devices with built-in sensors can constantly collect data on physical activities such as distance travelled, calories burnt and sleep patterns to provide detailed analyses and insight for continuous health care. IoT applications are designed to use data from connected devices, and the sophisticated tools available in the cloud let you visualize, explore and build complex analytics. In complex IoT applications that use several devices, it is important to understand the state of the devices and to frequently communicate to the application components that leverage those devices. It is also essential to ensure secure identity and access between devices and applications.

    As with any revolution in technology, IoT also has its associated challenges. With more devices being connected to the internet, the volume of data generated is also immense, which in turn puts significant pressure on the internet. So there obviously is a need to support infrastructure that can transmit and store this data more efficiently. Due to the vast number of connected devices, and with that number constantly increasing, there is a push toward making these “edge” devices intelligent to perform some degree of processing and then send the results to the servers rather than sending massive amounts of data to central servers to perform all the processing. For example, surveillance cameras in the past would send all the videos to the central recording device, which in turn would record only when it detects motion. Consider the scenario where hundreds of high-definition surveillance cameras are sending video feeds constantly to the central server—the impact this could have on the network is unimaginable. It should also be noted that as the physical distance between the devices and the server increases, network transmission latency increases. With edge computing, the video cameras are smart enough to sense motion and they send videos to the cloud-based central recording system only whenever they detect motion. This drastically reduces the volume of data that is transmitted over the network and makes it a more efficient system. Cloud and IoT complement each other—connected devices generate huge amounts of data and cloud provides the infrastructure to store, process and analyze the data. It is also interesting to note that IoT is an important data source for big data analytics.

    Cloud IoT Core service, built by Google Cloud Platform (GCP) partners, offers connectivity to devices by providing the necessary hardware, software and solutions. These services include secure connection of devices (via identity and authentication) over industry standard protocols including MQTT and HTTP.  Cloud IoT Core also allows remote controlling of devices from the cloud by maintaining a logical configuration of the devices. Since this IoT service is serverless, there is no need for upfront software installation and the horizontal scaling of the GCP can instantly be leveraged when required. A host of tools such as Dataflow, BigQuery, Bigtable and Data Studio are available to help with data analytics and insights.

    Microsoft provides services for IoT via the Azure IoT Hub. Features offered by the Azure IoT Hub include ensuring bi-directional communication with billions of IoT devices, establishing device-specific access control, secure and scalable provisioning of devices and integration between cloud and edge to distribute intelligence across devices. Azure IoT Edge provides features for optimized performance of the edge and cloud such as ensuring the lowest latency between edge devices and the cloud. IoT Edge helps control IoT costs by reducing the volume of data transferred from the edge devices to the cloud. It leverages services such as Azure Stream Analytics to process data at the edge and transmit only the bare minimum data that is needed by the cloud for further analysis.

    Amazon provides a fleet of services such as AWS IoT Core, AWS IoT Device Management, AWS IoT Analytics and several others to support IoT initiatives. For easy deployment, programming and management, Amazon offers the FreeRTOS lightweight operating system for small edge devices. The AWS Greengrass software further enhances the power of edge devices by offering local compute, secure messaging and data caching. AWS IoT Analytics, a fully managed service, provides all the capabilities required to run complex analytics on IoT data to obtain insights and to build machine learning use cases.

    Taking Everything Into Account

    Technology is certainly a major driver in any business today and companies that struggle to integrate technology effectively will eventually find it difficult to sustain or do well in their marketplace. Connected devices, social media and massive volumes of several forms of structured and unstructured data feeds have paved the way to further leverage technology and transform businesses. This “digital transformation,” which includes use of artificial intelligence, big data analytics and IoT, is fast becoming a key requirement for organizations to be innovative and competitive. Digital has opened doors for better analytics and decision-making, leading enterprises to explore, analyze and obtain new insights and ideas on growing their businesses.

    With cloud reaching a high level of maturity with regards to services, tools and security, it has become the ideal platform for digital technologies. All leading cloud providers have comprehensive and competitive solutions, tools and associated services to address even the most complex digital transformation initiatives for their customers. Furthermore, the horizontal and vertical scaling of infrastructure offered by the cloud makes it highly suitable for the compute requirements demanded by digital technologies.

    Escaping from or ignoring the digital revolution will be disastrous to organizations as well as individuals. Humans and businesses are generating trillions of gigabytes of data every day. Whether we have realized it or not, digital is transforming our lives. It is important for organizations to get on board soon and devise a digital strategy that works together with their cloud initiatives and strategy.

    — Sridhar Asvathanarayanan