Tag: application pipeline

  • Why Data Lineage Matters and Why it’s so Challenging

    Why Data Lineage Matters and Why it’s so Challenging

    Change introduces risk. It’s one of those foundational principles of software development that most of us learned very early in our careers. Nevertheless, it always seems to keep cropping up in spite of those repeated life lessons. Our inability to foresee the impact of changes, even small ones, often leads to negative outcomes.

    As the complexity of interconnected IT systems has increased, this problem has grown worse. It’s harder and harder to predict how even a small modification might impact systems upstream or downstream of the change. Data lineage accomplishes that, but it’s extraordinarily difficult to do data lineage well.

    Why Data Lineage Matters

    In the old world, data resided in silos with relatively few connection points between them. Today, data flows multi-directionally among multiple systems. Many of those systems share data with external organizations, which means that information subsequently flows to internal systems there, as well. Consequently, it’s easier than ever to overlook the impact of a single change on multiple other systems.

    Imagine, for example, that your company provides a mobile app that enables customers to quickly and easily request a new service call. In the past, your customers could specify which product variant they owned. Your design team has determined that since you already have that information in your CRM database, you no longer need to collect it from users of the mobile app.

    You’ve been tasked with simplifying the app, so you remove that input field and replace it with a query that pulls the customers’ product information from your CRM. Theoretically, the resulting work tickets should include all of the information that your field service personnel need to get the job done.

    Unfortunately, there’s a problem; some of the customers’ product records in your CRM system contain null values. Your mobile app is querying that information, but it’s delivering invalid results to your ticketing system. Your field service personnel no longer know how to prepare for their next service call.

    That might sound like a relatively simple problem of data quality—one that might have been foreseen if someone had been more thorough about vetting the CRM data. Even that might not have solved the problem, though, if null values in the CRM database were not introduced until later. If customer data from a newly acquired company is merged into your CRM system, for example, you might not have product information tied to those new records.

    Sometimes these issues are more difficult to predict, and they may not be apparent right away. Imagine what happens when your marketing team decides to redefine its customer segmentation criteria. A new data field is added to designate the customer category; then it’s populated with values for all customers and the old field is deprecated.

    Unbeknownst to the marketing department, though, the company’s top executives are still looking at the old data. They’re using dashboards that rely on data from the deprecated field. New customers are being added every day, but no one is entering any values in the deprecated field. As a result, the executive team is looking at distorted data. Suddenly, the C-suite is tracking very different KPIs than the rest of the organization. What’s worse, no one even notices that there’s an issue until weeks or months after the fact.

    Next, imagine a similar scenario, but instead of populating an executive dashboard, the source system is feeding data to the AI algorithms that drive customer recommendations on your e-commerce site. When AI is trained on flawed data—or if the data changes materially in some way—it can dramatically impact the effectiveness of that technology. In this case, it distorts your customer recommendation engine.

    Tackling the Challenge With Data Lineage

    Data lineage tools provide a systematic means of understanding the impact of changes by presenting a complete roadmap of potential implications, both upstream and downstream.

    This amounts to risk reduction and cost control. If we can predict how changes might impact other systems, we can avoid creating problems like the ones we described earlier. That leads to less wasted effort, faster time-to-market and lower costs. We’re all familiar with the principle that says it’s faster and cheaper to solve a problem when you catch it early in the development process; data lineage provides a critical missing link, potentially ferreting out problems before they even reach QA.

    There are benefits to data governance and regulatory compliance as well. When the European Union passed the General Data Protection Regulation (GDPR) back in 2016, it set off a chain of new requirements for systems that house personally identifiable information (PII). If a customer asks you to delete their data, you’re legally obligated to comply with that request. But what happens upstream and downstream of that change? Will it break anything? Or will some of the customer’s PII remain elsewhere in your systems, rendering you non-compliant with the law?

    Data lineage addresses these questions by automating the process of detecting upstream and downstream effects. It provides clear auditability that can help determine where changes originated and how the data arrived at its current state.

    Column-level data lineage is especially difficult because it requires that SQL queries be parsed to discern exactly what changed and how. This means tapping into database logs, but because there are so many database vendors—each with their own unique SQL dialect—parsing that information for various databases can be particularly challenging. As each of those SQL dialects evolves over time, data lineage tools must constantly be refined to accommodate those changes.

    An example column-level lineage view that shows all the tables and columns that are involved in computing the sales table used for reporting in an imaginary e-commerce business selling craft beers.

    As interconnected systems extend their reach even further and the flow of information accelerates, column-level data lineage will become more important. Today, it’s an extraordinarily useful tool that saves time, effort and money. Soon, data lineage will be indispensable.


  • A Closer Look at Azure DevOps

    A Closer Look at Azure DevOps

    Microsoft’s Azure DevOps Server is emerging as one of the most popular cloud application development environments. Like most continuous integration/continuous delivery (CI/CD) platforms, it provides features such as version control, reporting, project management, automated builds, and testing. It covers all aspects of the application life cycle and enables DevOps. Here’s a closer look at this cloud computing environment.

    Azure DevOps provides a number of different developer services that allow DevOps teams to plan work, collaborate on code development and build and deploy applications. It is highly collaborative and brings together developers, project managers and individual contributors to develop software. It allows organizations to create and improve products much faster than with traditional software development approaches.

    Services or Server?

    Teams can work in the cloud using Azure DevOps Services or on-premises using Azure DevOps Server.

    The cloud offering, Azure DevOps Services, is a scalable, reliable and globally available hosted service. It’s backed by a 99.9% SLA, is monitored by Microsoft’s 24/7 operations team and is available in local data centers around the world.

    The on-premises offering, Azure DevOps Server, is built on a SQL Server back end. The on-premises version is preferable when organizations need their data to stay within their network or when they want access to SQL Server reporting services that integrate with Azure DevOps Server data and tools.

    Although both offerings provide the same essential services, Azure DevOps Services offers some added benefits:

    • Simplified server management.
    • Immediate access to the new features and updates.
    • Improved connectivity with remote sites.
    • A transition from capital expenditures (servers, etc.) to operational expenditures (subscriptions).

    There are also some other key differences depending on your organization’s or your team’s needs. These can also be helpful if you’re migrating from on-premises to the cloud:

    Differences in Specific Feature Areas

    Although Azure DevOps Services is a hosted version of Azure DevOps Server, there are some feature differences. Some Server features aren’t supported in Services; for example, Azure DevOps Services doesn’t integrate with SQL Server Analysis Services to support reporting. Process customization and reporting also differ in their support.

    Integrated Features

    Azure DevOps provides integrated features that can be accessed through a web browser or an IDE client. One or more of the following standalone services can be used based on your organization’s business needs:

    • Azure Repos: Azure repos provides Git repositories or Team Foundation Version Control (TFVC) for source control.
    • Azure Pipelines: This service provides build and release services to support continuous integration and continuous delivery of applications.
    • Azure Boards: This suite of Agile tools supports planning and tracking work, code defects and issues using Kanban and Scrum methods.
    • Azure Test Plans: Azure Test Plans provides several tools to test applications, including manual/exploratory testing and continuous testing.
    • Azure Artifacts: These allow teams to share packages such as Maven, npm, NuGet and more from both public and private sources and integrate package sharing into pipelines.

    Use of the following collaboration tools is also supported:

    • Customizable team dashboards with configurable widgets to share information, progress and trends.
    • Built-in wikis for sharing information.
    • Configurable notifications.

    Azure DevOps supports adding extensions and integrating with other popular services, such as Campfire, Slack, Trello, UserVoice and more. In addition, DevOps teams can also develop their own custom extensions.

    Azure DevOps Services supports integration with GitHub and GitHub Enterprise Server code repositories. Azure DevOps Server supports integration with GitHub Enterprise Server repositories.

    Getting Started

    When you sign up for Azure DevOps, you must first register an organization, project and version control type. DevOps teams can create multiple projects and differentiate them with separate names and access permissions. Projects can be set to public or private. Teams can also use Azure Boards for collaboration and project management, and can also configure use of Agile practices. After setting up your team, you can use the platform to begin deploying your applications to Azure.

    In addition to a collaborative environment, Azure DevOps provides access to an Azure Pipeline service that supports multiple languages and platforms. The Azure DevOps pipeline is a set of services that are grouped into individual projects. 

    Additionally, Azure Test Plans feature facilitates automated testing. It is also possible to set up deployment pipelines with different components for multiple applications. 

    Azure Pipeline can track work status, manage backlogs and create custom reports. With the help of the Azure DevOps pipeline, developers can create, manage and deploy their projects in a single environment. With this solution, DevOps teams will have a single point of contact and can communicate with each other.

  • Securing Your Software Development Pipelines

    Securing Your Software Development Pipelines

    Earlier this year, it was announced that the attack on IT management software provider SolarWinds had been used to compromise other organizations, including parts of the United States government. There were several reasons for alarm because of this news, but one of the biggest was the revelation that attackers breached SolarWinds’ software development process and pipeline. The level of concern was such that it led to a first-of-its-kind executive order on cybersecurity.

    The security of the software development process has been a concern for development teams for decades, beginning with Ken Thompson’s thought experiment around hacking compilers to inject vulnerable code (PDF). As the software development process becomes increasingly automated, this means there is more to secure. Indeed, the biggest difference between Thompson’s “Reflections on Trusting Trust” and today is that much of our concern stems from just how much we, as development teams, must trust code that was not written by us.

    The issue of code ‘not written here’ is bigger than just open source libraries – though those are a big part of the issue since a typical Java application is 97% third-party code by weight, according to the Veracode State of Software Security, 2020. Moreover, modern cloud-native applications are also comprised of additional types of code written by others, including container images, serverless code and other cloud-native artifacts.

    As a result, an attacker could compromise a development pipeline by one of a variety of means:

    • Poisoning an upstream open source repository by taking over an open source project, or by typosquatting
    • Compromising a container image repository
    • Gaining access to the continuous integration server and making changes in the pipeline to incorporate malicious code
    • Gaining access to the source repository, identifying an existing vulnerability (zero-day) in an application, and exploiting it in production

    So, what must be done to mitigate these threats? A lot of the answer comes down to testing, managing the chain of custody and monitoring access to internal resources.

    • Managing access—Systems that touch your software development process provide a door that, if not properly secured, may allow an attacker to walk in and compromise the software you ship to your customers. Things to be aware of here include the source control system, the continuous integration server and other tools (including quality and security tools) that have access to the source repository. Similarly, any activity that touches the source code, especially commits to the source code repository, must be properly authenticated with a developer GPG key. This prevents spoofing a user’s identity by setting git configuration parameters (this blog post from Alessandro Segala describes the problem nicely) or by stealing credentials.
    • Manage the chain of custody for software dependencies—Most modern software dependency managers allow connections to multiple software registries, including public registries that can be easily attacked or compromised. Configuring dependency managers to only allow connections to an authorized list of registries can help keep compromised packages from entering the build pipeline. This can also help to ensure that only dependencies that are free of critical and high vulnerabilities can be used in the application. This topic also relates to the next one on testing for vulnerabilities. Part of managing code coming from other parts of the software supply chain is looking for security vulnerabilities in the code. Consider a security scanning tool that can look for vulnerable open source libraries or container images with vulnerabilities and security misconfigurations.
    • Testing for vulnerabilities —Code introduced by an attacker may introduce new vulnerabilities. Using static application security testing (SAST) can help to identify serious security issues, including poor cryptographic practices, hard-coded credentials, and injection vulnerabilities. Performing SAST in the pipeline allows for the identification of critical and high severity defects early, enabling you to fail a pipeline upon their discovery and preventing insecure code from being deployed into production. Likewise, as noted above, testing for vulnerable containers and open source libraries can prevent vulnerabilities from being introduced via the software supply chain. Finally, using dynamic application security testing (DAST) to perform an end-to-end runtime test for a web application in a pre-production environment can help identify other exploitable issues in the end-to-end application. It can also find problems with application configuration that are only observable in the deployed environment. Both SAST and SCA might identify weaknesses in software that, while indicative of poor coding processes, may not be vulnerabilities. So, selecting tools that allow you to set a baseline of acceptable findings can help to ensure this control is adopted successfully.

    Solving all these problems requires thinking about different parts of the application development process as a complete system. To that end, Veracode collaborated with Venafi, Sophos and CloudBees earlier this year to put together a proposed blueprint for secure software development pipelines. The proposal is maintained on GitHub and is available for users to raise issues or propose pull requests on the blueprint—all input is welcome.

    The importance of getting this right cannot be underestimated. Hacks and breaches continue to hit the headlines, and putting in place the right tools, technologies and processes to minimize security risk in the software development pipeline is more critical than ever. 

  • CircleCI Adds Test Insights Module to CI/CD Platform

    CircleCI Adds Test Insights Module to CI/CD Platform

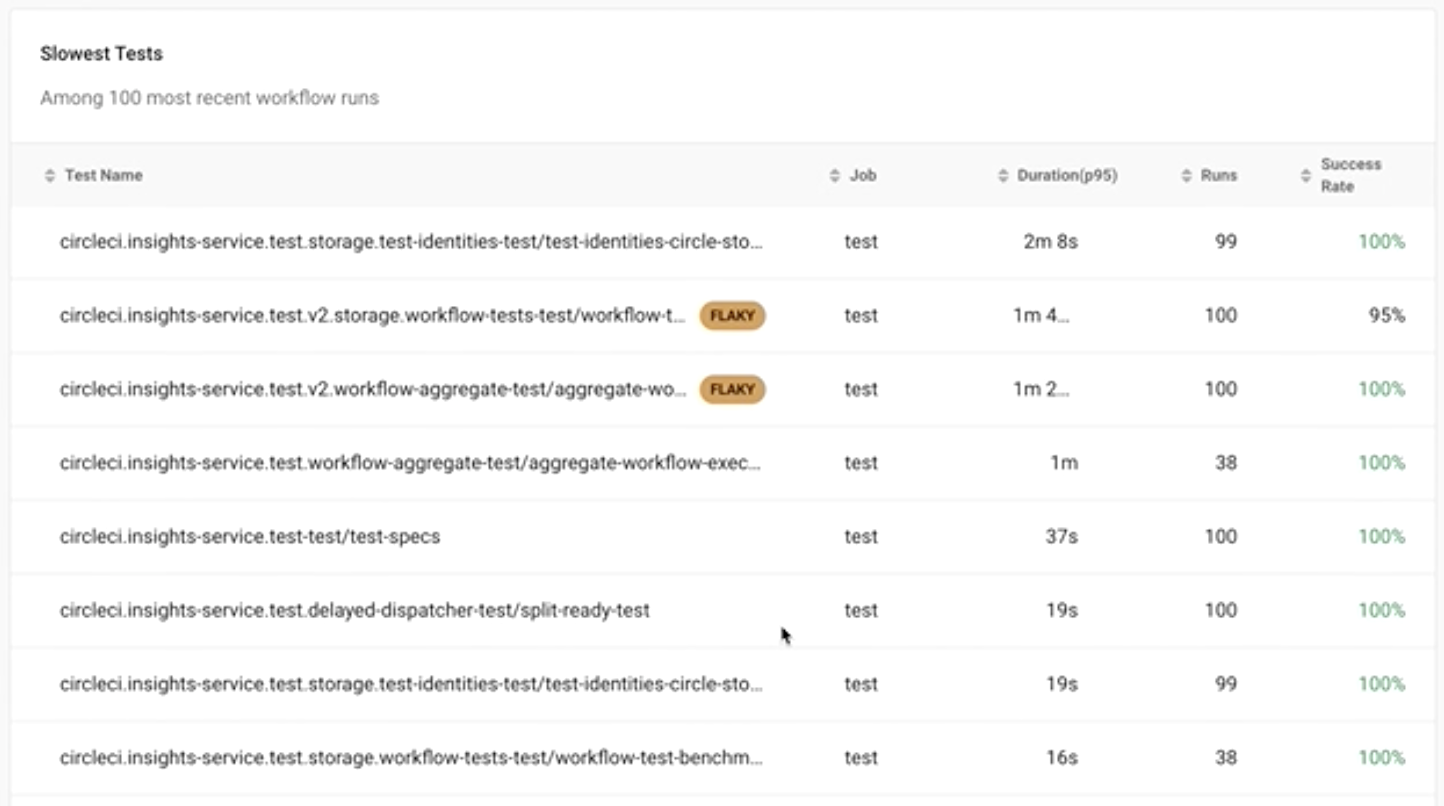
    CircleCI today announced it has added a Test Insights capability to its continuous integration/continuous delivery (CI/CD) platform to make it easier to identify tests that are either taking too long to run or simply exhibiting some form of anomalous behavior.

    Dawit Gebregziabher, product manager for data insights at CircleCI, said Test Insights is designed to make it simpler for IT organizations to shift more responsibility for testing further left toward DevOps teams that identify issues as applications are being built on the CircleCI platform.

    Each organization will still need to determine what tools to employ to create a test, but once it starts running, the Test Insights module will be able to surface the tests that, for one reason or another, are problematic to execute, he added.

    Test Insights, for example, will flag flaky tests and identify the longest-running and most failed tests. It will also enable DevOps teams to identify performance changes over time to pinpoint changes in application behavior.

    Finally, DevOps teams can track benchmarks at the organization, workflow and job level, as well as metrics for mean-time-to-recovery, throughput and durations for 24-hour, 7-day and 30-day windows of time.

    The challenge DevOps teams often encounter is a test may be run even when it’s apparent the application will fail. Test Insights makes it feasible for DevOps teams to manage the testing process much more efficiently, said Gebregziabher.

    It’s not quite clear how far testing is shifting left. There’s no doubt more developers are testing their code before it is loaded into a production environment to hopefully avoid issues that will only become more expensive to fix later. Other organizations have dedicated software engineers to create testing processes that are tightly integrated with CI/CD pipelines, noted Gebregziabher.

    However, many large enterprise organizations continue to also hire and retain dedicated application testing teams that are trained to identify issues that might either adversely affect the end-user experience or run afoul of compliance requirements.

    Regardless of who does what kind of testing, however, it’s clear there’s a lot more focus on addressing issues earlier when they are much less expensive to fix. The goal should be to make it easier to optimize when tests should run based on probabilities that ultimately reduce the time wasted running tests that either will fail or are, for one reason or another, flawed.

    Developers, of course, are all equally committed to running tests, so organizations will need to determine for themselves how far to shift that process left. However, at the very least, DevOps teams should be able to identify patterns that might indicate there is a need for additional developer training. After all, it’s unlikely a developer is going to understand there’s an issue until some meaningful metrics are shared.

    In the meantime, the more testing that occurs at a faster rate the more likely it becomes that an organization can provide a superior application experience the first time—and every time—an application is built and deployed.

  • How to Prepare Your DevOps Environment for DevSecOps

    How to Prepare Your DevOps Environment for DevSecOps

    The COVID-19 pandemic has created a deep, irreversible change within work environments, as most organizations are reimagining this “new normal” with a combination of fully remote or hybrid work. DevOps practices are being increasingly normalized and relied upon to respond to the needs of modern, digitized companies. Coming out of the pandemic, organizations now better understand the need to efficiently deploy the software applications necessary to thrive in this new world of work.

    This isn’t surprising given organizations have realized the value of DevOps to help product teams deliver quality code at a fast pace. DevOps enables them to be more agile and move more quickly to respond to evolving market changes and business demands. To maintain the speed of software delivery, product teams are integrating various tools within their CI/CD pipelines and minimizing tool citations and validations outside of their pipelines.

    As the rate of change increases alongside these DevOps practices, automating compliance to enterprise security controls becomes more important than ever, especially given that security vulnerabilities in code and configurations present dire business risks. For DevOps to truly succeed, organizations need to modernize and automate security processes, making them an integral part of the DevOps build and delivery pipeline—readying the overall DevOps environment for DevSecOps.

    But successful DevSecOps deployments depend heavily on the maturity of an organization’s current DevOps environment and security operations workflows. This includes prioritizing the core principles of automation, measurement and collaboration because these same principles also drive positive security outcomes. Referencing these principles, here are four best practices organizations should consider incorporating when evaluating how to mature their DevOps ecosystem and security operations processes to be ready for DevSecOps.

    Embed Security Tools in Developer Workflows and Governance Processes

    The first step in the journey prioritizes a “security-first” mindset and related skills for development teams. Security shouldn’t be an afterthought, and development teams shouldn’t rely on security teams to check vulnerabilities later in the life cycle. Instead, security experts need to become an integral part of the development phase so that the code accounts for security from the get-go.

    This can be achieved either by moving responsibility for security skills into the development teams or by having the security team play an advisory role earlier in the life cycle. Development teams can then automate the necessary security vulnerability checks—like static application security testing (SAST), software composition analysis (SCA) and dynamic application security testing (DAST). But more importantly, sharing insights and streamlining communication between development and security teams is crucial to ensure policies are working and are being consistently applied across the organization.

    Continue Automation Beyond the Pipeline

    Puppet’s 2020 State of DevOps Report revealed that organizations have matured their DevOps environment by improving governance processes such as change management, preparing enterprise infrastructure and applications for organizational change. In fact, they found that organizations with automated change management and governance processes are nearly three times more likely to outperform competitors in DevOps transformations.

    This is because automation improves change management processes, which in turn eliminates barriers to applying governance to DevOps. This is also backed by Puppet’s survey, which cited that automation makes organizations more confident that their change management solutions are effective. A comprehensive, automated change management process instills governance by applying policy-based rules to a code or configuration change before allowing it into production. It does this in real-time by leveraging data collected from the pipeline. When applied correctly, DevSecOps tools prevent vulnerabilities and automated change management conducts a ‘last mile’ check to ensure the correct scans were run and adhere to compliance policies.

    Provide End-to-End Traceability Across DevOps

    Product teams—and all involved in the delivery of an application—should have an accessible audit trail, providing visibility into security checks, users, code and configuration changes, code quality, testing and more. This paints a clear picture of what happens to the software from ideation to production. In an ideal world, product teams include both operations and security personnel, but these functions often remain siloed in large organizations.

    Companies can break down these silos and make it easier for teams to collaborate by centralizing visibility. Providing visibility and centralizing security policies makes it easy for teams to efficiently operate the delivery process of software since they are provided a single source of truth. Additionally, an automated system for gathering audit data improves the consistency and reliability of audit information. Automatically collecting data from the entire pipeline and eliminating the need for developers to enter information diminishes the likelihood of data anomalies—saving valuable time and resources.

    Empower Cross-Enterprise Collaboration to Address Security Issues in the DevOps Pipeline

    Applying artificial intelligence and machine learning to DevSecOps processes helps organizations quickly identify and remediate security issues before they are manifested in production, enhancing proactive and actionable collaboration and coordination across product teams.

    As Puppet cited in its 2019 State of DevOps Report, sharing and collaboration are two of the most impactful things teams can prioritize to improve DevOps initiatives, including DevSecOps, and this still holds true today. The 2020 survey results signaled how many more organizations are reaching this peak point of DevOps maturity.

    Ultimately, we’re already seeing how operational activities—like checking software for security vulnerabilities—are moving into the DevOps pipeline and are being handled as “code.” But organizations should take this a step further by keeping in mind factors such as reliability, predictability, measurability and observability across DevOps deployments to foster more secure environments and pipelines.

  • Plutora Dives Deeper into Value Stream Analytics Data

    Plutora Dives Deeper into Value Stream Analytics Data

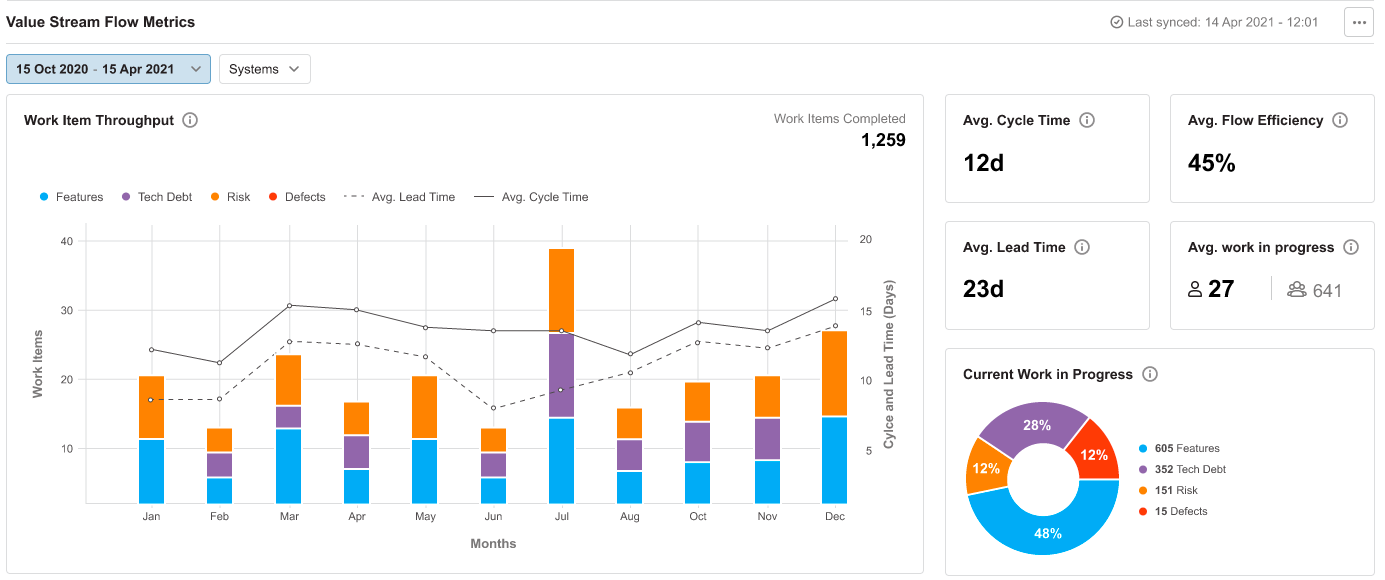
    Plutora announced today it has extended the capabilities of its value stream management (VSM) platform to include a common object data model that more efficiently normalizes data collected from multiple DevOps tools and platforms.

    Jeff Keyes, vice president of product marketing and strategy for Plutora, said the goal is to expand the level of scale and depth at which the Plutora analytics engine embedded within the Plutora Platform can analyze flow metrics.

    VSM has emerged as a distinct DevOps discipline that provides a framework for enabling organizations to optimize workflow across DevOps environments in a way that allows them to accelerate application development. The core concept traces its lineage to lean manufacturing methods that continuously measure each step of a process to improve production.

    As organizations develop a deeper appreciation for their dependency on software, the level of interest in understanding how software is constructed has increased. Organizations, for example, want to better understand the impact of missed software development deadlines on revenue, which a business might not be able to generate as quickly as anticipated.

    Plutora is making a case for a dedicated analytics platform that pulls data from multiple platforms. Alternatively, more value stream analytics capabilities are now being embedded in everything from project management software to continuous integration. Plutora contends, however, that navigating multiple value stream dashboards surfaced by different tools that make up a DevOps workflow is not as simple or effective as relying on a single platform that collects data from every tool employed.

    Metrics that track lead and cycle times for projects as well as overall throughput become much easier to surface and comprehend, noted Keyes.

    One way or another, more transparency is coming to DevOps workflows. Historically, collecting this data has been challenging because it required DevOps teams to manually collect data from each tool being used. In effect, DevOps teams were wasting time copying and pasting data from one tool into an analytics application.

    As it becomes simpler to aggregate all that data, the data model provided by Plutora makes it simpler for multiple analytics tools to analyze the same data. A business user, for example, may prefer to analyze data using the Tableau analytics platform that is now owned by Salesforce.

    In general, analytics is being applied more widely across software development processes because organizations need to increase productivity while simultaneously reducing costs. It will be up to each organization to decide to what degree they may want to use that data to better train DevOps teams versus simply using it to remind those teams to stay focused on a specific set of key performance indicators (KPIs).

    In the meantime, the number of requests for reports being made to DevOps teams should decline as the process of collecting metrics becomes more automated. The challenge now will be making sure everyone reading those reports has the same firm understanding of what’s actually possible to achieve using not only the resources at hand, but also how any additional DevOps expertise might positively impact that equation.

  • Debugging is Broken – Here’s How To Fix It

    Debugging is Broken – Here’s How To Fix It

    Let’s face it, debugging is broken.

    Whether you wholeheartedly agree or vehemently disagree with that statement, I think we can all agree that debugging, at the very least, has room for improvement. In fact, the way software developers debug their code hasn’t changed much. Of course, there are now a wide array of observability and monitoring tools available to make a developer’s life easier, but when we look at the process developers typically follow when debugging code, it’s stayed relatively unchanged over the years.

    Having the right tools available definitely improved the overall debugging experience, but they’re not the only factor. Internal organizational processes are equally as important, and should be adapted to make developers’ lives as smooth and stress-free as possible while still maintaining the proper levels of organizational security and compliance. Inefficient or highly restrictive processes, while great for the compliance team, can adversely affect the velocity of getting to the bottom of issues quickly. The right solution is typically a combination of adapting those processes to fit the company culture, along with a combination of tools that allow for compliance with industry standards and best practices.

    How Developers Debug Code

    When you talk to developers today about how they debug their applications, the process is typically not all that different than it was many years ago. The standard approach to debugging is still through the use of logging frameworks. Of course, teams are taking advantage of things like application performance management (APM) tools and other tools in the monitoring and observability space, but when you look at the primary method of debugging issues that require developers to dive into the code, logging is typically the main approach.

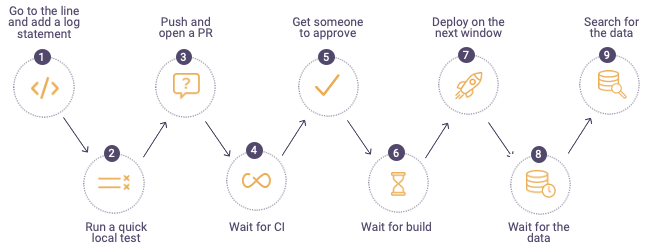
    The process typically looks something like this:


    debugging process

    When a defect is found, developers will first go to the log files on the production or pre-production servers in the environment where they are debugging. If they can’t find information in the logs to help them get to the root cause of the issue, they go back to their code and add additional log lines, finally sending their code through the process shown above. For highly advanced organizations, the process can take minutes or hours, but more often than not, this process drags on for days – or even weeks. It becomes especially time-consuming when the defect developers are trying to find and remediate is in production. In these cases, the cost to the business can be staggering; there’s got to be a better and more efficient approach to debugging.

    Where Tools Can Help

    While new and shiny tools don’t always solve all debugging problems, they can often ease some of the pain developers face and, in the process, make their lives a little bit easier. Debugging, observability and monitoring tools can get developers the data they need to solve problems faster than the more traditional method of digging through logs and using trial and error.

    The place many organizations start when considering diagnostic tools is with APM. These types of tools focus specifically on monitoring and management of the application availability, and can help to collect metrics and other relevant application information that can aid in pinpointing infrastructure issues. Most often, these tools are not actually used by developers themselves, but rather operations or production support teams to ensure availability and performance thresholds of applications.

    Another critical category of telemetry are tracing tools, which can help developers better understand how requests flow through multiple tiers of applications and even help identify error rates and latency. There are many vendors selling this category of tools, but there are also open source options which allow developers to integrate tracing into their applications via a vendor-neutral approach.

    After diagnosing an issue with an APM solution, there is often a handoff to development to remediate the issue. When developers need to debug, they often use their local IDEs or, even better, a remote debugging solution. Remote debuggers are used directly by developers to simplify debugging of applications in remote environments. These tools helps developers get to the bottom of customer issues faster by giving them direct access to the underlying application data in a safe and secure way while the application is running without stopping it or having to redeploy it. A major benefit of remote debuggers is that they can give developers the data they need from production environments without compromising security or requiring developers to have direct access to sensitive environments. While remote debuggers and other debugging tools are not a silver bullet, they can be a critical component that empowers developers to better address critical issues.

    Fixing Organizational Problems

    If solving customer issues is taking longer than expected or is potentially hurting your brand, it’s critical to sit down with your development team and use a data-driven approach to identify where the problems lie. Do a deep dive into your issue tracking or ITSM system to identify trends or recurring issues within particular application components. Development teams can often become so overwhelmed tackling issues and building out new features that valuable information in these internal systems can go untapped. Customer issues and defects should be reviewed periodically to assess things like business impact, cost to fix and alignment with the product roadmap. There is valuable information that can help focus the team’s effort on time-saving activities as well as improving the product, making for happier customers.

    Another area to look at is your software delivery process. Are there bottlenecks in your delivery pipeline that could be made easier or more efficient but have been overlooked? The speed and efficiency of your software delivery pipeline has a direct impact on developers’ ability to debug effectively and can contribute to a broken or slow debugging process. Developers should have the ability to push code into new environments as quickly as possible to remove slowdowns from too much context switching. This means automating as much of the delivery pipeline as possible, removing unnecessary manual deployment approvals and shifting left as many activities as possible.

    When it comes to empowering developers and fixing broken debugging processes, organizations should focus on fixing organizational bottlenecks as well as equipping developers with tools that can save them time and improve their daily workflows. Focusing on these areas can increase development team velocity and eliminate costly day-to-day slowdowns which add up over time and negatively impact productivity. With a few key changes, debugging can be a much more manageable and predictable process.

  • The Surprising Secret to DevOps ROI

    The Surprising Secret to DevOps ROI

    As a result of my many years of DevOps consulting, I have discovered a simple, but not well-understood, secret ingredient that drives ROI for all the Three Ways of DevOps.

    Measuring and optimizing return on investment (ROI) for DevOps is not well-understood. It is a proven fact that DevOps, when engineered well, delivers tremendous value to organizations by way of continuous delivery practices. Reduced lead time, more frequent releases, lower failure rates and faster time to restore services are well-accepted indicators of DevOps value. It is not a secret that the combination of engineering DevOps practices for people, processes, and technologies around the Three Ways of DevOps – continuous flow, continuous feedback and continuous improvement – gets results. As valuable as these things are, they are not a measure of ROI, and do not tell you what to do to improve the return on your DevOps investments.

    How Do You Calculate and Optimize DevOps ROI?

    First, it is important to understand that ROI for DevOps is best measured using a simple ratio of return (R) divided by investment (I). (OK – for the accounting purists out there; I know the real ROI formula is actually (((R-I)/I)*100%) but that is a technicality that we don’t need for this argument.)

    The “return” of DevOps value is the important factor in the numerator of the ROI ratio. While there are many values that can be attributed to DevOps, the most direct value that can be measured and justified for legitimate comparison purposes is the cost savings associated with accelerating software delivery value streams. Application developers, and others, can get more applications released faster because of DevOps, which has a dramatic effect on valuable cost reductions. The “investment” in DevOps projects is the denominator of the ROI ratio. To optimize ROI, simply increase return by getting more application releases out faster, while reducing the investment required for a DevOps project. Sounds easy enough. But wait! How do you do that?

    The primary factor in the return is derived from reducing bottlenecks. I have found, in more than half of the thousands of DevOps value streams I’ve studied, that the biggest bottleneck is testing! It is a myth that continuous testing is just the execution of automated tests. I am talking about the whole range of ‘testing things,’ including test strategy, test planning, test resource scheduling, test design, test implementation, test environment management, test execution, test results reporting, test result analysis, troubleshooting, fix, retest and test management. That is a lot! In fact, testing things are a source of bottlenecks for every stage of a DevOps pipeline, for all three ways of DevOps. The point is that ROI can be greatly improved by improving testing.

    As it turns out, the primary factor in reducing investment costs also has to do with testing! Putting ‘testing things’ in place is expensive in terms of labor and capital costs for both people and systems. The primary factor to reduce total investment cost is to standardize, share and use ‘testing things’ with as many application pipelines and stages as possible.

    What is the secret ingredient that I have discovered? After all, the importance of testing itself is not much of a secret. I have isolated the key ingredient that is the heart of all ‘testing things.’ The purpose of a test is to determine a verdict. A test verdict is the codified representation of a pass, fail or inconclusive result state of a test, assessed relative to the purpose of the test. Test verdicts are essential, no matter what kind of test it is; no matter the stage in the pipeline a test is used. Without a verdict, all the ‘testing things’ in the world are not valuable.

    So – the secret ingredient for optimizing DevOps ROI is to optimize test verdicts. Those that know how to optimize test verdicts hold the key to optimizing DevOps ROI.

    As I indicated in this eBook I authored for the DevOps Institute, verdicts from properly engineered testing at each stage in the pipeline are essential for assessing the artifacts produced in each stage.

    How Can You Optimize Test Verdicts?

    As I have pointed out in prior articles, well-engineered DevOps requires balancing the nine pillars of DevOps.
    Surprisingly, test verdicts play a crucial role in optimizing all nine pillars of DevOps, and are vital to accomplishing the best return for the least cost investment in DevOps. Here are some examples of how this works for each pillar:

    Leadership – Leaders tend to underestimate the importance that ‘testing things’ have on DevOps ROI, and that the central ingredient of test effectiveness is the optimization of test verdicts. By sponsoring DevOps projects and training programs that drive improved test verdicts, leaders will have a direct and lasting impact on ROI.

    Collaborative Culture – How often have you seen people wasting time arguing over the meaning and importance of a test? Collaboration between application developers and QA and Ops teams is more effective when test verdicts are clear and based on a common understanding of the purpose and importance of each test.

    Design – The creation of excellent tests, designed to efficiently resolve to clear verdicts during the design phase, makes for reusable test assets in all subsequent stages and releases, and can be reused with other applications.

    Continuous Integration – The validation of builds is faster when all integration tests are arranged to get clear verdicts quickly during the build process.

    Continuous Testing – Test verdicts associated with each test are the key information ingredient that test management systems can key off to optimize test selection and test execution for each stage in the continuous delivery pipeline.

    Elastic Infrastructure – Test environment management (TEM) systems can optimize the orchestration of test resources better when test verdicts are clearly understood. Knowing a history of verdicts for a group of tests indicate which resources and how much of each resource are needed to run each test. This knowledge is essential to drive test environment management systems that have scaling algorithms for optimizing the use of ephemeral test environments, and to ensure test resources are used optimally.

    Continuous Monitoring – Reporting and analysis of test results can be a major bottleneck in the pipeline, but can be dramatically accelerated when the test verdicts are clearly defined.

    Continuous Security – Security tests are not much use without a clear verdict. While there is no such thing as 100% security assurance, the aggregate set of security test verdicts helps to profile security for applications and releases.

    Continuous Delivery – Algorithms that govern the ‘doneness’ of an application release candidate, and decisions to promote a release to production, depend on analysis of service level objectives (SLOs) derived from service level indicators (SLIs), including test verdicts. The fidelity and quality of those verdicts is essential for operations and site reliability engineering (SRE) teams to be confident enough to not bottleneck an application release.

    What This Means

    Measuring and optimizing DevOps ROI requires strategies that deliver value by improving returns through reducing bottlenecks and reducing investment costs. ‘Testing things’ are a dominant factor contributing dramatically to both the return and investment components of the ROI equation. A comprehensive strategy for optimizing test verdicts is the secret ingredient for optimizing and leveraging investment in ‘testing things,’ which, in turn, has a dramatic effect on improving DevOps ROI.

  • 3 Practical Steps to Employing DevOps

    3 Practical Steps to Employing DevOps

    Everyone seems to be talking about DevOps but, if you are new to it, it might all seem a little overwhelming. One of the hardest things about DevOps is knowing where to begin. This is because to “do DevOps” its seems you have to suddenly start using a lot of new processes and tools at once.

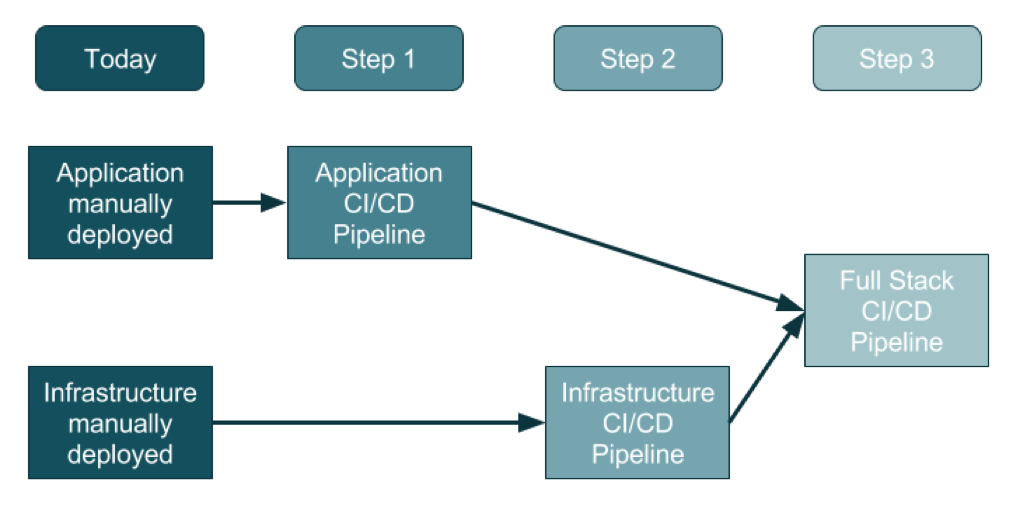
    For an organization that doesn’t use DevOps today, the adoption of this three-step method will promise a generally clean approach.

    Source: https://ukcloud.pro/

    Step 1: Creating the Application Pipeline

    Regardless of the type of application, the pipeline looks—at a distance—very similar. The goal is to weave application releases into a new coordinated process that looks something like this:

    1. The developer makes changes locally to their laptop/PC/Mac, and upon completion (including testing, etc.) issues a Pull Request.
    2. Code review kicks in, the developer changes are reviewed and accepted and a new release can be created.
    3. Someone, or the system, runs a procedure to create a release artifact, which could be a Java JAR file, a Docker file or any other kind of unit of deployment.
    4. Someone, or the system, copies the artifact to the web or application servers and restarts the instances.
    5. Database migrations/updates may be additionally applied, although the database is often left outside of the application release process.

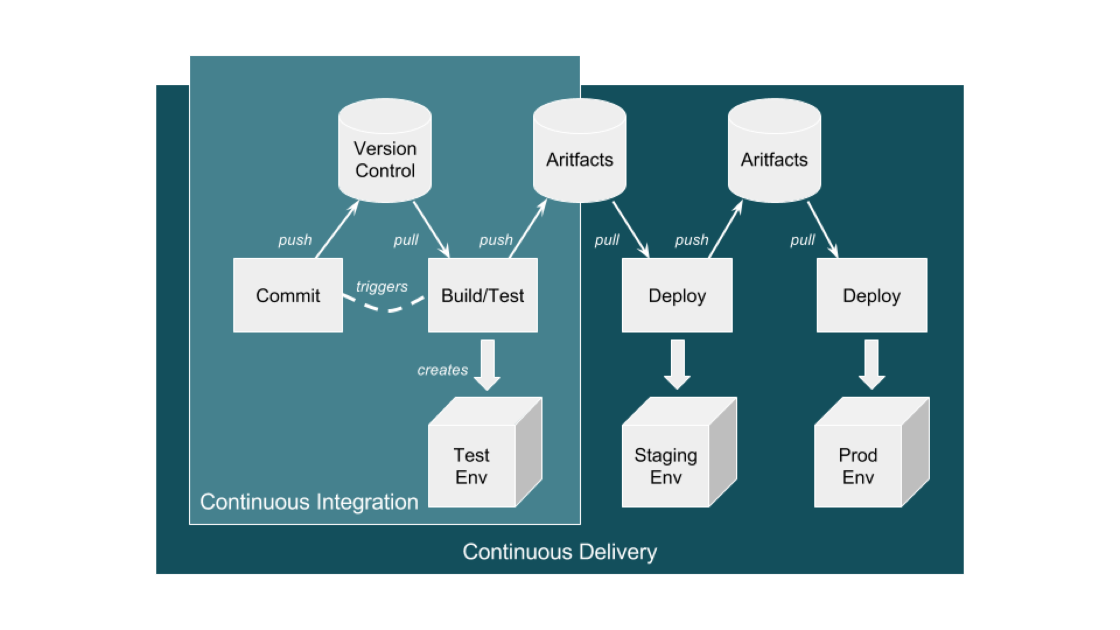
    This process evolves into an automated application-only continuous integration and continuous deployment (CI/CD) pipeline by using a toolset to automate the process as shown in the diagram below:

    Source: https://ukcloud.pro/

    A Typical CI/CD Pipeline


    However, be aware that this isn’t ideal (yet), because at this point the application alone is being released (injected) into existing environments.

    Why is this potentially an issue? If the developer has altered the local environment as well as the application but these local environment changes are not part of the release, then they’re not in version control. And, if they are not applied at the same time as the application, then the application will break and the common argument occurs: “Well, it works on my machine!” The solution is for application and infrastructure releases to be synced—and hence steps 2 and 3.

    Step 2: Creating the Infrastructure Pipeline

    Ideally, the infrastructure team has learned from the developer team’s DevOps and CI/CD pipeline journey and can expand and adapt it for the infrastructure (which increasingly is a public cloud).

    There are some differences with the infrastructure pipeline, specifically around units of deployment that are now the infrastructure layers in environments, the things that surround an application such as the DNS, load balancers, the virtual machines and/or containers, databases and a plethora of other complex and interconnected components.

    The big difference here is that the infrastructure is no longer described in a Visio diagram: it is brought to life in code, in a configuration file, in version control—this is infrastructure as code (IAC).

    Before this, a load balancer was described in Visio diagrams, Word documents and Excel spreadsheets of IPs and configurations. This is now swapped to describe everything about the load balancer in a configuration file.

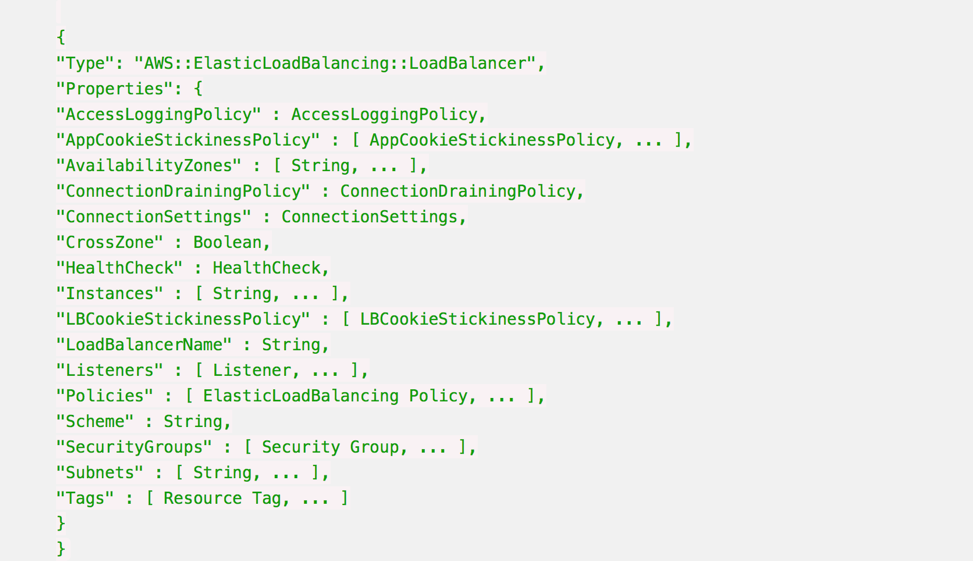
    Here’s an example AWS CloudFormation Configuration for a Load Balancer:

    Whenever this file is changed in Version Control, such as changing the subnets a load balancer can point to, then the automation engine can update an existing infrastructure environment to reflect that one change, and any dependencies that change.

    It also means that you can apply this template to multiple environments just by changing the environment name from staging to production, for example, and be very confident that all environments are consistent, from the developer laptop to production.

    It is also possible to make the templates dynamic to change their behavior according to the environment, so in production the environment will scale out across three datacenters, but on a developer’s laptop it will use a local VirtualBox single-system.

    Step 3: Creating the Full-Stack Pipeline

    The goal of a full-stack pipeline is to ensure that the application and infrastructure changes over time are in sync, both in version control and the release deployments across each pipeline stage. And a developer should never say, “It worked on my laptop!” when a release fails in production.

    The popular CI/CD tools can now automate the full stack because everything is programmable. This means everything can be captured in version control, and the same configuration can use dynamic input parameters to build an environment on a developer’s laptop, or a QA system in the cloud or updates to production.

    Imagine a developer makes an application change that also requires a change to the database, the web instance scaling configuration and the DNS. All of these changes are captured in one version control branch and the developer builds a system on their laptop from this branch, and tests it.

    This is what platform-as-a-service systems can do. By adding an environment configuration file inside the same code base as your application, you can ensure that you have bound your application to the infrastructure. 

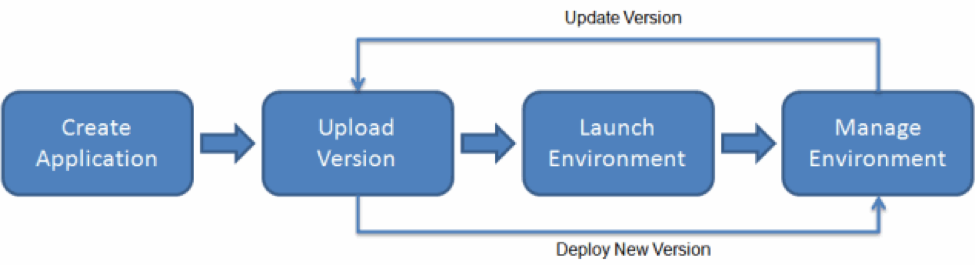
    AWS Elastic Beanstalk Example

    This is the target end goal, though it takes a lot of practice, and learning, to get there. It can be very satisfying to watch a build and a deployment, seeing the automation use tags and dynamic configurations to build, or update, the target environment with application and infrastructure changes.

    About the Author / Sarah Lahav

    Sarah Lahav is CEO of SysAid Technologies. As the company’s first employee, Sarah Lahav has remained the vital link between SysAid Technologies and its customers since 2003. She is the current CEO and former VP of Customer Relations at SysAid – two positions that have fueled her passion in customer service. Connect with her on LinkedIn and Twitter.