Tag: APM tools

  • Nobl9 Simplifies SLO Identification

    Nobl9 Simplifies SLO Identification

    Nobl9 today added a Replay capability to its service level objectives (SLO) management platform that makes it simpler to collect the historical data a DevOps team needs to get started.

    Nobl9 COO Kit Merker said Nobl9 Replay makes service level indicator (SLI) data instantly available in minutes using 30 days of historical data collected from observability and application performance monitoring (APM) platforms. Previously, DevOps teams would have had to wait as long as a month before the Nobl9 platform could collect enough spreadsheet data to create a graph that identified the relationship between various services.

    Nobl9 now enables historical data to be merged with data collected in real-time to allow DevOps teams to view SLO charts and generate reports shortly after creating an SLO within a Git-based workflow.

    Nobl9 is trying to spur greater adoption of SLOs by making available an open source SLO specification that defines a common interface for constructing them that has garnered support from Dynatrace, Sumo Logic and others. SLOs, of course, are not a new idea; they have been used as a metric to track the performance of IT services for decades. However, as more microservices-based applications are built and deployed, it’s becoming more challenging to maintain SLOs across applications that have many more dependencies than legacy monolithic applications.

    The Nobl9 platform is designed to enable DevOps teams to employ an SLO-as-code approach that makes it simpler to gather the metrics that confirm whether SLOs are being achieved.

    It’s not clear whether reliance on SLOs has waned over the years or if application environments simply became too complex to track meaningful metrics. A recent survey conducted by Dimensional Research on behalf of Nobl9, however, found a full 94% of respondents that have or plan to implement SLOs intend to map them directly to business operations, with 91% reporting they expect that effort to improve decision-making. More than 80% also said their organizations are planning to increase the use of SLOs, with 87% indicating SLOs should improve overall microservices performance.

    The issue is that most organizations have limited visibility into their IT environments. The survey found less than half of respondents (46%) had visibility into all their IT environments. Only 45% and 35% claim to have visibility into containers and microservices, respectively. More than three-quarters (78%) said hybrid clouds make observability more difficult, even though 45% said they already employed 11 or more observability and monitoring tools. Trying to track SLOs using tools such as Grafana dashboards that DevOps teams need to set up and maintain is simply too difficult, noted Merker.

    As applications are increasingly constructed using services that drive digital business transformation initiatives, it’s now only a matter of time before SLOs are more widely tracked. That will enable DevOps teams to not only ascertain their current level of performance but also more easily work toward achieving their actual performance goals, he added.

    The challenge is that defining an SLO in a highly dynamic application environment where services are added and replaced with much greater frequency is often a lot easier than maintaining it.

  • Lightrun Tool Now Debugs On-Premises Apps

    Lightrun Tool Now Debugs On-Premises Apps

    Lightrun today announced it has made its namesake debugging tools available for applications deployed in on-premises IT environments that, for one reason or another, can’t be deployed on a cloud platform.

    lan Peleg, CEO of Lightrun, said Lightrun is unique in that software teams can capture live production data from software installed on their customers’ sites via a set of command line interfaces (CLIs). That approach eliminates the need for the end customer to set up a separate environment to troubleshot an application, said Peleg.

    Instead, software teams can troubleshoot their software without requiring on-site visits by support engineers or even a phone call, Peleg said.

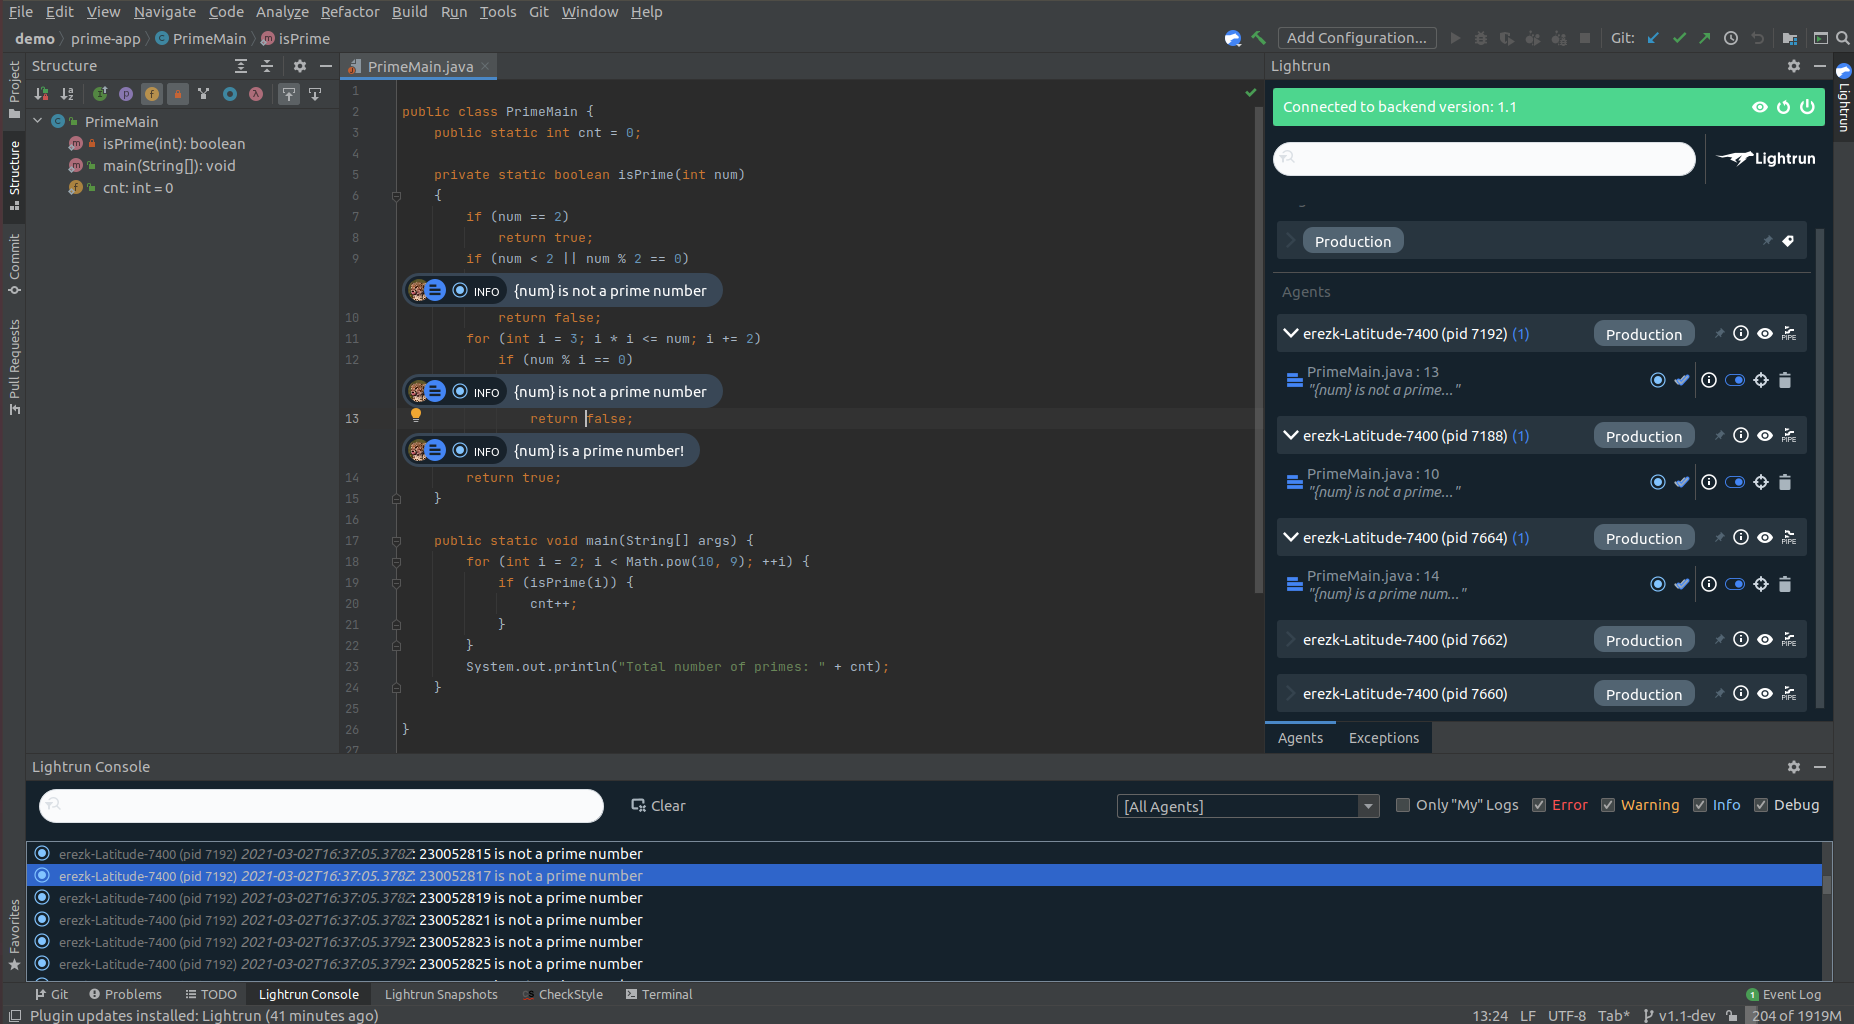
    Lightrun makes it possible to add logs, virtual “breakpoints” and metrics while an application is running. Those capabilities are critical because many applications are not fully instrumented. Lightrun makes it simpler to triage issues by adding a missing log line, instrumenting a new metric or taking a snapshot of an application as it runs in a production environment. Those capabilities make it possible to find bottlenecks and errors without requiring the application to stop running.

    The performance impacts of Lightrun range from tens to hundreds of microseconds per invocation to minimize overhead, Peleg said.

    In general, Peleg said, debugging applications is becoming more challenging. Monolithic applications continue to grow in size while emerging microservices-based applications have dependencies that make them challenging to debug. Many organizations are employing application performance management (APM) platforms and other observability tools to try and address these issues. However, those platforms require IT teams to continuously collect data, and even then there is no guarantee the insights needed to troubleshoot an application will be surfaced. Lightrun, conversely, makes it possible for developers to troubleshoot an application and capture the metrics needed in real-time. That data can then be shared with an APM platform to make it easier to address similar issues if required, Peleg said.

    As developers become more accountable for application performance, many of them are not going to want to employ the same tools and processes that IT operations teams have historically relied on. Lightrun provides a lighter-weight approach to troubleshooting applications, within the context of a DevOps workflow, that doesn’t require as much overhead, said Peleg.

    Although observability is a core DevOps principle, many organizations have been unable to achieve it in a meaningful way. There is no shortage of tools for monitoring IT environments, but correlating all the data those tools generate is problematic. It’s not uncommon for organizations to spend weeks trying to identify the source of an issue that only takes a few minutes to fix. Now that developers are assuming more responsibility for managing the entire lifecycle of an application it is likely different approaches to achieving observability will be considered.

    In the meantime, as the number of applications deployed in production environments continues to increase, different approaches to debugging software will be required. Otherwise, at the current rate of deployment, it won’t be long before developers find themselves spending most of their time debugging existing applications, versus actually writing new code.

  • Instana Expands Scope of APM Ambitions

    Instana Expands Scope of APM Ambitions

    Instana has launched a series of additions to its application performance management (APM) platform that reach into the realm of IT infrastructure as well as mobile and Java applications.

    Chris Farrell, technical director and APM strategist for Instana, said the company is adding support for VMware vSphere because more customers are converging their management of applications and IT infrastructure, thanks in part to the rise of DevOps practices. Many IT organizations are also simultaneously embracing emerging platforms such as Kubernetes to run microservices-based applications on top of VMware vSphere, he noted.

    Instana also recently added support for the Container Runtime Interface based on the Open Container Initiative specification, otherwise known as CRI-O, alongside existing support for Docker containers.

    At the same time, usage of Instana, which was created to focus mainly on emerging microservices-based applications, is expanding to include monolithic applications. As a result, Instana has added a free AutoProfile feature for Java applications based on tools it gained by acquiring StackImpact.

    Available in beta, AutoProfile attaches itself to the running process automatically with no restarts or reconfiguration required, to surface how specific pieces of code and associated bottleneck impact overall performance.

    Finally, Instana has also made available in beta an End User Monitoring of Mobile Applications module. That capability is also being made available at no additional charge. Troubleshooting mobile applications should become easier because Instana captures every single request made at the client by both the browser and the application.

    While adoption of APM platforms relative to the size of the IT market remains slight, Instana as a startup has been gaining traction at the expense of incumbent rivals. Instana claims it is now monitoring more than a half a million container and program run-time processes via its software-as-a-service (SaaS) platform, including hosts, containers, Java Virtual Machines, NodeJS runtimes and AWS Lambda functions written in PHP or Ruby. In total, Instana claims to also be gathering 1.5 billion metrics per minute, with more than a million application request traces being captured every second. New customers acquired in 2019 include Vivy, MacMillan Learning, TIpico, ExaVault and Avoris. Overall, Instana reports that its base of customers grew 150% in the last year.

    The Instana APM platform is designed from the ground up to automate application monitoring, including application discovery and mapping, monitoring sensor and agent deployment, and application infrastructure health monitoring. Instana is betting that the rise of microservices will not only require more organizations to rely on an APM platform to manage an increasingly complex application environment in real-time but also force many organizations that have APM platforms to reconsider their options when they discover how limited the visibility into containerized applications those platforms provide. At the same time, by adding support for VMware vSphere and making additional capabilities available for free, Instana is ratcheting up the pressure on rivals in 2020 further.

    Of course, it’s not clear there is anything approaching general dissatisfaction with existing APM platforms, so Instana may have its work cut out. Nevertheless, competition among providers of APM platforms has never been fiercer.

    — Mike Vizard

  • Survey Finds Much Room for APM Improvement

    Survey Finds Much Room for APM Improvement

    A survey of 317 application owners, developers and support team professionals in the U.S. and Canada published by SolarWinds finds that while reliance on application performance management (APM) tools is widespread, most IT teams are still relying on these tools to react to events rather than to proactively improve application experience and performance.

    The survey finds 9 out of 10 IT professionals are making use of APM tools that are either deployed on-premises or accessed via a software-as-a-service (SaaS) platform. Nearly 8 in 10 respondents spend less than 10% of their time proactively optimizing their environments, according to the results.

    In fact, the biggest APM challenges identified by survey respondents were lack of training for personnel (57%), followed by a lack of awareness of what APM solutions are currently offered (44%) and confusion over which APM solution best fits their needs (42%).

    Jim Hansen, vice president of products for application management for SolarWinds, said some of those challenges stem from the fact that there are too many APM tools to deploy and master. Survey respondents are employing a mix of database monitoring (64%), application monitoring (63%) and infrastructure monitoring (61%).

    IT management is further being complicated by the adoption of a wide variety of application architectures. According to the survey results, organizations are applying APM tools to manage monolithic (traditional on-prem) app development architectures (59%), N-tier service-oriented architectures (40%) and microservices-based applications (39%).

    Hansen said as organizations increasingly move away from monolithic applications, the need for a more proactive approach to APM across the full stack will become more apparent. The level of dependencies between microservices especially will drive organizations toward APM platforms capable of correlating events across both applications and the underlying infrastructure on which they depend, he noted.

    Less clear is to what degree IT teams are comfortable using the analytics surfaced by APM tools to automate the remediation of any given issue. According to the survey results 84% of respondents are confident in their ability to successfully manage application and infrastructure performance, with 40% reporting they are most comfortable from a confidence perspective to use APM tools to troubleshoot application performance issues. The top three insights survey respondents said they gain from APM tools are the ability to prevent application outages (73%), the ability to prevent app slowdown related to performance and/or capacity (63%) and the ability to improve user/customer experience (62%).

    In terms of areas for improvement, survey respondents identified improving their current skillset/ability to track impact across key business metrics (31%), followed closely by the need to improve their current skillset/ability to troubleshoot application issues (30%). The ability to improve the performance of application code and manage/ensure/improve end-user performance tied at 29%, respectively.

    Of course, troubleshooting an existing issue is one thing. Proactively using APM tools to prevent issues from occurring represents a more advanced approach to managing IT in keeping with best DevOps practices. It will be interesting to see how much the adoption of N-tier and microservices applications will foster further adoption of best DevOps practices.

    Most organizations today have embraced DevOps practices to varying degrees. However, as IT becomes more complex to manage in the age of the hybrid cloud it’s now only a matter of time before legacy approaches to managing IT as simply no longer practical to employ.

    — Mike Vizard

  • Four Ways to Modernize Processes and Measure Performance With APM

    Four Ways to Modernize Processes and Measure Performance With APM

    Change is everywhere and the stakes are high. For 2019, businesses are on track to spend over a trillion dollars on digital modernization, according to a recent study from IDC.

    A crucial part of modernization is the growing number of IT organizations using the latest in dynamic, cloud-scale technologies to develop applications. As a result, technology professionals in the businesses you serve must now work with a much more complex and dynamically changing tech stack.

    When building and maintaining an app, it’s becoming even more common to have hundreds (or thousands) of pieces of code in containers being continually reconfigured and brought in and out of production. And many of these operations take place in customer-facing applications.

    The stakes are high, because if something goes wrong operations could halt. It’s therefore vital to understand the underlying technologies throughout an organization’s IT environment to better equip customers with the tools needed to be successful. Application performance management (APM) tools that simplify stack management, whether it’s on-premises, hybrid or fully cloud-native, provide a level of visibility needed for modern businesses—and they work across multiple cloud environments, such as AWS or Azure.

    As a channel partner, you need to be prepared to help your businesses and their customers through this modernization process. 

    Try the following to help your customers modernize business processes.

    Help Them Realize Software Is Now Business-Critical

    As IT departments move from on-prem infrastructure and a mix of commercial off-the-shelf (COTS) and monolithic custom applications to increasingly adopted cloud-based Kubernetes microservices applications, they’re accelerating the adoption of software at the core of all their business processes. The result? Business is increasingly dynamic and responsive—new applications are built and delivered to market faster than ever. But companies are also at risk now when things don’t go well—that strategic app could degrade or fail.

    All the tech layers underpinning these applications are also becoming more sophisticated, dynamic and interwoven—and making it still harder to administer as they continuously change at an even faster rate.

    Focus Your Customers on Core Competency

    There are plenty of open-source tools out there for your customers to use to build their own monitoring. The biggest obstacle for businesses rolling out their own apps while using an open-source tool is core competency. 

    If, for example, your customer is a wholesale plumbing supply company, is their competency sourcing plumbing supplies or knowing how to write instrumentation code for all their plumbing supply chain applications? Help them focus on what they’re good at and give them tools to manage the rest.

    Perhaps you have a large financial services customer who is spending tens of millions, across multiple years, on a team of outsourced experts to write precisely the code required. This is an extremely time-consuming and costly effort, but financial institutions do this because their needs are highly specific and mission-critical, and the cost of not doing it is even higher. 

    If you look at real-time high-frequency trading environments—where billions of dollars are moved in matters of tenths of a second—you come to understand the stakes justifying these herculean efforts. All of which supports the need for APM tools to help empower the tech pros in-house who monitor and manage these high-speed trading environments.

    At the other end of the spectrum are the small tech companies with a new idea they’re out to promote. But when it comes to most companies, their core competency is often not monitoring and managing their infrastructure and applications. It’s understanding the market requirements for their custom apps and getting those apps to market quickly. At the same time, organizations of all shapes and sizes are still confronting the reality that to successfully deliver modern applications we must shift from pure infrastructure performance metrics to the KPIs that best demonstrate end-user experience.

    Ultimately, many of the organizations described above have either focused on IT as a core competency or, in the absence of dedicated tech teams (at SMBs, in particular), they have outsourced management of their complex, dynamic tech stack and custom application builds. In both instances, APM tools are a necessity and it’s prime time for the channel to deliver those services.

    Be the Most Viable Modernization Partner

    By understanding the needs of modern organizations as they grapple with their complex tech stacks, you can ensure you have the right set of tools for your customers. 

    Provide full-stack capabilities for today’s businesses to manage their applications and keep operations running smoothly. Cater to unique business problems and equip your customers with APM tools based on their needs—advanced logging, trace metrics, performance optimization and full-stack visibility across applications and the compute infrastructure on-premises, hybrid and cloud. Help them check all their functional boxes.  

    Measure Performance with Full-Stack APM

    In all cases, your customers should be measuring performance. Because every company uses a mixture of digital technologies, arming them with full-stack APM will help gain visibility into performance throughout the business. With APM, businesses can see if their system is degrading—and fix it before disaster strikes. That’s the business value for APM—it gives visibility into the complexity underpinning today’s application environments. Full-stack APM provides this visibility, whether the apps are cloud-based, on-premises or hybrid.

    But here’s the reality—not all APM tools are the same. Traditional APM solutions weren’t built for the environment IT departments now have, with the addition of containers and microservices-based applications to their existing monolithic and n-tier/SOA applications. Those solutions were made to manage hundreds or thousands of objects with slower rates of change, not the tens of thousands, or even hundreds of thousands to millions of objects IT works with today.

    Also, note the ephemeralness of container-based microservice applications able to live and die in a matter of seconds or less. There’s no time to automatically install a traditional agent, let alone do so manually. The container’s life span is shorter than the time it would take to do such instrumentation. Direct them instead toward a full-stack APM solution with complete coverage of all application architectures: monolithic, n-tier/SOA and microservices based. With anything less, they’re running at a higher risk of brand damage and revenue impact.

    By being the experts on APM, providing full-stack visibility and measuring performance, your customers will find modernization success.

    — David Wagner

  • Predictions 2020: The Future of APM Strategies and Tools

    Predictions 2020: The Future of APM Strategies and Tools

    As 2019 comes to an end, it’s safe to say that multi-cloud strategies are here to stay. We can predict that 2020 will bring an ever-increasing demand for application performance management (APM) tools and services.

    So what does the future of APM look like? Let’s dive in.

    Multi-Cloud Strategies Increase the Demand for APM Tool Adoption

    Companies are increasingly adopting more than one platform—either for financial leverage or to create a time-to-market or feature race between the platforms. To remain competitive, public cloud providers must offer unique features or capabilities differentiating them from competitors. This has created an upsurge in new and more complex technologies, increasing the need for APM tool adoption.

    Logs Will Be Recognized as Key Aspects of APM

    APM is a puzzle made up of user experience, metrics and traces, and logs—and each piece must be incorporated to achieve full-stack visibility and ultimately seamless app performance. However, a healthy app is not characterized solely by top performance, but also availability—making a log management solution that monitors availability, enables proactivity and reacts quickly to remediate problems key.

    In 2020, implementing solutions that achieve integrated application performance and availability management for any type of organization, including those operating on-premises and/or cloud-based applications across all mixes of cloud environments, will become increasingly important and prioritized.

    APM Skills in a Cloud-First World

    The nouns have changed, but the verbs remain the same: APM skills are among the top skills tech pros want to develop in the coming year, according to the recent SolarWinds IT Pro Day survey, Building Confidence for Tech Pros of Tomorrow. However, in 2020 tech pros will begin to recognize that many of the skills they already possess are sufficient to manage the new realm of integrated solutions in the cloud. Tech pros can leverage some of the same skills they could before as the nouns have changed, but the verbs remain the same. Where we used to have server or virtual machine, now we have containers. But the verbs? They’ve always been focused on optimizing performance, ensuring availability and planning capacity.

    In 2020, the extent to which tech pros will discover they don’t need to fear new nouns (more than they did when they moved from client virtualization) will increase.

    Universal Adoption of APM Tools

    As environments become more dynamic and complex, the opportunity for applications to break increases—creating the need for robust monitoring tools. In 2020, as buyers see the benefit of leveraging APM tools on a regular basis rather than only in critical moments, the market will adjust accordingly. We can expect easier-to-implement solutions that are more highly valuable and affordable. The paradigm that APM tools have to be expensive will be broken once and for all.

    Want to learn more about what to expect in 2020? Join us Jan. 23 for our Predict 2020 Virtual Summit  featuring discussions from some of the industry’s best and brightest offering up their visions for the future. Sign up today for this free daylong virtual event.

    — David Wagner

  • Application Performance Management for DataOps

    Application Performance Management for DataOps

    Over the years, application performance management (APM) tools have been utilized typically to measure and monitor the performance of software such as web applications. They do so by tracking such things as request response times and error messages, thus providing relevant data to be analyzed by the DevOps team, which then can make the appropriate changes to optimize their software. But what about the effectiveness of the data workflows that contribute to the functionality in many of the applications out there today? How can performance monitoring toolsets be extended to provide these workflows with opportunities for continuous improvement?

    Data Pipelines and Performance Challenges

    Below, I will discuss the use of APM tools in the context of DataOps. I will delve into the metrics and insights an APM tool must provide to engineers so they can support data pipelines efficiently, showing how the effective use of data-centric APM tools can provide extensive value to a DataOps team and their organization.

    Data Pipelines and DataOps Engineers

    A successful DataOps implementation requires creating automated data workflows that analyze large amounts of data quickly, while providing high-quality analysis as an end product. It’s easy to see how the job of a DataOps engineer can be a complicated one. It is their job to build and manage these pipelines to help the business achieve certain goals that rely upon the resulting data analysis. In other words, DataOps engineers are responsible for making sure high-quality data is made available as quickly as possible.

    Consider a common scenario with which we are all familiar: online shopping. With each purchase you make from a particular e-commerce website, the system typically provides recommended products for you to buy. This is often the result of a data workflow that produces data analysis for a recommendation system, which is then leveraged by the application to provide the end user with these recommendations. This pipeline is likely to be made up of several processes.

    These processes include those for loading large sets of raw data into a distributed file system for storing data across a cluster. This would be followed by several processes that need to run on this cluster to format and analyze this data to produce the quality data for the recommendation engine being leveraged by the web application. A lot is being done with large sets of data. And, as is usually the case with so much happening, there is also much that can go wrong.

    The Challenges in Managing Data Pipelines

    There are several major performance challenges that come with the management of the types of pipelines mentioned above. Below are a few of the common threats to data pipeline performance:

    • Scalability: One of the more obvious challenges when dealing with the construction of a data pipeline is scalability—in other words, the effectiveness and efficiency of the pipeline when it needs to deal with a much larger dataset. It’s likely when the jobs were written to deal with such data transformation and analysis that they were tested against smaller sets of data in development environments. What happens when this is no longer the case? Maybe now instead of processing a relatively small amount of data in a test environment, it needs to process much more as it runs in production. Will the processes still perform adequately to deliver quality analysis in a time-efficient manner?
    • Application Failures: Data pipelines rely upon parallel processing. But what happens when you experience the failure of one or more of these parallel-running processes that are executing to clean and analyze the data? This can throw a wrench in your ability to relay quality, complete analysis to the business unit. Being able to resolve failures quickly and get the pipeline back up and running plays a huge role in the success of a particular data workflow.
    • Fragmentation: Most data pipelines consist of a variety of tools that handle different tasks (such as ingestion, storage, processing, analysis, etc.). With so many different tools in the mix, pipelines can become fragmented. Tool incompatibility issues can arise and data formats can vary. It’s important to be able to unify data within the pipeline, even as it moves between disparate tools.

    APM Tools to the Rescue

    Manual vs. Automated

    Enabling DataOps within your organization requires continuous feedback and continuous improvement to your data workflows. A good place to implement these strategies is with the use of APM tools to help manage the performance of these pipelines.

    Consider the processes for improvement that occur without the use of APM tools. It would be on the IT and DataOps folks to locate performance-related problems manually within these pipelines and begin digging through log files to find the cause. A significant amount of time likely would be added to resolving these failures due to the lack of a centralized location to view this information, the lack of automated alerts to notify the team to these performance snafus and the lack of assistance in deriving insights from collected performance data. APM tools can provide an intuitive UI for debugging such issues and can provide the type of insights needed to detect and resolve these problems quickly.

    That being said, monitoring for big data processes is quite different from other types of application monitoring. Certain APM software will be better-equipped for dealing with data pipeline-related challenges than others. Much of this depends on the ability of the APM tool to integrate with the platforms and frameworks used within the data workflow, as well as the metrics the performance management software collects and utilizes to help the DataOps engineers refine their processes.

    What Types of Metrics Can Help Determine the Causes of Issues Within a Data Pipeline?

    Earlier, I discussed data pipeline performance challenges stemming from scalability issues and process failures. Let’s discuss what types of metrics should be collected to resolve issues like these in a data workflow.

    Before delving into the metrics, it’s important to note that having full-stack data is essential. By full-stack data, I mean not just infrastructure metrics (which are the most obvious type of metric folks tend to think about when managing data pipelines), but also other data points such as user data, application data and resource data. All this data needs to be unified and correlated across all systems in the pipeline to manage it effectively.

    Consider scalability, for instance. The APM solution you are using must be able to track several key metrics to help identify scaling-related bottlenecks within the data pipeline. These include:

    • The Amount of Data Being Processed: How can we identify a scalability issue without knowing how much data is being processed by a particular run? The answer: We can’t. Being able to quantify the amount of data being handled by each iteration of the data pipeline is the first step in detecting if the workload is the problem.
    • The Length of Each Run for Each Individual Process: The APM software being used by an organization must be able to integrate with the structure of the data pipeline to report the length of each run for each individual job running within the workflow. If a particular job was completed in one minute when processing X amount of data but took 20 minutes when processing 10X, then we have diagnosed a potential scalability issue and narrowed it down to the root cause in a time-efficient manner. Maybe the fix is as simple as tuning some SQL, and the scalability issue can be rectified in relatively little time.
    • Resource Utilization: Certain processes may require more resources than others to complete in a timely fashion. The ability of the APM tool to track the amount of resources being utilized by each process is key in determining if simply reallocating certain resources can fix problems with performance.

    Example issues:


    Unravel is an example of an APM tool that can track all the above while organizing the data within a user interface that provides DataOps engineers with just about all they need to diagnose data workflow performance issues from one screen. In addition, Unravel employs AI solutions to help take the metrics they collect and provide the engineers with specific insights as to how they can optimize their pipeline. This helps decrease the amount of time DataOps personnel spend on managing existing processes, allowing them to spend more time creating new processes to improve the quality of analysis being provided to the business.

    Conclusion

    APM tools are no longer solely for ensuring application availability. APM tools for big data, such as that from Unravel, have allowed for performance monitoring and analysis within data workflows, helping to ensure the availability of crucial, high-quality data analysis. Any organization looking to improve the quality of their data analysis processes should be looking to extend their APM toolset to include those for big data.

    This sponsored article was written on behalf of Unravel.

    — Scott Fitzpatrick