Tag: alerting

  • DevOps Chat: The State of Alerting & On-Call Survival for IT Ops, with OnPage CEO Judit Sharon

    DevOps Chat: The State of Alerting & On-Call Survival for IT Ops, with OnPage CEO Judit Sharon

    In this DevOps Chat we sit down with Judit Sharon, CEO of OnPage. OnPage has been providing alerting and incident management services primarily to the healthcare industry since before DevOps was called DevOps. As DevOps has exploded on the scene, the security and functionality built into OnPage was a perfect fit for IT Ops and DevOps teams. As a result, OnPage has expanded beyond its healthcare industry roots to become a very popular solution in the DevOps space.

    OnPage recently conducted a survey on the state of alerting in the IT Ops space. Judit gives us some insight into the findings, but you can download the full survey report at www.onpage.com/the-state-of-it-operations-ebook/.

    As usual, the streaming audio of our conversation is below, followed by the transcript of our chat. Enjoy!

    Alan Shimel: Hey, everyone, it’s Alan Shimel, and you’re listening to another episode of DevOps Chat. Today’s DevOps Chat is a really nice one that I think you’re going to enjoy. I have as my guest Judit Sharon, CEO and co-founder of OnPage. Judit, welcome to DevOps Chat.

    Judit Sharon: Thank you, Alan. Happy to join you.

    Shimel: Happy to have you here. So, Judit, let’s start off a little bit, as I mentioned, you were the founder and CEO of OnPage, but maybe some folks in our audience are not familiar with OnPage. Why don’t you give us a little bit of background on the company and how you came to start it?

    Sharon: Sure. So, OnPage is a SaaS based incident management platform hosted in a secure facility across the U.S., and in a nutshell, we—OnPage gives you visibility and feedback on incident status. You can track alerts, delivery, ticket status, and response, and it’s rock solid reliable. As one of our customers once said, it’s a must solution for those who need to elevate critical incidents.

    Shimel: Mm-hmm.

    Sharon: So, if I just go a little bit deeper, OnPage was built around the incident resolution life cycle to enable an organization to get the most out of their digital investment, ensuring that sensor and monitoring system have a reliable means to escalate urgent notification to the right person and immediately.

    So, you know, Alan, just a few years ago, when we wanted to come up with a product, all we needed to do is plan the product, develop, test it, and deploy it. That’s it. That was the end of it. Today, in the DevOps era, we also collect data. We use a special tool to collect data, to remove the noise. We calculate the data, we learn normal behavior, we predict anomaly, and we even attempt to correct it if possible writing a little script.

    So, we invest a lot in collecting this information, and as long as the process is working well, machine to machine communication is ideal. However, in the case of failure, disaster, or outage, when a technical person is needed, e-mail and SMS or even a phone call is not a sufficient means of notification, and OnPage is the best, most reliable solution to be used. And why? Because the technical person on call will get all the information right to their device, can start working on the incident immediately. If they’re not available, there are escalation rules that are pre-defined, and they can escalate it to the next person.

    Furthermore, in the event that the person did receive it and now they need help from a different person, from a different team—so, they don’t need to know who is on call in that team, all they need to do, they can forward the entire ticket, add some notes to it, and send it to the different organization. OnPage will send it to the right person on call and will escalate it within the next team.

    So, in one sentence, to summarize, OnPage automates the entire notification process to avoid human errors.

    Shimel: Yep. And Judit, I want to call out another not feature but characteristic in the history of OnPage. You know, we see so many companies that saw DevOps as a gold rush. You know, founders who say, “Wow, I want to start a company around DevOps,” and they build a tool for DevOps.

    Not the fact with OnPage. OnPage has actually been around for some time, and its mission dovetails nicely with DevOps but it’s not one of these Johnny-come-latelies trying to capitalize on how many people are searching Google for DevOps or something like that. Correct?

    Sharon: Right. So, we started about seven years ago. We started as incident notification, and actually, we started in health care. That’s why our solution is HIPAA-secure, something that is very unique about us.

    The other thing that we did, because we started in health care, was, we needed to alert until read. So, we are very unique in that, that we don’t just send you an alert, like send an SMS or an e-mail or send you just a push notification. We will alert consistently for eight hours to ensure that the message was delivered to the right person. And we have the audit trail, so now, accountability is a must. Now, we have the audit trail of who got it, when, how long it took to open the message.

    And another very nice feature other than the fact that we are HIPAA-compliant, so you know, we are secure, all the communication is secure at rest, and it’s encrypted in our database. We also save all the information for up to six years. So, other than the fact that we are HIPAA-compliant and other than the fact that we have the alert until read—we have other very nice features. Right now, there are a lot of companies, large companies mainly, that have a lot of systems and processes and sensors that sense just e-mail notification. And you will see from our study that we will talk about later, a lot of people are using e-mail notification for incident notification. And we just integrated those e-mails, and basically, you can leverage all the OnPage capabilities and elevate those messages if they’re important.

    Yeah, that’s what we do.

    Shimel: Sure, absolutely. And Judit, I wanted to kind of shift the conversation, if we will—if you will—to a larger topic, and that is sort of the state left alerting in the IT Ops world and the state of IT Ops. I know recently OnPage conducted a survey of IT Ops professionals. There’s been a few articles on devopsy.kinsta.cloud about it by Aura Lee,  love of your company as well as download the full report.

    But for those of our listeners who maybe haven’t had a chance to go on the site and check out the report—and we’ll put links to it in our show notes—can you talk a little bit about that, give us a little insight, here?

    Sharon: Yes. So, the state of IT operations, we conducted a study where we surveyed about 96 different companies, and the nice thing about that survey, we got a few people from each organization. So, we see the response from different levels of leadership. So, 20 percent were SVP or C level, 22 percent were directors, 34 percent were managers, and 24 percent were individual contributors. So, you see a nice distribution among the different levels in the organization.

    And the findings were—I mean, first, what did we want to look at? We looked at how teams are notified in critical incidents, how many alerts the team received, who received the critical alerts, and how did they get handled?

    So, the findings were really interesting. As I told you before, we found that 80 percent of the respondents said that they get notified via e-mail. You know, e-mail—the same e-mail that you get as junk mail, the same e-mail that you get on a regular basis—80 percent of IT get their notifications via e-mail. Which means they need to be on top of e-mail all the time. They’re always on, they’re never off. And I don’t know if you remember Target, they had some cybersecurity?

    Shimel: Mm-hmm.

    Sharon: Apparently they did get alerts, right? They did get notified, but they got notified via e-mail. So, three days later, they found the e-mail that they got notified. So, what OnPage says is, “Yes, you have processes that are sending e-mails. You can always change those processes and maybe extensively change the processes.” But why don’t you elevate those e-mails so they find you in case of emergency rather than you sit there and always, always check your e-mail?

    Another interesting point that we found is that 40 percent of IT teams get more than 10 alerts per day; 20 percent get more than 20 alerts per day. So, couple that with the fact that two-thirds of the respondents saying that they sent alerts to the team—so now, you don’t send alerts to one person, every alert gets sent to the entire team because they don’t want to miss the alert, right? So, what OnPage does, they say, “Okay, you get a lot of alerts. Don’t send it to the entire team. Send it to an escalation team, so one person will get it, and then always change who is the first one in line so the burden gets distributed.” So, you don’t get as many alerts, and you don’t—like, basically, the workforce, right, and the quality of their life, you don’t diminish it completely.

    So, that was just a few very, very interesting facts that we found about that demographic that we surveyed.

    Shimel: Yep. You know, Judit, I’d like to make a comment, but more of a question to you and get your advice, because this is an issue we deal with here at devopsy.kinsta.cloud, even. We have tried so hard to move off of e-mail as our primary communication, alerting, operational format. And we have tried. We’ve tried things like Slack and Chat and Google Chat and texting and I can’t tell you how many different tools we’ve given a try to. And yet, we keep coming back to e-mail.

    So, it doesn’t surprise me that many Ops people still rely on e-mail, with all the spam and all the noise to signal ratio problems there. What do you—for people listening out here in the same boat I am in—what’s your suggestion? What’s your advice?

    Sharon: Well, I think that e-mail is really good for audit trails, right? You want to know what happened, who said what. All the communication gets distributed to a distribution group—that’s fine.

    What we say is, when it’s critical, right—e-mails are okay for day-to-day communication. E-mail is okay, it’s actually for events or incidents that don’t need to be taken care of right away. So, those events that don’t need to be prioritized, they should go to e-mail. That’s absolutely true.

    What we say is, when there is an event that needs your attention immediately—and that’s another thing that I would like to go into are the costs, right? Those incidents that need to grab your attention immediately, those should be elevated. Those should find you rather than you always check your e-mail and always be on.

    Another interesting thing that we’ve found is, 12 percent said they are still using a pager.

    Shimel: Yeah?

    Sharon: And then we looked into those 12 percent, what vertical they come from, and we found that they come from the healthcare industry. Come to show you that the IT follows the technology implemented in the organization; they don’t kind of bring new technology for themselves. So, if the health care organization is using a pager, the IT organization of the same organization will use pager. Only with those who responded. We have a lot of customers, health care IT, that are using OnPage to elevate those messages.

    Another thing I want to get into is the cost, right? How much it costs. So, 99 percent of the organizations say that a single hour of down time costs them $100,000.00. So, every minute that we delay working on it and remedying the issue costs you about $1,670.00—every minute, right? You know, the counter is working, and we found that 62 percent of responders, it takes them 5 to 15 minutes to deliver an alert. Twelve percent said it’s more than 15 minutes to deliver an alert.

    So, here we see that just the delivery costs of the down time is between 8,000 and 25,000 per incident. Now, compare that to the cost of the solution. The cost of the solution is almost like a no-brainer. When we started the company and we pitched the idea, it was a quote—it’s a no-brainer. The cost is so miniscule in comparison to the cost of the lost time in delivering the alert to the right person and having the audit trail and having the reporting so you can afterwards go and even audit your team, make sure that everyone is accountable, that everyone is reliable.

    So, that was an interesting finding from this survey. Actually, we think it’s so interesting that we would like to run the survey in a different venue as well to try to get maybe a bigger audience, because this one was about 200 to 150 responders, but maybe if we can go on a larger scale and see if it’s working the same across all industries.

    Shimel: Sure. That would be fascinating. And I think—you know, it’s funny, I happen to be working on an e-book we’re writing on the state of DevOps in 2017, and I will tell you, there’s frankly not enough research being done and that’s available on these kinds of subjects, right? I mean, people are going more on kinda what their gut tells them on subjective rather than objective data.

    Sharon: Yeah.

    Shimel: And that’s always—you know, sometimes it works, but it’s always risky. So, I would encourage you to do that if you guys can, for sure.

    Sharon: Right. The other thing that we found that, you know, security became really, really important, like, this is top of mind for everyone. It used to be only health care, right, that cared about security and compliance, and now we go through one survey after another about our security policies from IT organizations, right? So, security becomes very, very important, and 40 percent of the responders said that encryption, even of alerts and messaging is very important for them. So, that’s another nice piece of information that we got from this survey.

    Shimel: Absolutely. Well, Judit, as I mentioned to you off mic when we were talking before recording today, the time goes really quick here. We’re already—we’re well past 15 minutes, so we’ll try to be respectful of our audience’s time, and maybe we can have you on for another chat to continue the discussion, maybe if you continue another leg of the survey.

    But thanks for being our guest on this DevOps Chat. I just wanted to end it, because I forgot to ask you in the beginning. For people who want to get more information about OnPage, where can they go?

    Sharon: So, of course, there is our website, www.OnPage.com. If you want a copy of this survey, it’s located at devopsy.kinsta.cloud, and there is another location on our website, OnPage.com/DevOps-ebook. A little bit more complicated than devopsy.kinsta.cloud, but we are going to publish another part of this survey, because we put the white papers in two sections, so part two is going to come up soon.

    Shimel: Great.

    Sharon: And I would love you guys all coming to look into what we do.

    Shimel: Okay! Judit Sharon, founder and CEO of OnPage, thank you for being our guest.

    Sharon: Thank you, Alan. Pleasure to be here.

    Shimel: Pleasure to have you here. Judit, we’ll see you soon.

    Sharon: Sure.

    Shimel: This is Alan Shimel for devopsy.kinsta.cloud. Thanks for joining us. Hope to see you soon on another DevOps Chat, and have a great day, everyone.


    — Alan Shimel

  • The State of IT Ops

    The State of IT Ops

     In our most recent article, we highlighted some of the results of our recent IT Ops survey. We noted, for example, that 80 percent of IT teams are alerted to critical events via email and 41 percent of teams are experiencing excessive alerts. These stats go a long way to explaining why IT Ops is experiencing so many issues with alert fatigue.

    In this article, we will delve into the second half of our findings and examine our results on how IT teams reported they handle alerts after they come in.

    Off Scheduler

    Efficient IT operations teams realize the need for directed action when critical issues come in. This means that when significant IT issues occur, efficient teams will have alerts sent directly to the on-call engineer, who can manage the incident most effectively. The engineer will be the individual who is best-equipped to manage and quickly resolve the issue at hand.

    Our survey however showed that most teams lack automatic schedulers which could ensure the correct individual is alerted. Rather, alerts are often sent to the team as a whole, or to individuals who are unable to resolve the issue. According to our statistics, teams are frequently alerted (67.3 percent) instead of the on-call individual.

    The impact of this poor workflow is not only that issues are sent to individuals who are unable to resolve them, but time is wasted by this very process. Ideally, team managers should invest in scheduling software that sends alerts directly to the engineer on-call. By sending it to the wrong individual or team, companies are adding fuel to the fire of alert fatigue and burnout.


    Related Articles:

    Site Reliability Engineering: How to Make the Operations Side of DevOps Actually Work

    Slack and Critical Alerting


    Unfortunately, our team also highlighted that most teams lack scheduling technologies to enable this outcome. Our survey highlighted that only 28 percent of teams use an automated scheduler to ensure the correct individual or team is alerted.

    By failing to use a system that ties alerts to on-call schedules, managers receive alerts via email, SMS or phone that they are not necessarily responsible for resolving. Managers then need to track down the on-call engineer who can manage the incident. The pain of this scenario is multiplied if the alert comes after-hours or during the night. Again, this workflow leads to significant delays in resolution time.

    No Time for Downtime

    As IT Ops are often tasked with issues such as maintaining server uptime or site uptime, the prospect of downtime is something engineers work hard to avoid. IT Ops are under significant pressure to maintain five-nines uptime.

    For this outcome to occur, teams need to automate menial tasks and ensure they are quickly alerted to complex downtime issues that demand their attention. The goal needs to be getting the issue as quickly as possible in front of the individual who is best able to resolve the matter.

    However, our survey showed that 45 percent of teams indicated it takes more than 10 minutes before IT teams even begin to resolve critical IT issues. Given that the cost of downtime is more than $5,000 per minute, according to Gartner, downtime can easily balloon to cost companies or their clients more than $50,000 in 10 minutes.

    The significant expense cause by downtime has been seen in many recent scenarios. For example, in mid-May 2017, British Airways had a spectacular downtime event due to the failure of a power system in the company’s data center. British Airways was forced to cancel all its flights leaving from London airports after having a major IT system failure. The result was cancelled flights affecting more than 75,000 passengers. The costs of reimbursement were approximately $68 million and a 2.8 percent drop in the stock price of the parent company.

    Failure to Collaborate

    In the world of DevOps and IT Ops, we are often told of the importance of collaboration and how it leads to great innovation. Indeed, the goal of DevOps is to bring developers and operations into closer proximity, so they can collaborate more effectively. Better collaboration means better innovation and decreased costs.

    However, our survey shows that while IT Ops might have the mindset for collaboration, they lack the necessary tools for ensuring that collaboration happens. Our survey showed that IT Ops teams often collaborate on tickets by email. According to the results of our survey, 86 percent of teams collaborate through email.

    Yet, email is a truly poor way to collaborate when critical incidents come up. Email has few ways to bring critical emails to the top of the stack and keep them center of mind. Instead, email’s default is to let messages get buried under other emails. In attempting to collaborate on key issues, email fails to offer rapid communication methods that highlight critical messages.

    Tools are available that enable better and faster communication among team members. Slack is a tool popular among many IT Ops engineers who are key drivers of effective collaboration. Yet, our survey showed that only 16 percent of ITOps use ChatOps as a form of collaboration during incidents. Slack’s motto is, it’s “where work gets done.” On their own, however, tools such as Slack lack a method for bringing important issues to the top. However, if attached to incident management systems such as OnPage, Slack and other tools like it can enable users to receive alerts that a critical issue needs to be addressed.

    Improving Workflow

    The goal of improving how teams handle alerts is to minimize downtime and improve efficiency. These shouldn’t seem like lofty goals. However, by not developing specific workflows that bring issues to the top and enable them to be resolved quickly, IT Ops teams are adding to the time until resolution and the ensuing cost.

    At its core, the lack of specific workflows and tools to enable improved workflow points to teams that have much room for improvement. IT Ops teams need to find better ways to manage day-to-day operations so that when critical incidents do arise, the path toward resolution is quick and doesn’t require engineers to embark on a guessing game.

    Conclusion

    Unfortunately, the state of IT Ops has not progressed to the level of maturity one would hope. There is still a lot of poor alerting and workflow practices that could be improved if a more robust incident management system were employed.

    There are a number of additional insights that can be garnered from our survey. I encourage you to take a moment and download a copy of the study and see what you can learn that will help your team.

    — Orlee Berlove

  • DataDog Announces APM. Why You Should Care

    DataDog Announces APM. Why You Should Care

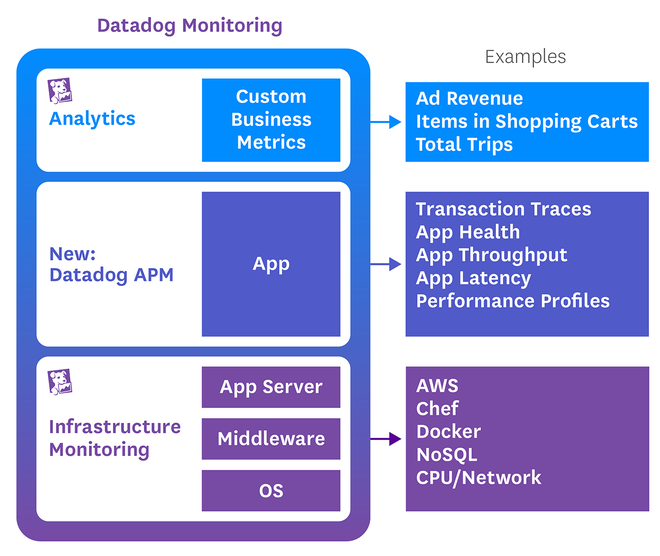
    In case you missed it, DataDog announced it has added application performance monitoring to infrastructure and business goal monitoring.

    1Part of my background includes a variety of clustered systems. First VMware, then OpenStack, Hadoop and its derivatives for a while, and these days the Mesos family. One of the many things I have learned along that journey is the inter-related nature of infrastructure and application. While we all know about that relationship, it goes further, I think, than most people recognize. A single degraded hard disk or loose network connection, which pushes work back out to the rest of the cluster, can drag an entire cluster to its knees.Since my time at F5 Networks taught me a metric ton about the nature of load balancing, I can say confidently that the same could happen to your load-balanced application.

    The biggest frustration for me in most multi-system configurations is the inability to track enough places to quickly diagnose the problem, because your application could be brought to its knees just as easily by a memory leak. But the logs are spread across multiple logs on multiple machines, between the hardware, OS, and software, and you generally have to go looking for more information. Even if you have some of the best tools in the business, you are still looking in multiple places to find information about one problem and having to do things like sort by time to correlate events between the systems.

    To be certain, other vendors are offering hardware/OS diagnostics with their APM. But DataDog’s approach, adding APM from the infrastructure side (rather than the more common reverse scenario), will offer different insights. So I’m interested in seeing how DataDog’s offering pans out.

    I obviously haven’t had the chance to play with DataDog’s new functionality, but it is a space that very much interests me and one we as an industry do need more work in. So just the fact that DataDog is integrating these three monitoring layers is important. From here, it has a platform for adding things (security monitoring? Inclusive root cause analysis?) or increasing the quality and quantity of across-the-application, metal-to-user information available to Ops and for alerting. In fact, it disappoints me that actual infrastructure isn’t a core part of the APM Conceptual Framework, because the hardware under the VM that is hosting the app server for your app really does matter when performance degrades.

    At a minimum, APM can help you get from problem to solution somewhat faster. If done well, it can alert you to the problem and show you where it is, helping you get from problem to solution even more quickly.

    — Don Macvittie

  • DevOps Without Scale, Part 2

    DevOps Without Scale, Part 2

    In Part 1 of this series, I covered why it’s important to be aware of your product’s health and how you can do so. I covered the user experience and technical types of metrics and how to get started with collecting them. In this part of the series I will walk you through how to use all these metrics to maximize the user experience and product uptime.

    Metrics, Metrics Everywhere

    There are no silver bullets here and you have to be aware continuously of your product’s health and how it fares against user expectations. It surely takes time and effort, but it’s an essential part of building a good product. Imagine if chair designers didn’t care for how people use their creations; those chairs would not be comfortable to sit in. Similarly, understanding user needs is a paramount part for any software engineer.

    Once you’ve established the basic understanding of your application patterns, you are not done. Every release is an opportunity to introduce more latency or failures and the baseline is ever-shifting. It is easy to significantly affect the latency and as easy to break an edge case and drive user failures up by a few percent with any release. The only way to ensure high-quality user experience is to be aware of your product’s health and your users’ expectations at all times.

    This is the case where less is more and users prefer fewer features that work and are responsive. Try it out and see what your users say!

    User Experience Monitoring

    The first part of a good user experience is low error rates. For web products, these include all http error responses as well as all application errors returned to the user. For APIs and GUIs, this includes application failures (and http errors for REST APIs). One recurring comment I hear is that users submit invalid input, which invariably causes error responses and so it should not count. It is certainly useful to be able to differentiate hard failures from bad user input, but the line is more blurred than you think. For example, a new release might change input expectations and previously valid requests can start erroring out. Is that bad user input or did you just break your product?

    In either case, if the failure numbers are high, users won’t be happy and you need to deal with this problem. The solution here can be non-technical: Maybe you need better documentation or user training, or maybe the API or UX design is cumbersome and drives misunderstanding and misuse. Whatever the case is, it must be addressed. Users are as likely to walk away from a cumbersome product as from a product that doesn’t work.

    As with everything else, I suggest that you identify a few high-level and most important parts of the product and keep track of those metrics. If you do notice an issue, then you have the more detailed metrics on hand for a deep dive.

    The other part of good user experience is performance, and the approach here is no different. Typically you need to track the latency of the same user actions as you’re tracking for failures. Performance tracking is where you really need to understand what’s acceptable and what’s not for your users and that depends on the domain and your users’ expectations. Two seconds to open a reservation on a public travel site seems like a long time, but two seconds to pull up a loan record for an internal user at a financial company is not bad.

    An important fact to remember is that you will always have some failures in the system and that’s normal. No matter how great your product is, how clear its documentation, and how in tune you are with your users, there always will be some failures caused by bad user interactions. At some point, once you feel good about your product overall, you will have to assume that the given error rate is your baseline. Then you need to pay attention to variation over time and revisit critically every once in a while.

    Predictive Monitoring

    In addition to user experience metrics, there are key technical metrics that are good to watch, as they can point to upcoming problems. Some of the common ones are CPU and memory utilization, thread and database pool sizes, VM heap size and garbage collection times. Just like with user metrics, you need to know the operational signature of your application. But in addition, you need to understand how changes in these metrics impact your users, if at all.

    A growing thread pool might mean that response times are slowing down or it could simply mean that more users are accessing your service. A growing email queue size means that emails aren’t going out as fast, but is it bad? Only knowing your domain and users will give you the answer. If the CPU is hovering at 80 percent everything is fine—for now, but you need to scale up quickly before a tiny addition of traffic kicks your whole app over.

    When tracking hardware metrics everyone pays close attention to overutilization because that’s what causes outages. But what about underutilization? Performance fluctuates up and down and at times you can find yourself underutilizing resources. Paying attention to this is a good way to stay frugal and keep costs in check.

    Alerting

    How do you actually know when something breaks? You can’t stare at the graphs all day long. Once you get a feel for the normal characteristics of your system, you’re ready to create automated monitors and alerts. One of the most important things about automated alerting is that it always must be trustworthy. The moment you and your team start getting false alerts, everyone will learn to disregard some of them and the the value of the system will plummet. Thus I recommend you start with auto-alerting only on several most critical metrics. Run the whole system for a few weeks and slowly add more metrics over time.

    Another aspect to be aware of when setting up automated alerting is metric variations over time, the most common one being day vs. night. Nobody wants to get paged because traffic is too low at 3 a.m. At the same time, if your metrics skyrocket or drop suddenly, it can be a cause for concern. Are you being DDoSed or scraped? Is there a network failure that’s preventing your service from being reached?

    Tooling to the rescue, DataDog has built-in capability to create alarms, called Monitors. They provide a few different ways to ensure no false positives. For example, instead of setting absolute thresholds, you can create a change alert that fires only on deltas. And adding a new monitor only takes a few minutes.

    Finally, someone needs to get paged out when an alert goes off. DataDog can do email notifications but nobody checks that at night and even during core hours it takes time to notice a new email. For critical issues like yours, someone needs to get notified immediately.

    Services like PagerDuty and VictorOps have made it trivial to do this. As expected, DataDog integrates with both of them natively. Both services support on-call rotation scheduling with an escalation policy, calling out to phones, text messaging, emails, and more.

    Production Troubleshooting

    So you’ve been alarmed and need to quickly figure out what’s going on and what to do. Your next stop is typically logs, but looking through log files one server at a time is a sure way to waste quite a bit of time.

    Log management tools and services have matured over time and there are good alternatives to Splunk. Loggly and LogEntries cover more than just the basics and provide indexing and search capabilities, graphing of log occurrence, understanding of JSON, and out-of-the-box integration with just about all logging frameworks out there. At their core they provide a quick way to look through all logs without having to go to individual servers. Moreover, you can monitor various aspects of logging à la DataDog and alarm (via VictorOps or PagerDuty) when metrics are off.

    The above approach already solves most needs, but I’d like to touch on a more advanced problem, especially for a microservice architecture. When multiple services are involved, finding the failure at the entry point is easy but figuring out which back-end service failed in the call chain while processing the user request can be quite difficult.

    An architectural pattern that I call log stitching solves this issue. With log stitching you can pull up all logs across your entire architecture for a given user request. This allows you to reconstruct the complete call chain and quickly find the root cause of failures. Conceptually this technique is straightforward: You generate a unique request ID at the entry point, pass it down the chain for every call, and log it. Now you can pull up all logs with that request ID by searching for it. In practice it can get complicated because you need to: a) ensure consistency across all calls, b) account for all entry points including batch jobs, and c) preserve the request ID internally in multithreaded services.

    Log stitching is not something I recommend from the get-go; however, it’s definitely something to consider as your system matures. If you are going down the microservices path, this really becomes a must since tracing call chains get progressively more difficult as the number of services grows.

    Putting it All Together

    There is not much development work in putting it all together, but nevertheless you will need to put in some time. I’d like to emphasize how important it is to work in iterations. Set up one to three alarms, connect your DataDog to VictorOps or PageDuty, study them for a couple weeks and then move on. Keep in mind that you will not get it right at first; your thresholds will be off and you will misinterpret or misunderstand system behavior.

    Operational pattern analysis is not trivial, but don’t spend too much time analyzing the hell out of everything up front. Configure some alarms, get them out there, learn and adjust as you go. When you find an alarm that went off erroneously, take some time to understand why. Specifically, you need to focus on why you thought it was the correct alarm setup vs. why you now know it is not. You will learn by leaps and bounds if you take this systematic approach.

    As I mentioned above, configuring Loggly or LogEntries is super easy and you should do that right away. Log stitching, however, is an involved endeavor that requires planning. Due to its nature it only becomes useful when adopted by all, or most, of your systems. Thus, you should only start it when you feel the need and when you have the buy-in from the rest of your development organization.

    What’s Next?

    Part 3 will cover the topics of continuous integration and continuous delivery, breaking them down into multiple stages of complexity so you can pick and choose what makes the most sense for you from the cost/benefit point of view.