Fresh off raising an additional $4 million in funding, OllyGarden founder Juraci Paixão Kröhling said a Minimum Viable Instrumentation (MVI) capability that has been added to the Rose AI agent the company previously developed makes it possible to identify the most relevant sources of telemetry data that should be instrumented using OpenTelemetry, an open-source framework for collecting that data that is being advanced under the auspices of the Cloud Native Computing Foundation (CNCF).
That capability extends the scope of an AI agent that was created to help DevOps teams reduce the amount of telemetry data they need to collect and store by identifying which logs, traces and metrics are the most relevant. The overall goal is to reduce the massive amount of telemetry data that DevOps teams would need to collect, analyze and store, said Paixão Kröhling.
The amount of telemetry data being collected naturally varies from one DevOps team to the next, but as more AI workloads are deployed the volume of that data continues to steadily rise. Aggregating all that data in a way that enables IT environments to be observed is quickly becoming cost-prohibitive for many DevOps teams.
The overall goal is to make it simpler for DevOps teams to calibrate the exact amount of telemetry data they need to observe an IT environment to ultimately reduce the overall level of noise that prevents meaningful signals from being fully understood, said Paixão Kröhling.
Specifically, the Rose AI agent continuously evaluates the quality of the telemetry data being collected, identifies issues, and then generates source-level fixes that DevOps teams can then apply. That approach prevents bad or irrelevant telemetry data from ever reaching a backend observability platform in the first place, noted Paixão Kröhling. Over the past year, OllyGarden claims to have helped DevOps teams identify opportunities to reduce telemetry data volume across up to 85% of their logs.
In theory, observability platforms will play a crucial role in enabling DevOps teams to embed AI agents within their workflows by providing them with access to telemetry data they can reason across. The issue is finding a way to reduce the volume of data being exposed to them to ensure those AI agents generate higher-quality outcomes at the lowest cost possible. Otherwise, DevOps teams are likely to discover that the cost of deploying AI agents will far exceed their available budgets.
It may be a while yet before most DevOps teams will be pervasively deploying fully autonomous AI agents across production environments, but at this juncture it’s more a question of when and to what degree than it is if. The fundamental challenge is first ensuring that AI agents are not reasoning across irrelevant data and then finding a way to validate the output they provide. Only then are DevOps teams going to trust AI agents enough to execute tasks with little to no supervision. Until then, AI agents that, by definition, are probabilistic will be relegated to performing tasks that, while reducing toil for DevOps engineers, still need to be closely monitored and verified at almost every step of highly deterministic DevOps workflows.
AI coding agents burn through resources in ways that are hard to see. A developer starts a long task in Claude Code, and the session quietly eats into a context window, a five-hour rate limit, a weekly cap, and a budget. Most of the time, nobody notices until something runs out.
An open-source project called Claude Statuspane takes a crack at that problem. Built by developer Anji Xu and published on GitHub under an MIT license, it adds a floating status card above the Claude Code prompt in the terminal. The card shows the active model and reasoning effort level, how much of the context window is in use, progress against five-hour and seven-day rate limits with reset countdowns, the current directory and git branch, and the session’s running cost.
It’s a small tool. But it points to a bigger issue for DevOps teams. As AI agents take on longer, more autonomous work, the people running them need the same kind of telemetry they already expect from build systems and production services.
Claude Code already supports a statusLine setting that runs a shell script and prints a single line of text. Statuspane goes further by using Claude Code’s new mod system, which lets plugins draw interface elements inside a terminal session. That system is still in early access, and the project’s README warns that the API may change between Claude Code releases.
Instead of plain text, the card uses gauges. A context bar might show 42%, or 222,000 of 1 million tokens. Bars shift to a warning color at 60% and an error color at 85%. A compact button sits next to the context gauge, so a developer can trigger /compact before a session hits its limit. The card follows Claude Code’s themes and collapses to a single button when it’s in the way. It requires Claude Code 2.1.287 or later and a terminal at least 70 columns wide. It doesn’t run in the Claude Code desktop app, which has its own status display.
The most useful feature for DevOps teams may be the GitHub CI integration. With the GitHub CLI signed in, the card can show the latest GitHub Actions run for the current branch. It checks every minute, and every 10 seconds while a run is active. A second option tracks runs triggered by a git push or gh pr merge and keeps them on screen for 10 minutes after they finish. The card shows whether a job is running, failed, or deployed, and how long ago.
That closes a loop that agents often leave open. An agent pushes a change, and the developer switches to a browser tab to see whether the pipeline passed. Putting build status beside the prompt keeps the human and the agent looking at the same result.
Statuspane also includes a simple progress API. Any script can write a small JSON file to a progress folder with a label, a percentage, a short text field, a time-to-live, and a state of running, ok, or error. The card watches the 20 most recently written files and refreshes every second. Rows disappear when their TTL expires, so stale jobs don’t pile up. Shell and Python helpers are included, and other mods can call the API directly.
The author also built in some sensible guardrails. The progress folder accepts only JSON files up to 64 KB, and it strips control characters, bidirectional marks, and zero-width characters from text fields. That matters. Anything that renders text inside an agent’s terminal is a possible path for injected content. Everything runs locally, and CI lookups use the developer’s own GitHub CLI credentials rather than a third-party service.
The project is brand new, has little adoption so far, and depends on an early-access API that a Claude Code update could break. Teams should treat it as an experiment.
But the idea behind it is sound. Usage-based limits and token costs are now part of daily developer work. A team that can’t see per-session costs can’t manage them. And as agents run longer jobs on their own, the human in the loop needs a quick way to see what’s happening without digging through logs.
Still, one developer’s view only goes so far. “Statuspane gives one developer a gauge, which is useful and stops short of governance,” said Mitch Ashley, vice president and practice lead for CIO & Technology Buyers and Software Lifecycle Engineering at The Futurum Group. “Agent deployment pace is set by what an organization can observe, control, and prove, and a personal status card shows a team none of those.”
Ashley said the real measure lies elsewhere. “The test is whether spend, limits, and pipeline outcomes per agent session can be collected centrally and audited. Watch whether agent platforms ship that telemetry natively.”
Expect more tools like this as coding agents become extensible platforms. Statuspane solves a real problem for the person at the keyboard. The bigger job for DevOps and platform teams is getting the same data into shared systems, where every agent session’s spend, limits, and pipeline results can be tracked and reviewed. Until agent platforms provide that, a personal status card is a useful start, not the finish line.
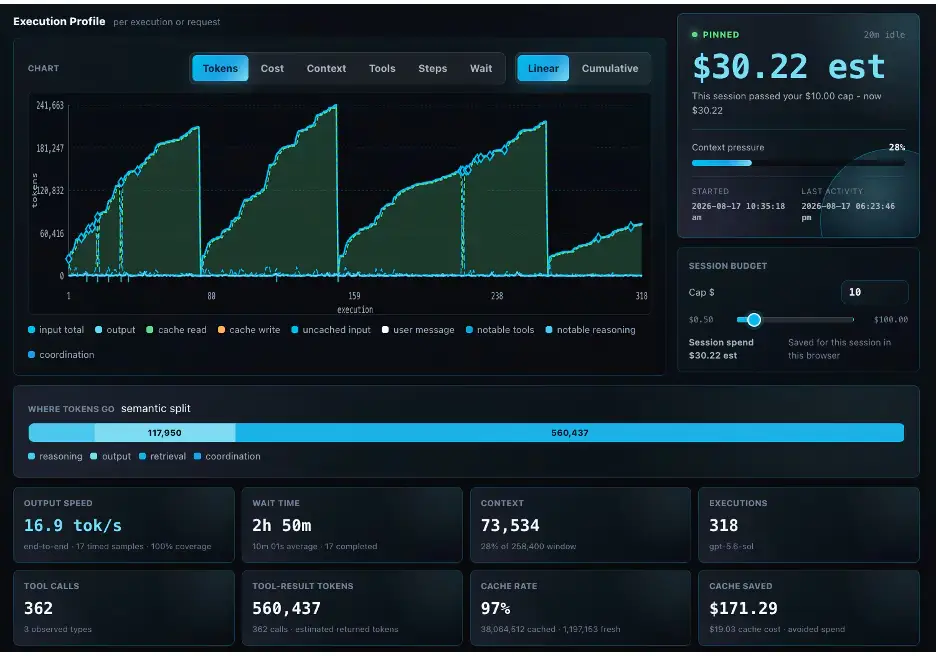
The Splunk arm of Cisco has made available an open-source tool that reads local Claude Code and Codex logs on a local machine to surface the live cost and activity of an artificial intelligence (AI) agent session.
Dubbed Token Meter, the tool reads the trace files an AI agent writes to disk and prices them against public model rates to help application developers become more aware of the cost of long-running sessions or tasks that could be performed using a less expensive AI model alternative.
Designed to run on Linux, macOS and Linux machines running Claude, Codex, Cursor, OpenCode, Kiro or Pi coding agents. Specifically, the tool surfaces output speed in tokens per second, the time the run spends waiting on the model, the split between fresh input and generated output and how much an AI agent handed back after a tool call.
Developers can also identify current, completed, or historical sessions using runtime, model, state and time filters in addition to tracing executions, events, tool activity, context growth, retries, failures, coverage, and warnings about session statistics. They can also compare tokens, estimated cost, timing, context, executions, and tool activity across agents, models, days, sessions, and tools.
A dashboard also keeps a timeline of raw events, a tools tab for stats on usage, an insights tab for derived signals, and an alerts tab for budget state. Token Meter will send a notification when a run crosses a threshold or the cost spikes. A read-only Model Context Protocol (MCP) server then makes it possible to pull that data directly into an AI coding agent.
In general, application development teams are trying to strike a balance between tasks that should be assigned to an AI model versus relying on some type of context engine to help reduce the number of tokens that an AI agent is likely to consume.
Hao Yang, vice president and head of AI for Splunk, said that as AI continues to advance, DevOps teams should be able to strike a better balance between consuming tokens and relying on platforms from, for example, Splunk to minimize consumption of tokens. Eventually, how AI agents access and process data will become much more federated as providers of AI model services look for ways to help organizations keep costs under control, he added.
While the cost of an individual token continues to decline, the volume of tokens being consumed has been exponentially increasing. As such, many organizations are now spending significantly more on AI than they initially intended. In fact, a recent Futurum Group survey finds that just under half of organizations are over their AI budgets.
In the meantime, DevOps teams will be tasked with reducing AI costs as application developers rely more on AI coding tools. The challenge, as always, is not solely reducing costs so much as it is ensuring the funds allocated to AI are actually being spent in the way that provides the most business value to the organization.
Enterprise AI agents need more than stronger models. They need durable execution environments that can coordinate multi-step workflows, survive failures, pause for human review and resume reliably after disconnects or delays.
AI Agents Have Moved Beyond Chat Demos
AI agents work beautifully in demos. A user asks a question, a large language model generates a response and everyone sees possibility. Production systems are different.
Consider what these systems are now asked to do. An agent assessing a change request may pull deployment history, evaluate blast radius, check freeze-window policy, wait for a release manager’s sign-off and then schedule the rollout. An agent adjudicating an insurance claim may extract fields from submitted documents, cross-check them against prior claims, apply underwriting rules and route anything unusual to a human adjuster. An agent triaging a security alert may enrich indicators, correlate against past incidents, assess asset criticality and hold containment until an analyst approves it.
Those three workflows have almost nothing in common at the domain level. They share a shape: Multiple steps, several systems, independent failure modes and at least one point where a person decides. They take minutes or hours, not milliseconds.
The challenge is no longer only intelligence; it is execution. Many enterprise AI conversations focus on model selection, prompt engineering, retrieval-augmented generation and tool calling. Those are important, but they do not answer what happens after the agent begins executing long-running work across multiple systems.
The Problem: Most Agents Are Still Designed Like Request-Response Applications
Traditional AI applications assume a simple request-response model: User input goes in; a model response comes out. That model works well for Q&A, summarization, content generation and search-like experiences.
Enterprise workflows are different. A procurement review agent might parse a contract, compare its terms against a standard template, check vendor risk ratings, invoke a sanctions screening service and produce a recommendation. These steps may execute independently, fail independently and complete at different times.
Once an agent crosses the boundary from answering a question to executing a process, it starts to look less like a chatbot and more like a distributed system. It needs state, retries, coordination, observability and recovery.
Why Stateless APIs Break Down
Teams often start by implementing an agent as a synchronous API. That approach works until the first real workflow appears. What happens if the HTTP request times out? What if the user closes the browser? What if an external system is unavailable? What if a human approval arrives six hours later?
A stateless API can initiate work, but it is a poor place to manage long-running state. Developers quickly end up building custom queues, status tables, retry logic, compensation logic and ad hoc workflow tracking. The hidden cost is not the first prototype; it is operating the system after it begins handling real workloads.
The missing layer is a durable runtime: A workflow engine that can preserve progress, coordinate parallel work, wait for external events and resume execution reliably.
Figure 1: The Same Multi-Step Workflow Under Two Runtimes
A stateless service holds progress in process memory, so a host failure discards completed work and the retry begins again from the first step. A durable runtime checkpoints each completed activity, so a replacement worker replays the history and continues from where execution stopped.
The Key Design Shift: the Workflow is the Application
The most important design shift is this: The model is not the application. The workflow is the application. The model is one activity inside a larger execution graph.
In production-grade agentic systems, the orchestrator coordinates work while specialized agents perform specific tasks. The specialization is domain-specific, but the division of labor recurs: One agent gathers and enriches raw signal, another retrieves reference material, another looks for precedent among prior cases and another evaluates policy or risk conditions.
This design makes the system easier to reason about. Each agent has a focused responsibility, and the orchestration layer owns execution flow, state, retries, progress and human interaction.
Using Durable Orchestration as the Agent Runtime
A practical architecture places a durable orchestrator between the calling application and the AI execution layer. The caller starts the workflow and immediately receives an instance identifier. The orchestrator then coordinates specialized agents and records progress as the workflow advances.
Azure Durable Functions is a strong fit for this pattern because it supports stateful workflows, activity functions, external events, checkpointing and long-running orchestration. Azure AI Foundry can provide the model and agent execution layer, while Durable Functions handles the operational execution semantics around the agent.
The result is a cleaner separation: AI services reason; activity functions perform work; the durable orchestrator governs the process.
Figure 2: The Orchestrator Between the Calling Application and the Reasoning Layer
It owns sequencing, retries, timers and external events. Specialized agents run on the model layer with narrowly scoped access and every completed activity is checkpointed so the workflow can be rebuilt after a failure or a process restart.
Fan-Out/Fan-In Maps Naturally to Multi-Agent Systems
These investigations are rarely one sequential task. Many subtasks can run independently. Enrichment, reference retrieval, precedent search and policy evaluation usually have no dependency on one another, so they can execute in parallel. This is where fan-out/fan-in becomes a natural orchestration pattern.
The orchestrator fans out work to specialized agents, waits for them to complete, and then fans in the results to generate a synthesized recommendation. This pattern improves latency while keeping the workflow easier to understand than a large monolithic agent prompt.
The fan-in step is also where engineering judgment matters. The system should handle partial results, conflicting findings and low-confidence recommendations rather than assuming every agent will succeed perfectly every time.
Example Orchestration Sketch: The sketch below triages a security alert; the domain is incidental. Rename the activities and the same orchestration serves claims adjudication or change-risk review.
Three details in that sketch are worth calling out. The external event is raced against a durable timer, so an approval that never arrives escalates instead of leaving the instance parked indefinitely. The timer is then cancelled on the success path, because a durable timer that is neither cancelled nor allowed to expire keeps the instance in the Running state long after the orchestrator function has returned. Since Task.WhenAll surfaces the first exception it encounters, genuine partial-success handling means having each activity return a typed failure result rather than throwing it once its retries are exhausted.
Human-in-the-Loop is Not an Edge Case
In regulated and high-impact workflows, human review is part of the process by design. A payment exception above a threshold, a production change during a freeze window, a claim falling outside underwriting rules: None of these should be finalized automatically when confidence is low or the consequences of being wrong are large. The important thing is to make human review part of the workflow rather than a side channel.
A durable orchestration can pause while waiting for a review event, then resume when the approver submits a decision. The system does not need to keep an HTTP request open or hold compute resources while waiting. The workflow state remains available, and the final recommendation can include the reviewer’s context.
This capability is especially important because the slowest step in a production workflow is often not the model call. It is the human decision, the external dependency or the operational handoff.
Figure 3: One Instance Over Time
Parallel agents make wall-clock cost the slowest agent rather than the sum of all of them; a failed agent degrades the result instead of failing the run, and the review window consumes no compute because the orchestration is parked rather than blocked.
Operational Considerations Matter as Much as Prompts
A durable runtime does not remove the need for engineering discipline. It makes that discipline easier to apply. Production-grade agents still need observability, correlation identifiers, retry policies, cost controls, security boundaries and careful versioning.
Workflow telemetry should answer questions such as: Which stage is running? Which activity failed? How many retries occurred? How long did human review take? What evidence supported the final recommendation? These are operational questions, not prompt engineering questions.
Retries should be designed around external dependencies such as AI model calls, search systems, databases and APIs. At the same time, not every failure should fail the entire workflow. Multi-agent systems should be designed for partial success where appropriate. If the precedent agent fails but enrichment and retrieval succeed, the system may still produce a useful recommendation with clear caveats.
Three constraints tend to surface only once a workflow reaches production. Orchestrator code has to stay deterministic, because recovery works by replaying it: Wall-clock reads, random values, fresh identifiers and direct I/O belong in activities, not in the orchestrator. Every wait needs a deadline, else an approval that never arrives becomes an instance nobody ever looks at again. Versioning deserves a decision before the first production deploy because long-running instances guarantee that new orchestrator code will ship while old instances are still in flight.
Security and Governance Cannot Be Bolted on Later
AI agents often sit at the crossroads of sensitive enterprise data, operational tooling and user-facing experiences. That makes security and governance foundational design concerns.
Each specialized agent should receive only the access necessary for its responsibility. A retrieval agent may need the document corpus and nothing else. An enrichment agent may need read access to telemetry. The agent that composes the final decision may need only summarized evidence, never the raw sources behind it. Avoid creating one over-permissioned super-agent that can reach everything.
Prompts and outputs should also be auditable. Store workflow version, prompt version, model deployment, agent version, evidence references and correlation identifiers. As agents become part of operational decision-making, teams need to explain not only what the system recommended but why it recommended it.
Figure 4: Scoping Access per Agent Contains the Blast Radius
A single agent holding every credential turns one poisoned input into estate-wide exposure, while narrowly scoped agents limit any single compromise to one agent’s data, with the synthesis step working from summarized evidence.
What This Means for DevOps and Platform Engineering Teams
The future of enterprise AI is not just better prompts. It is reliable execution. As agents become responsible for operational workflows, DevOps and platform engineering teams will need to provide runtime capabilities similar to those used in distributed systems: Orchestration, observability, resiliency, governance and deployment discipline.
This resembles the evolution of microservices. Early conversations focused on APIs. Later, the industry learned that production systems also require service discovery, telemetry, deployment strategies, circuit breakers and operational practices. AI agents are entering a similar phase.
Organizations that treat agents as production workflows rather than chat interfaces will be better positioned to build systems that users trust.
Conclusion
Most enterprises already have access to powerful foundation models. The harder challenge is building systems that can execute reliably when work spans minutes, hours, tools, services and human decisions.
Long-running agents of any kind need a durable execution layer. They need to coordinate multiple specialized agents, survive transient failures, pause for human review, provide progress visibility and generate auditable outcomes.
Azure Durable Functions and Azure AI Foundry offer one practical way to approach this architecture: Durable Functions provides orchestration and stateful execution, while Azure AI Foundry provides the intelligence layer. The broader lesson applies beyond any specific platform: Production AI agents need durable runtimes. Intelligence is only half of the system. Execution is the other half.
Anyone who’s ever been on an on-call rotation knows the feeling. A dashboard lights up green to red across a dozen services, an incident channel starts filling with theories and somewhere in that noise is one root cause hiding behind six symptoms that all look equally suspicious. Fixing the problem is rarely the hard part. Figuring out what the problem actually is- that’s where the time is spent.
So, when yet another vendor pitch promises that AI has solved this (point a model at your telemetry and it tells you what broke), part of me wants to believe it. Honestly, some of that promise is real. However, the more time you spend around incident response, the easier it gets to spot claims that skip past the hardest part of the job. Finding symptoms is easy; understanding causes is not. This is just my opinion on where that gap actually sits, and what it would really take to close it.
The Gap Between Correlation and Diagnosis
Look closely at what most ‘AI-driven root cause analysis’ tools actually do, and a pattern starts to show up. They’re very good at telling you that 47 alerts are all part of the same problem. They’re much less reliable at telling you what that problem actually is. Alert correlation, topology mapping, and noise reduction are genuinely useful capabilities that meaningfully reduce the time an engineer spends on triaging. However, grouping related symptoms isn’t the same thing as identifying a cause.
That distinction isn’t just semantics. It’s the difference between an engineer opening an incident channel to “here are the 12 things that fired around the same time” versus “here’s why they fired, in that order, and here’s what to fix.” The first still needs a human to do the actual diagnostic reasoning. The second means the system has built something closer to a real causal model, an understanding of how a change three services upstream produced a symptom two hops downstream, three minutes later.
Most tools on the market today are much closer to the first category than they’d like you to believe.
Sketching What Real Diagnosis Looks Like
If correlation is “these things happened together,” diagnosis is “this happened because of that.” Getting from one to the other isn’t just a matter of bolting on more dashboards. It’s a genuinely different process, and I think it’s worth actually sketching out instead of leaving it vague.
At a high level, a system capable of real causal diagnosis needs to move through like this:
The step that quietly gets skipped is testing causal direction. Does perturbing the upstream service actually explain the downstream symptom, or are the two just moving together? Most tools stop at correlation dressed up as causation, because that step is genuinely hard to build. Matching against incident history is where organizational discipline comes into play, since that knowledge base doesn’t build itself. The confidence check at the end, the part where the system is willing to say, “I’m not sure, escalate this,” is the one I’d trust least to actually exist in most tools being sold today. Uncertainty doesn’t make for a great product demo.
Where This Gets Harder: Non-Deterministic Systems
All of this is already hard for traditional infrastructure, where failure modes are at least somewhat bounded and repeatable. It gets a lot harder once AI and LLM-based components are part of the system you’re trying to diagnose.
The traditional signals SRE teams have leaned on for a decade (latency, traffic, errors, saturation), all assume a system that behaves the same way twice given the same inputs. A RAG pipeline or an agentic workflow doesn’t offer that guarantee. The same request can fail differently on different days for reasons that have nothing to do with infrastructure health: A shift in retrieved context, a subtle change in model behavior and a guardrail stepping in somewhere unexpected. A diagnostic system trained to reason about deterministic failure patterns will confidently give you the wrong answer here, and it’ll say it with the same tone of authority it uses when it’s right.
That’s the part that worries me most, honestly, more as a leader than as an engineer. An automated system that’s occasionally, confidently wrong isn’t neutral. It actively erodes an on-call engineer’s willingness to trust it, often for good, after just one bad call. Trust, once a team loses it in a tool, is brutally hard to earn back. It’s not uncommon to see decent tooling get quietly abandoned after exactly this kind of incident, and it rarely comes back into rotation once that happens.
The Human-in-the-Loop Argument, Restated
None of this is an argument against automating incident diagnosis. The toil is real, the pages at inconvenient hours are real and the case for AI assistance in incident response is a strong one. It’s an argument for being precise about what’s actually being automated, and for treating the postmortem, not the dashboard, as the real training ground for these systems.
A good postmortem is a structured record of a causal chain that a human worked out under pressure. That’s exactly the kind of data the ‘match incident history’ step in the flow above needs to work well. This is where leadership matters just as much as architecture. A team that treats postmortems like a checkbox exercise, written thin and fast just to close out a ticket, is quietly starving its own diagnostic tooling of the one input that would actually make it smarter. A team that puts real-time into writing specific, causally clear postmortems, even when it’s tempting to just write “flaky network” and move on, is building the training data for tomorrow’s automation. Whether or not anyone thinks of it that way in the moment.
This is one of the more underrated jobs of an engineering leader right now. It’s not about picking the right AI vendor; it’s about making sure a team’s own incident discipline is good enough to be worth automating in the first place.
A Practical Checklist
Before adopting or building automated incident diagnosis, a few questions are worth asking honestly:
Does this tool group related alerts, or does it actually explain why one caused another?
Can it show its reasoning in a way an engineer could defend in a postmortem review?
Does it work off the live dependency graph, or a stale architecture diagram from months ago?
How does it hold up on non-deterministic components, and does it know when to say “I’m not confident” instead of guessing?
Is there a feedback loop where past incidents actually improve future diagnosis, or does that knowledge just sit locked in a wiki page?
The teams that get real value out of automated diagnosis won’t be the ones with the fanciest model. They’ll be the ones who were already disciplined about turning incidents into institutional knowledge, and who are now feeding that discipline into the machine instead of hoping the machine invents it from scratch. That’s a leadership problem before it’s an engineering one, and I think it’s the one most of the current conversation keeps skipping past.
After years of exploring how AI can support agency operations and make better use of growing volumes of data, agencies are now preparing for the next phase: agentic AI.
The infrastructure needed is changing along with it. Agentic AI, unlike regular AI capabilities, can coordinate multiple specialized agents to carry out complex, multistep workflows, which means agencies are no longer planning only for the compute required to run AI models. They also have to account for the orchestration between agents, the movement of data across environments, and the points where human judgment still belongs.
That makes it important to start with the work itself—not the newest, shiniest technology. The following three strategies can help.
Start With the Workflow, Not the Hardware
Agentic AI is more sophisticated, but it also requires more orchestration and preparation. Consider a permitting process. One agent might evaluate municipal requirements while another examines state or federal statutes. A third agent—or a human—might then validate conflicting information before the process can move forward. The individual AI tasks are only part of the workload. The system must also coordinate those tasks, determine when one step depends on another, and move information between them.
That changes infrastructure requirements. AI environments have often been designed around compute-intensive model workloads, with significant attention paid to accelerators. But agentic systems can introduce substantial CPU and networking requirements as agents execute workflows and interact with one another.
Before deciding where to invest, agencies should map both the workflow and the data flow. Where will each agent perform its work? What information will it need, and where does that information reside? Which steps can occur simultaneously, which depend on one another, and where is human review required?
Those questions are especially important in hybrid environments, where data and workloads may span cloud and on-premises systems. An architecture optimized for one generation of AI can create new bottlenecks when multiple agents must coordinate across distributed environments.
Mapping the workflow can also reveal where agentic AI will and will not provide value. An existing 12-step process, for example, might contain five steps that agents can accelerate while others lack sufficiently accessible or reliable data to make automation worthwhile. The goal is not to insert an agent into every step, but to understand the process well enough to determine where autonomy can improve it and what infrastructure those agents will require.
Prioritize Resources With Observability
With more agents operating simultaneously, agencies also need a way to determine which workloads receive infrastructure resources first. Those priorities can reflect mission importance, deadlines, or operational requirements. A financial reporting workload at the end of the month, for example, might temporarily receive priority over a less time-sensitive optimization workload.
The underlying concept isn’t new. High-performance computing environments already use scheduling systems to prioritize workloads based on factors such as urgency and deadlines. As agentic AI develops, agencies must consider how similar principles might help automate resource prioritization more broadly rather than assuming there is already a mature playbook for doing so.
That depends on visibility. IT teams already collect telemetry such as performance metrics, storage information, and logs. In an agentic environment, that information may need to be readable not only by IT teams but also by the systems monitoring and coordinating autonomous workflows.
Consider what happens when an agent encounters a latency spike or another performance issue in the middle of a workflow. Instead of simply stopping, could it use performance or security telemetry to help determine what went wrong? Depending on the policies in place, the system could then recommend reprioritizing or moving the workload or escalating the issue for human review.
Design Around Data Movement, Not Rip-and-Replace
Agentic AI also puts new pressure on data architecture. Agents may depend on information residing across multiple clouds, local systems, and external data sources. Simply having access to that information does not mean an agent can retrieve it quickly enough—or in the appropriate form—to complete a workflow efficiently.
Agencies should map those dependencies to identify potential bottlenecks, from data cleansing and outdated external sources to latency when retrieving information from remote environments. Because agents often depend on one another, a delay in one step can affect the entire workflow. Understanding dependencies can also inform decisions about where data should reside and whether compute, networking, and other infrastructure resources align with agentic workloads.
But identifying a bottleneck should not automatically trigger the need for a new technology purchase. Agencies should first establish the “as-is”: What infrastructure, platforms, data sources, code, and capabilities are already available? What can be reused or consolidated? And where would a new investment fill a genuine gap?
That assessment matters because few agencies can (or should) replace their infrastructure every time the technology landscape changes. A stepwise approach allows them to target the most consequential bottlenecks, build on existing investments, and consider total cost of ownership as agentic AI evolves.
The infrastructure required for agentic AI will continue to change as the technology matures. Agencies don’t need to predict every requirement today. They do need a clear picture of their workflows, data, and existing environment so they can modernize where the mission actually demands it.
It was around 11 p.m. on a Thursday. Our AI support agent had been live for three weeks. Latency: Green. Error rate: Green. Then a customer DM landed in Slack with a screenshot — the bot had cheerfully invented a refund policy for a product we had never sold. Made up the SKU. Made up the rules. Returned a confident answer in 1.2 seconds.
Every SRE metric said the system was healthy. The system was lying to customers at scale, and we had no signal. That night I started building what I now call a production-grade eval system. This is the version I wish someone had written for me before that Thursday.
The Honest Problem
For 15 years, the SRE playbook worked because systems were deterministic — same input and output. LLMs break that contract. Your vendor can silently push a new model checkpoint on a Wednesday, and your agent develops a new personality. A re-indexed retrieval store can send ‘what’s your return policy?’ to a marketing blog post instead of the actual policy doc. None of those registers as a 4xx.
The result: Dashboards all green; product quietly degrading. Everything below exists to close that gap.
The Three Places You Must Evaluate
Most teams vibes-check their AI feature: A PM tries six prompts, says “feels good” and ships. There’s no regression suite, no quality baseline and no rubric. The right fix is to evaluate in three explicit places:
Most teams have Phase 1, sort of. Almost nobody has Phase 2. Phase 3 is where the screenshots-in-Slack live. If I could pick only one, I’d start with Phase 3 — it catches failures you didn’t predict. You need all three to call yourself production-grade.
The Four-Layer Evaluator Stack
There is no single quality metric. What works is layers — cheap checks at the bottom, expensive judges at the top — with sampling upward.
Layer 1 (deterministic code) runs on every trace — free. Layers 2–3 run on a sampled subset; LLM judges cost real money and will eat your budget if you let them run inline. Layer 4 (domain checks) runs with humans in the loop — slowest, most valuable.
The Flywheel: Where Good Evals Come From
Nobody hands you a good eval set. Vendors sell generic benchmarks that score 95% on your system because they test nothing customers care about. Real evals come from your own production failures.
Pull production traces — bias toward anomalies, low-confidence scores and customer complaints.
One person labels them — consistency beats coverage. Two labelers create noise that looks like signal.
Cluster failure modes — hallucination? tone? wrong tool call? Each mode needs its own judge.
Promote failures to regression tests — the failure can never happen silently again.
When you lack data, generate only inputs synthetically, then run your actual application on them. Never let an LLM generate both sides — you’ll get a data set that scores 99% and means nothing.
RAG: the Three Metrics That Matter
If you’re running retrieval-augmented generation — and most of you are — every interesting metric is a relationship between the question, the retrieved context and the generated answer.
Retrieval Tier: Context precision and recall. If this is broken, nothing downstream matters. Start here.
Core RAG Tier: Faithfulness (model stays grounded in context) and answer relevance (model answers the actual question).
Diagnostic Tier: Citation accuracy, noise sensitivity, per-chunk hallucination rate. Run these on investigations, not alerts.
Guardrails Vs. Evaluators
This confusion causes more bad architecture than anything else I see in production AI today.
Keep them in separate code paths. Draw them in separate boxes on your architecture diagram. A guardrail that takes three seconds is a broken product. An evaluator that takes three seconds on 5% of traffic is healthy.
The Production-Readiness Checklist
If someone asks me whether their AI product is ready for production, I walk through this list:
Golden regression data set — in the repo, version-controlled, owned by a named human.
CI eval gate — blocks merges when quality drops on any PR touching prompts, retrievers or model config.
Online evals on sampled production traces — at least Layers 1–2 on every span.
LLM judges validated against humans (Cohen’s kappa >0.7), re-validated on every model upgrade.
Weekly annotation session with a written agenda — not random sampling.
Pinned model versions for production model and judge model. Vendor upgrades are deploys.
Guardrails and evaluators in separate code paths.
Someone whose job is to turn findings into roadmap items.
The Mindset Shift
Reliability for AI is not measured in uptime, it’s measured in quality of output over time. The dashboards your SRE team already built are necessary but no longer sufficient.
The new layer is the eval system — multi-tier, fed by an error analysis loop, wired into CI and live traffic, with calibrated human-in-the-loop judges. Build it, and AI stops being the system your team is scared to put on the on-call rotation.
That Thursday night was almost a year ago. We haven’t had another one like it. The dashboards are still green — and now I know what green actually means.
At 2 a.m., a payment service starts throwing errors. Within minutes, your observability stack fires off 40 alerts: Elevated latency on three services, a spike in 5xx errors, a memory warning on a downstream cache and a handful of dependency timeouts. Somewhere in that noise is the one signal that actually explains what broke. Finding it manually, alert by alert, is how a 5-minute fix turns into a 45-minute outage.
This is the core problem AIOps was built to solve — not more dashboards, not more alerts but correlation. By automatically grouping related signals across metrics, logs and traces, AI-driven correlation collapses an alert storm into a single, prioritized incident with a probable root cause attached.
In this guide, you’ll learn how incident correlation actually works, how to set it up on top of your existing observability stack and how to measure whether it’s actually reducing your mean time to resolution (MTTR). By the end, you’ll have a practical framework for moving your team from manual alert triage to AI-assisted incident response.
Why MTTR Breaks Down Without Correlation
MTTR is typically broken down into four phases: Detection, triage, diagnosis and remediation. Most teams invest heavily in detection — that’s what observability tooling is good at. The bottleneck almost always sits in triage and diagnosis, for a simple reason: One root cause typically produces many alerts, and someone has to manually figure out which alerts belong together before the diagnosis of the actual problem can even begin.
A few patterns show up repeatedly:
Alert storms mask root cause. A single upstream failure can cascade into dozens of downstream alerts, each looking like an independent incident.
Signals live in silos. Metrics, logs and traces often sit in different tools or dashboards, so the engineer on call has to manually stitch together a timeline.
Tribal knowledge bottlenecks diagnosis. The person who ‘just knows’ that a cache-eviction warning usually precedes a checkout failure isn’t always the person on call.
AI-driven correlation directly targets this middle stretch of the incident life cycle — the time between ‘something is wrong’ and ‘here’s what’s actually wrong’ — which is usually where the most time is lost.
Prerequisites
Before you begin, make sure you have:
An existing observability stack producing metrics, logs and traces (StackGen’s ObserveNow or a Prometheus/Grafana/Loki/Jaeger-style setup)
Alerting already configured on key services, even if it’s currently noisy
Admin access to configure integrations and correlation rules
At least one recent incident with alert history you can use to validate correlation output
Estimated time: 30–45 minutes for initial setup, plus 1–2 weeks of tuning based on real incidents.
Step 1: Connect Your Observability Stack
AI-driven correlation is only as good as the data it can see. If your metrics live in one tool, logs in another and traces in a third with no shared identifiers, correlation has nothing to work with.
Start by making sure your telemetry shares common context — service name, environment and ideally a trace ID or request ID that threads through logs and traces.
# Example: Shared labeling convention across metrics, logs and traces
service: checkout-api
environment: production
trace_id: “{{request.trace_id}}”
If you’re using ObserveNow, connecting metrics, logs and traces into a single pane is largely a matter of pointing your existing Prometheus, Loki and Jaeger (or equivalent) instances at it — StackGen integrates with these directly rather than requiring a rip-and-replace.
Expected Result: A unified view where a single service’s metrics, logs and traces are queryable together, ideally with a shared identifier connecting them.
Troubleshooting: If correlation later feels inaccurate, this is almost always the first place to look — inconsistent service-naming or missing trace propagation breaks the AI’s ability to link signals correctly.
Step 2: Configure AI-Driven Correlation Rules
With unified telemetry in place, the next step is telling the correlation engine what ‘related’ should mean for your environment. Most AIOps platforms, including Aiden AI Copilot, combine two approaches:
Topology-Aware Correlation: Using service dependency maps to group alerts from services that call each other
Pattern-Based Correlation: Using historical incident data to learn which alert combinations tend to co-occur
# Example: Correlation policy
correlation_policy:
time_window: 5m
group_by:
– service_dependency
– shared_trace_id
confidence_threshold: 0.75
The time_window matters more than it looks. Set it too short and you’ll miss slower-cascading failures; set it too long and unrelated incidents start getting merged. Five minutes is a reasonable starting point for most microservice architectures — narrow it down if your services are tightly coupled with fast failure propagation, widen it for slower, more decoupled systems.
Expected Result: Incoming alerts are grouped into incidents rather than arriving as isolated tickets.
Troubleshooting: If everything gets grouped into one mega-incident, either your confidence threshold is too low or your time window is too wide. Tighten both and re-test against a known incident.
Step 3: Test Against a Real Incident
Don’t wait for a live outage to find out if your correlation setup works. Pull the alert history from a recent real incident and replay it against your new configuration.
Ask three questions about the output:
Did the correlation engine group the alerts that actually belonged together?
Did it surface a root-cause candidate that matches what you now know actually happened?
Did it leave out anything that should have been included or wrongly include something unrelated?
This is also where Aiden/AIOps automated root cause analysis is worth validating directly. It should be able to point to the earliest anomaly in the correlated group and rank likely causes, not just group alerts together and leave the analysis to you.
Expected Result: The correlated incident matches (or comes close to) the retrospective understanding of the incident, with the root-cause candidate ranked at or near the top.
Step 4: Monitor, Tune and Automate Remediation
Correlation isn’t a one-time setup. It improves while identifying more of your real incident patterns. Over the first few weeks:
Review every correlated incident and confirm or correct the grouping.
Watch for recurring false groupings (two unrelated services that keep getting merged) and adjust topology mappings.
Track false-negative correlations — alerts that should have been grouped but weren’t.
Once correlation accuracy is consistently high, you can layer-in automated remediation for well-understood incident patterns — for example, automatically restarting a service instance when a specific correlated pattern (memory leak signature + latency spike + no recent deploy) is detected with high confidence. This is where Aiden for SRE typically comes in: Using the correlated, root-caused incident as the trigger for a pre-approved remediation action, rather than waiting for a human to read the alert and act.
Expected Result: A shrinking gap between detection and remediation, with routine incident patterns increasingly self-resolving.
Testing Your Setup
Before trusting correlation in production, run it through a structured validation pass:
Replay 3–5 historical incidents of varying severity and complexity.
Compare AI-correlated groupings against what your team determined manually during the actual incident.
Check root-cause ranking accuracy — was the true cause in the top 1–2 candidates?
Confirm the time to first correlated alert is meaningfully faster than your team’s manual triage time.
If correlation accuracy is inconsistent across incident types, it’s usually a sign that your topology mapping is incomplete for certain services, which is why it is worth revisiting Step 1 before adding more correlation rules on top of gaps in the data.
Real-World Results
Teams that move from manual alert triage to AI-driven correlation typically see improvement concentrated in the triage and diagnosis phases specifically, since that’s the part of MTTR correlation is designed to compress:
Alert Volume per Incident: Often reduced from dozens of individual alerts down to a single correlated incident
Time to Root-Cause Identification: Meaningfully faster when root-cause ranking is accurate, since engineers stop manually cross-referencing dashboards
On-Call Burden: Fewer distinct pages per incident, since related alerts are grouped rather than firing independently
Your specific numbers will depend heavily on how mature your topology mapping is and how much historical incident data the correlation engine has to learn from — treat the first few weeks as a tuning period, not the final benchmark.
Next Steps
Now that you have AI-driven correlation running, you can:
Traditional application observability was built around a simple mental model: Your code runs, metrics come out and when something breaks, the logs tell you why. Large language models (LLMs) break that model in ways that are not obvious until you have shipped one and watched it misbehave in production.
An LLM-powered application can be up, serving requests, returning HTTP 200 responses and still be failing catastrophically — producing hallucinated content, silently truncating outputs, drifting toward unsafe responses or degrading in quality because the model provider quietly updated the underlying checkpoint. Standard infrastructure monitoring tells you nothing about any of this.
Over the past two years, I have built and operated a production LLM application that processes tens of thousands of requests daily. The observability stack I run today is substantially different from what I started with, and most of the changes came from incidents I could not have anticipated without experience. This article shares the architecture and tooling that actually work — not the theoretical monitoring stack, but the one running right now.
Why LLM Observability is Different
Conventional APM tools track latency, error rates and throughput. These are necessary but not sufficient for LLM systems. The failure modes that matter most are semantic, not structural.
A conventional API returns a well-typed response or throws an exception. An LLM returns a string. That string might be exactly what you asked for, a plausible-sounding but incorrect answer, an output in the wrong format that breaks a downstream parser, a response that violates content policies or a truncated completion because the context window was exceeded silently. None of these show up as an error in standard monitoring.
Four distinct problem classes in LLM production require dedicated observability signals, and each needs a different instrumentation approach.
The Four Problem Classes
Problem Class 1: Quality Drift
The output quality of your application degrades over time, usually for one of three reasons: The provider updated the underlying model, your prompt encountered input distributions it was not tested against or a downstream change altered the context your LLM receives. Quality drift is invisible without a baseline to compare against and a measurement approach that is not purely human-reviewed.
Catching this requires automated evaluation: A set of representative inputs with expected outputs or rubrics, run on a schedule against production traffic samples, with scores tracked over time. The signal is not a single evaluation run but the trend line. A sudden drop in average score on the evaluation set is an early indicator of a problem before users report it.
Problem Class 2: Prompt Failures
Prompts are code. They can fail due to inputs that the prompt was not designed to handle: Unexpected languages, edge-case formatting, adversarial inputs or simply unusually long inputs that cause important context to be dropped. Prompt failures often look like partial successes: The model returns something, but it is wrong in a way that requires domain knowledge to recognize.
Catching these requires logging full prompt-response pairs (with privacy handling for PII), tagging the output with structured metadata about the result type and sampling enough traffic for human review to catch failure patterns. Pattern-based prompt failures often affect a narrow slice of inputs and will not show up in aggregate metrics.
Problem Class 3: Cost Anomalies
LLM API costs are token-based and can spike unexpectedly. A bug that causes your application to include a large context document in every request, a prompt template that grew too large or a change that triggers a multi-turn conversation where a single-turn was expected can multiply your token consumption by 10x overnight. By the time the billing statement arrives, the damage is done.
Cost observability requires token-level tracking per request type, not just total spend. You need to know the average token count for each workflow, see that number in real time and alert on anomalies before they accumulate into a large bill.
Problem Class 4: Latency Degradation
LLM API latency is variable in ways that server-side APIs are not. Time to first token and total generation time depend on server load at the provider, prompt length, output length and model family. Latency can degrade without any change on your side and without the provider posting a status update. Monitoring p50 latency is insufficient — LLM latency distributions are fat-tailed, and p95 and p99 are where user experience breaks down.
The Minimal Instrumentation Stack
You do not need a commercial observability platform to get meaningful LLM monitoring. The following instrumentation can be built into any application in a day, and it covers 80% of the failure modes that matter in practice.
This structured log record is the foundation of everything else. It gives you the data to compute per-workflow cost trends, latency distributions and finish reason breakdowns (how often does your model hit the token limit instead of reaching a natural stop?). Finish reason analysis alone will surface truncation issues that users notice but that look fine in error rate dashboards.
Step 2: Track Finish Reasons Explicitly
The finish_reason field is one of the most underused signals in LLM monitoring. A high rate of ‘length’ finish reasons means your model is being cut off before completing its output. This is almost always a problem — it means users are receiving partial results — but it registers as a successful API call in every standard monitoring system.
Alert when the length finish reason rate for any workflow exceeds 5% of requests. Investigate when it exceeds 2%. In most cases, the fix is adjusting max_tokens, reformulating the prompt to produce more concise output or implementing chunked generation.
Define expected token ranges per workflow based on your baseline measurements. Alert when p95 token count for a workflow exceeds the budget by more than 20%. This catches context bloat early and surfaces regressions from prompt changes that inflate token usage.
Automated Quality Evaluation
Logs and metrics tell you about the mechanics of your LLM calls. Automated evaluation tells you whether the outputs are actually good. Setting this up is the highest-leverage observability investment you can make for a production LLM application.
The practical approach for most production systems is not model-graded evaluation running on every request — that doubles your inference cost. It is a two-tier system: Lightweight rule-based checks on every request, and deeper model-graded evaluation on a sample.
Tier 1: Rule-Based Checks on Every Response
Format Validation: Does the output match the expected structure (valid JSON, correct number of sections, presence of required fields)? This catches a surprisingly large proportion of prompt failures at zero additional LLM cost.
Length Sanity: Is the output within the expected character or word range for this workflow? Outputs that are dramatically shorter than expected indicate truncation or refusal; outputs dramatically longer indicate prompt leakage or runaway generation.
Content Safety Signals: Apply a lightweight classifier for harmful content categories. This is especially important if your application accepts arbitrary user input as part of the prompt.
Tier 2: Model-Graded Evaluation on a 5% Sample
Sample 5% of production traffic (or more if volume allows) and run a secondary evaluation prompt against the original request and output. The evaluation prompt asks a smaller, cheaper model to score the output on dimensions relevant to your application: Accuracy, completeness, format adherence, tone. Store the scores alongside the original log record.
The power of this approach is the trend line. A stable average score that suddenly drops is a high-confidence signal that something changed — a model update, a prompt regression or a shift in input distribution. Without the trend line, you are flying blind until users complain.
Distributed Tracing for Multi-Step Pipelines
Various production LLM applications are not single-model calls — they are pipelines: Retrieve context, summarize, generate, validate and sometimes retry. Standard metrics do not show you where time is spent in the pipeline or where quality degrades.
Applying distributed tracing to LLM pipelines — using OpenTelemetry (OTel) spans with LLM-specific attributes — gives you visibility into the full execution path. The key convention is to create a span for each LLM call with attributes that match the structured log format above. A trace for a multi-step pipeline will then show you the individual latency of the retrieval step, the summarization call and the generation call, along with the token counts and quality scores at each stage.
The OTel GenAI semantic conventions (available as of 2025) provide a standard schema for LLM spans. Using the standard schema means your traces are compatible with any OTel-native observability back end without custom attribute parsing.
Provider-Level Monitoring
If you use more than one LLM provider — or are considering it — provider-level observability becomes important. You need to see error rates, latency and cost not just in aggregate but broken down by provider, so you can compare performance and catch provider-level degradation before it affects users.
Key Provider-Level Metrics to Track Separately:
Error rate by error type (rate limit, timeout, content filter, API error) per provider
P50, P95 and P99 latency per provider per model family
Time to first token (TTFB) per provider (this is what users feel in streaming applications)
Cost per 1,000 requests per provider at your actual usage mix (not the listed price per token)
Provider health dashboards are most valuable during incidents. When a provider has a partial outage, the health dashboard tells you whether to fail over and how severe the degradation is — information that often arrives before the provider posts a status update.
Alerting That Doesn’t Cry Wolf
LLM observability generates a lot of data. The risk is alert fatigue: Too many low-signal alerts that engineers learn to ignore. The following alert tiers have worked well in practice.
Tier 1 — Immediate Page-Level Alerts:
Error rate on any workflow exceeds 10% over a 5-minute window
Provider latency P99 exceeds 30 seconds sustained for 3+ minutes
Estimated hourly cost exceeds 3x the expected rate
Tier 2 — Slack/Email Alerts (Investigate Within an Hour):
Length finish reason rate exceeds 5% for any workflow
Average quality score drops more than 15% from the 7-day rolling average
P95 prompt token count exceeds budget threshold for any workflow
Tier 3 — Daily Digest Only:
Token usage and cost by workflow versus prior week
Quality score trend by workflow
Finish reason distribution summary
Tier 3 metrics inform product and engineering decisions but do not need immediate action. Keeping them in a daily digest rather than active alerts reduces noise and keeps the on-call engineer focused on signals that actually require immediate response.
Practical Starting Point for Teams New to LLM Observability
If you are instrumenting an LLM application for the first time, the order that maximizes early value with minimal implementation cost:
Week 1: Add structured logging for every LLM call (model, workflow, tokens, latency, finish reason, estimated cost). Route to your existing logging infrastructure. This alone surfaces most structural problems.
Week 2: Add format validation as a rule-based check in your LLM call wrapper. Alert on validation failure rate exceeding 3%. This catches prompt failures that look like successes.
Week 3: Build a simple dashboard that shows error rate, P95 latency and finish reason distribution per workflow over the last seven days. This gives you the baseline you need to detect regressions.
Month 2: Add 5% sample quality evaluation. Pick the most important workflow, define a rubric, implement a model-graded evaluator and start tracking the score trend. This is where the observability stack becomes genuinely predictive rather than reactive.
Each step can be shipped independently. You do not need a fully instrumented stack before you get meaningful signal. Start with the structured log and build from there.
Key Takeaways
Standard infrastructure monitoring is necessary but not sufficient for LLM applications. Semantic failures — quality drift, output truncation, format errors — are invisible to conventional APM tools.
The finish_reason field is one of the most actionable and most ignored observability signals in LLM production. A high length rate means users are getting partial outputs and your system shows green.
Automated evaluation does not need to run on every request to be valuable. A 5% sample with a model-graded rubric and a trend-tracked score is enough to catch quality regressions before users report them.
Token budget alerting per workflow is the most cost-effective way to catch prompt regressions and context bloat before they show up on the billing statement.
OTel GenAI semantic conventions provide a standard schema for LLM spans. Use the standard rather than inventing your own attribute names — it pays off when you change observability back ends.
Engineering teams running agentic systems in production tend to discover the same gap — in the same order. First they notice that the dashboards look healthy — then realize that a healthy dashboard and a correctly behaving agent are not the same thing. It is somewhere in that apparently healthy system that an agent had been quietly producing outputs that fell outside any acceptable range of correctness for hours before anyone noticed. Not because the monitoring failed to fire, but because it was watching for the wrong thing.
Service level objectives (SLOs) were built on a contract that most engineering teams have never had a reason to question. Typically, a request would come in, the service would process it and reliability was measured against whether the outcome matched the expectation within the defined thresholds. That contract worked because the systems it governed were deterministic. The same input produced the same output, and deviation from that expectation was unambiguously a failure.
“Agentic systems have broken that contract without replacing it with anything most platform teams are ready to operate against,” says Shahid Ali Khan of TestMu AI (formerly LambdaTest). Identical inputs can produce different, plausibly correct outputs. Quiet failures complete successfully while doing something entirely unintended — and the metrics most teams are watching — latency p99, error rate and availability — tell you whether something broke but not whether the agent deviated from the expected behavior in ways that matter to the business.
Khan points out that the frameworks have not caught up and the teams discovering that gap are predominantly doing so through incidents rather than through deliberate architectural decisions made before those incidents occurred.
Identical Inputs No Longer Guarantee Identical Outputs
Ronak Desai, CEO and co-founder of Ciroos and formerly SVP and GM at Cisco, identifies the structural flaw in existing SLO frameworks with a precision that practitioners who have not yet run agentic systems in production may not have encountered directly. “Traditional SLOs are dependent on deterministic contracts,” Desai argues. “A request either meets a latency threshold, or it doesn’t. Agentic systems violate that assumption because identical inputs can produce different, plausibly correct outputs or quiet failures that never appear as errors.” The implication is not that reliability is unmeasurable in agentic systems. It is that the measurement model has to change fundamentally rather than incrementally.
The first practical consequence of that reframe is accepting that existing metrics need to be supplemented rather than replaced. Infrastructure metrics still matter and should not be abandoned. What they cannot do is tell the whole story when part of the system is probabilistic by design. That is where the observational gap opens up and where most teams are currently flying blind without realizing it.
Khan, principal engineer–DevOps at TestMu AI, an AI-native software testing platform, arrives at the same diagnosis from the operational side. When his team started integrating agentic components into their test orchestration platform, the existing SLO metrics proved necessary but insufficient. “These metrics tell you if something broke,” Khan explains, “not why or how badly the agent deviated from expected behavior.” A service can be technically up, passing every infrastructure check the team has instrumented for, while simultaneously producing outputs that fall outside any acceptable range of correctness. The gap between those two states is precisely what traditional SLO frameworks have no mechanism to surface.
Closing that gap requires building a second layer of measurement on top of the first rather than trying to stretch existing metrics to cover behavior they were never designed to capture. That architectural insight, that behavioral correctness requires its own measurement layer rather than a refinement of infrastructure metrics, is the principle that connects every practitioner who has worked through this problem in production.
Arun Anbumani, principal cloud infrastructure engineer at Oracle, adds a dimension to the nondeterminism problem that the agent-focused framing alone cannot capture. Hardware and firmware variability at the infrastructure layer, queue pressure on accelerators, firmware resets and resource contention on GPUs and SmartNICs introduce behavioral variance before any AI component is even involved. “Reliability is no longer just about whether an API call succeeds,” Anbumani observes. “It is about whether the entire platform stack is behaving normally.” In environments running heterogeneous infrastructure alongside agentic workloads, the nondeterminism problem compounds across layers simultaneously and platform teams that treat it as purely a model problem will keep finding infrastructure-layer failures that their agent-focused monitoring was never positioned to catch.
The actionable consequence here is that SLO redesign for agentic systems has to start at the infrastructure layer rather than at the model layer. Teams that jump straight to behavioral SLOs without instrumenting the hardware and firmware signals feeding the models will build a measurement system with a blind spot at its foundation. Getting the platform-level indicators right is the prerequisite for everything that comes above it.
Behavioral Correctness Needs Its Own Measurement Layer
The response that has emerged from practitioners who have worked through this problem is a layered SLO model that retains classical reliability metrics at the infrastructure layer while adding new measurement primitives for inference reliability and behavioral correctness above it. Khan and Ihor Zakutynskyi, chief technology officer at FORMA by Universe Group, arrived at this architecture independently, which is a strong indication of emerging practitioner consensus rather than individual preference.
Khan’s implementation adds a behavioral correctness layer above the classical reliability metrics his team retained. “We track semantic similarity scores between generated tests and a baseline corpus, confidence thresholds from underlying models, and outcome variance over rolling windows,” he explains. “If variance exceeds a threshold even when the service is technically up, that is an SLO breach.” The behavioral layer is not a replacement for infrastructure monitoring. It is the layer that makes infrastructure monitoring meaningful for services where the output is probabilistic rather than deterministic, and it gives teams a mechanism for detecting degradation before it surfaces as a customer-facing incident because behavioral drift tends to precede visible failure rather than coincide with it.
The practical recommendation that follows is to define behavioral thresholds empirically from production data before setting them as SLO targets. Starting with rolling window variance monitoring and adjusting the threshold based on what the team observes over several weeks gives a more defensible baseline than picking a number from theory and hoping it holds in production.
Zakutynskyi’s three-layer model maps closely to Khan’s approach and adds a precision that practitioners building these systems for the first time will find useful. The infrastructure reliability layer retains familiar metrics governed by conventional error budgets. The inference reliability layer tracks model-specific signals including token-level latency, response time variance and fallback frequency. The behavioral SLO layer enforces bounded consistency, validating that outputs meet structured contracts and measuring semantic drift against embedding-similarity baselines.
“A service might be 99.9% available at layer one yet still violate its behavioral consistency SLO if outputs wander beyond the defined variance envelope,” Zakutynskyi notes. The reframe from uptime to what he calls ‘trust over time’, covering correctness, safety and consistency, is the architectural shift that makes SLOs meaningful for agentic systems rather than simply applicable to them.
Keeping each layer tracked independently rather than aggregated is what makes incident routing possible, and collapsing all three into a single composite score obscures the causal structure of failures and makes it impossible to route incidents to the right team with the right context. Infrastructure failures route to platform engineers, while inference failures route to the ML team and behavioral correctness failures route to whoever owns the agent’s goal specification and output contracts. The separation is not administrative tidiness but the operational prerequisite for a functioning response process.
Start With Step Count and Build From There
Desai offers the most actionable framework for practitioners trying to operationalize agentic SLOs. It organizes around four dimensions that together form a reliability model built for nondeterministic systems rather than adapted from deterministic ones.
The first dimension is latency measured by task class, specifically time per logical conclusion rather than time-to-first-byte, a metric that becomes meaningless when a task spans dozens of model calls. The second is step count as a reliability signal, where excessive steps indicate that an agent is confused or operating inefficiently. “It should not take an agent 20 steps to solve a two-step problem,” Desai notes, and that observation is more immediately relatable to engineering leaders than any abstract discussion of nondeterminism because it translates directly into a metric that any team can instrument without building new infrastructure.
The third dimension is probabilistic correctness, replacing binary correctness tests with pass@k-style distributional accuracy targets so that SLOs capture correctness across repeated runs rather than a single snapshot. The fourth is confidence and intent alignment, treating low-confidence actions in high-stakes contexts as first-class reliability events that automatically trigger human review or rollback rather than silently proceeding.
The implementation sequence this framework implies is worth making explicit. Start with step count monitoring because it requires the least new infrastructure and surfaces the most obvious failure mode. Add task-class latency next because it gives the time-per-logical-conclusion signal without requiring behavioral analysis. Layer-in pass@k correctness evaluation once there is a corpus of validated outputs to measure against. Then, build confidence and intent alignment alerting last because it requires the most domain-specific calibration to avoid generating false positives that erode trust in the alerting system itself.
Decision Points Are the Unit of Observation, Not Requests
The measurement model is only as good as the observability infrastructure feeding it, and the observability infrastructure most platform teams have is not built to surface the signals that agentic reliability requires.
Khan’s team has moved to probabilistic tracing as the foundation. Standard distributed tracing assumes that a request follows a predictable path. With agents, the path itself is a decision. “We emit trace annotations for decision points,” Khan explains, “which tool was invoked, what reasoning chain was followed, what confidence score triggered the choice.” This gives his team the ability to correlate reliability failures with specific behavioral patterns rather than just infrastructure faults. Behavioral drift dashboards that compare current agent output distributions against baselines from previous weeks have proven more predictive of incidents than traditional alerting, triggering human review before customers notice degradation.
The decision point is the unit of observation in an agentic system, not the request. Tracing infrastructure that cannot record what the agent decided and why it decided it cannot support the kind of incident attribution that agentic reliability requires. Building that tracing capability before the system goes to production rather than retrofitting it after the first incident is the single most high-leverage investment a platform team can make when onboarding agentic workloads.
Zakutynskyi’s observability approach logs every request with its exact prompt, model version and policy tags alongside intermediate reasoning traces and tool calls. This separation of transport-level failures from AI decision errors is what makes schema validation and trace-based replays possible, allowing his team to pinpoint whether a bad result came from network noise or from the agent’s logic. Anbumani adds platform-level indicators to the observability picture, covering accelerator health, reset frequency, retry amplification and resource pressure alongside standard request metrics, making the full platform stack visible rather than just the application layer.
Observability for agentic systems has to be designed into the data model from the start. Prompt logging, model version tagging and policy annotations are not add-ons that can be layered onto an existing observability stack. They require the system to emit structured data at the point of decision, which means the observability requirements have to inform the agent architecture rather than follow from it.
Error Budgets in an Agentic World
The error budget question is where existing frameworks show their deepest limitations and where most platform teams are still operating without a clear answer. “The error budget model we inherited assumes failures are attributable and bounded,” Khan observes. “When an agentic component is in the causal chain of an incident alongside human-authored services, attribution becomes genuinely difficult. Did the agent fail because the model drifted, because the input it received was outside its training distribution or because a human-authored service upstream gave it bad context to reason from? Each of those failure modes has a different owner and a different fix, but the incident looks identical from the outside.” At TestMu AI, the team has moved toward separate budget categories for infrastructure failures, inference failures and behavioral correctness failures, tracking each independently rather than aggregating them into a single error budget that obscures the causal structure of what is actually going wrong.
Error budget reviews have to change in format as well as content. A review that aggregates all failure types into a single burn rate number cannot support the conversation that agentic reliability requires, which is a conversation about which category of failure is consuming budget, why and which team owns the response. Separating the budgets is what makes that conversation possible, and building the attribution tooling that populates each budget accurately is the prerequisite for the separation to be meaningful rather than cosmetic.
The behavioral correctness budget in particular has no industry standard to calibrate against, and defining acceptable thresholds empirically from production data is currently the only option available to most teams. That is an uncomfortable position for organizations used to having external benchmarks to validate their reliability targets against, and it is the clearest signal of how early the field still is in developing the shared infrastructure that mature reliability engineering requires.
What the Field Still Needs
The gap that Khan identifies from his team’s experience building these systems is the same gap that every contributor to this piece identifies from their respective vantage points. “We still lack good industry standards for what acceptable nondeterminism looks like,” Khan observes. “We have defined these thresholds empirically, but there is no equivalent of 99.9% availability for agent correctness. That is an open problem the industry needs to solve.” The layered SLO model, the four-dimension framework, the probabilistic tracing and the behavioral drift dashboards are all real and deployable responses to a real problem. But they are responses built in the absence of the shared standards that would make them interoperable, auditable and comparable across organizations.
The convergence that Khan and Zakutynskyi reached independently on the layered SLO model is the kind of empirical evidence that standards bodies and platform engineering communities should be building from. Translating that convergence into shared specifications is unglamorous work that does not generate the benchmark numbers that make AI adoption announcements compelling. But it is the work that determines whether the next generation of agentic infrastructure is built on a foundation that holds, and that work is available to any team willing to contribute what they have learned to the conversation rather than keeping it as internal knowledge.