Category: Social – X

  • CircleCI Extends CI/CD Reach to AI Models

    CircleCI this week revealed it is extending the reach of its continuous integration/continuous delivery (CI/CD) platform to make it simpler to incorporate artificial intelligence (AI) models into DevOps workflows.

    In addition to providing access to the latest generation of graphical processor units (GPUs) from NVIDIA via the Amazon Web Services (AWS) cloud, Circle CI has added inbound webhooks to access AI model curation services from providers such as Hugging Face and integrations with LangSmith, a debugging tool for generative AI applications and the Amazon SageMaker service for building AI applications.

    CircleCI CEO Jim Rose said while there is clearly a lot of enthusiasm for incorporating AI models into applications, the processes being used are still immature, especially in terms of automating workflows that include testing of probabilistic AI models.

    Most AI models are built by small teams of data scientists that create a software artifact that needs to be integrated within a DevOps workflow just like any other artifact, noted Rose. The challenge is that most data science teams have not yet defined a set of workflows for automating the delivery of those artifacts as part of a larger DevOps workflow, he added.

    DevOps teams will also need to make adjustments to a version control-centric approach to managing applications to trigger pipelines to pull AI software artifacts that exist outside of traditional software repositories. For example, the inbound webhooks provided by CircleCI now make it possible to automatically create a pipeline whenever an AI model residing on Hugging Face changes.

    It’s still early days as far as the deployment of AI models in production environments is concerned, but there is no doubt generative AI will have a major impact on how software is developed. AI models are a different class of software artifacts that are retrained instead of being updated, a process that occurs intermittently. As such, DevOps teams need to keep track of each time an AI model is being retrained to ensure applications are updated.

    At the same time, generative AI will also increase the pace at which other software artifacts are being created and deployed. Many of the manual tasks that today slow down the rate at which applications are built and deployed will be eliminated. That doesn’t mean there will be no need for software engineers, but it does mean the role they play in developing and deploying software is about to rapidly evolve. DevOps teams need to evaluate both how generative AI will impact the tasks they manage as well as the way the overall software development life cycle (SDLC) process needs to evolve.

    Each organization, as always, will need to decide for itself how best to achieve those goals depending on the use cases for AI,  but the changes that generative AI will bring about are now all but inevitable. The longer it takes to adjust, the harder it will become to overcome the cultural and technical challenges that will be encountered along the way.

  • Three Strategies for Reducing MTTD and MTTR as Outage Costs Spiral

    Three Strategies for Reducing MTTD and MTTR as Outage Costs Spiral

    According to a New Relic survey of IT professionals, the median annual cost of IT outages has reached an astronomical $7.75 million. Over one-third of the 1,700 respondents said critical business application outages now cost more than $500,000 per hour. In a business environment where most interactions with customers, suppliers and business partners are conducted digitally, downtime has become a problem and an existential threat.

    Most IT organizations carefully monitor two key metrics — mean time to detection (MTTD) and mean time to resolution (MTTR) — to track their success in identifying and remediating critical systems issues. The figures represent, respectively, the average time it takes administrators to identify that a problem has occurred and to remediate the underlying issues. They serve as a benchmark for understanding the organization’s level of awareness of the status of its systems and the speed with which problems can be diagnosed and acted upon.

    There are many ways to improve performance against these metrics, but three stand out as the most effective, as evidenced by New Relic and the survey results.

    Monitor Everything

    The less you know about a problem, the longer it takes to diagnose and fix. The New Relic survey measured 17 different observability categories, such as network monitoring, alerts, log management, browser monitoring and distributed tracing. Across the board, about two-thirds of the companies that used even one of those monitoring tools reported reduced MTTR, with many saying resolution times had fallen by more than 25%.

    One-third of respondents whose organizations implemented full-stack observability—which is the ability to see everything in the tech stack that could affect the customer experience—reported the fewest outages, fastest MTTD and MTTR, lowest outage costs and highest median annual return on investment compared to all respondents. For example, those who have full-stack observability experience a median outage cost that is 37% less than those without.

    As the complexity of enterprise technology stacks increases, so does the difficulty of pinpointing the root cause of an outage. Any monitoring is better than no monitoring at all, and the more visibility you have into applications and infrastructure the faster you can identify and resolve incidents. Strive for full-stack observability around integrated observability data and a comprehensive dashboard.

    Have an Incident Management Action Plan

    The worst time to figure out how to resolve a problem is when you’re in the midst of a crisis. Organizations with mature observability practices also have extensive and documented response plans.

    Your incident plan will be unique to your organization. Small companies and startups tend to have ad hoc response strategies based on the skills within the organization. Large enterprises may use a more formal methodology like IT service management that defines strict procedures and protocols. Companies that have embraced modern DevOps and Lean principles often use a hybrid approach that depends heavily on teamwork and collaborative problem-solving. All of these approaches can work if the team fully understands the chosen strategy.

    Document your IT architecture, identifying known vulnerabilities and outlining procedures for responding to the most common types of incidents. Plans should cover obvious disruptions like fires and power outages, but you should also think about “unicorn” scenarios such as a rogue query that ties up a database server or a communication outage at a key supplier. Mature observability teams devote a portion of their resources to constantly testing new and unpredictable scenarios and use chaos engineering to randomly inject problems in a controlled manner to see if systems respond as expected.

    As you develop incident response procedures, document the processes in runbooks, which tell responders exactly what to do when a specific problem occurs. This not only creates a database of organizational knowledge about response strategies but also helps with onboarding new employees and covers for skills gaps that occur when team members are unavailable or leave the company.

    Fix for the Future

    Technical debt is a long-term obligation that is created when a short-term – and incomplete – solution is applied. You should aim to minimize it in your observability operation.

    When a problem occurs, the temptation is to fix it as quickly as possible. Human nature is to move on to the next task without taking the time to go back and understand why a problem occurred. “Quick and dirty” fixes are an invitation to larger problems in the future. Your observability plan should include a forensics stage that documents root causes and the fixes that were applied. Even if it isn’t convenient to implement a long-term solution immediately, the documentation serves as a guide for implementing a permanent fix down the road.

    Building a resilient IT architecture is a marathon, not a sprint. The more rigor you apply to identifying and resolving problems when they happen, the better prepared you will be to prevent their reoccurrence and the more informed your team will be about the resources they manage. Reducing your MTTD and MTTR will not only improve the bottom line of your business, it will ensure that your customers have an amazing digital experience.

  • Observability: The Central Watchtower Your All-Seeing IT Needs

    Observability: The Central Watchtower Your All-Seeing IT Needs

    If there’s something you need to keep secure, it’s natural to want to keep it sealed away under lock and key. However, even keeping something in a vault, far from prying eyes and ill intent, may not be enough to offer peace of mind. After all, how can you have the peace of mind of knowing it’s safe if you don’t regularly check to ensure it hasn’t bolted, been burgled or broken down?

    Now, multiply the volume and value of things being monitored tenfold — and you get a sense of the daily inefficiencies and anxieties IT professionals battle.

    Instead of jewels, these teams safeguard, manage and maintain something far more valuable: The data that underpins everything from business transactions to system performance to threat detection to service delivery and beyond. To make matters more complicated, today’s digital ecosystems are more complicated, distributed and disparate than ever before.

    Databases are critical to managing a successful IT department — and it’s time to discard the widespread industry’s perception of them as an unknowable black box. To be sure, databases represent the most difficult component of the IT ecosystems to observe, tune, manage and scale. But the database isn’t a Magic 8 ball in terms of its internal processes; We no longer have to shake the mystery toy and accept one of the six answers it’s designed to spit out.

    The fact of the matter is that database specialists and IT teams need a clear view of database performance telemetry if they want any hope of maintaining the health, stability and scalability of their services.

    Observability Tools

    This is where observability tools can play a transformative role. Taking its cues from the all-seeing panopticon watchtower, observability eliminates the dark corners of the database dungeon by providing a comprehensive view across the full cloud-native, on-premises and hybrid technology stacks.

    The word panopticon derives from the Greek word panoptes, or “all-seeing.” The panopticon model features a central, lighted guard tower at the center of a circular room — allowing 360-degree lines of sight that allow the guards to observe every surrounding cell from a single, centralized vantage point.

    English philosopher Jeremy Bentham had no way of foreseeing the challenges of today’s database professionals when he first conceived of the panopticon in the 1700s. The concept would lay the blueprint for a prison system designed around one core concept: Enabling the minimum number of guards to effectively monitor the maximum number of inmates. Bentham’s system also works as a strategy for ensuring the health and performance of your organization’s critical databases.

    The panopticon was designed so that every cell could be monitored from one central point — ensuring not only better and more straightforward security but preserving resources in saved time, manpower and effort expended. Think of your ITOps, database, DataOps and DevOps teams as the wardens of your IT performance. Traditional monitoring can be likened to patrolling a traditional prison: Rows of cells facing out into a hallway that is patrolled on a schedule or used to spot and address misbehavior as it’s noticed.

    How can they be sure they’re focusing their efforts in the right place? Or trust that Cell Block A won’t stage a breakout while they’re breaking up an argument in Cell Block B?

    In short: They can’t. Odds are, the team is either running from outage to outage in an everlasting firefighting mode or relying on random spot checks for something as vital as the health of our IT systems.

    Observability, as opposed to monitoring, puts teams into that central panopticon watchtower, allowing them to not just see everything, but to see it within the context of the bigger picture. This comprehensive visibility and always-on observation enable IT teams to identify critical issues as they occur, even those caused by complex dependencies between the database, operating system, storage subsystem and network.

    Database Performance Issues

    Furthermore, database performance issues are a starting gun for costly bottlenecks or serious outages that can handcuff your company’s ability to compete or grow. Without complete and precise database monitoring and observability, IT operations struggle to accurately determine an application’s root cause of performance issues. This increases the risk of downtime, data loss and poor customer experiences.

    Discovering the root cause of performance issues is quite literally a system-critical undertaking, whether you’re simply running your enterprise, scaling your operations or deploying new code. Observability also offers teams the rare opportunity to get ahead of performance issues since you can see performance anomalies in advance of a service disruption rather than relying on real-time remediation.

    With traditional methods, DevOps and IT teams must manually analyze the data presented to them, correlate it to the problem, and locate the error before they can finally begin addressing it. In contrast, observability collects data to provide information on what’s not performing as expected and why. This allows teams to take a proactive approach to solving downtime and bottlenecks and proactively preventing them.

    In the software world, that translates directly to more time spent where it matters: Developing new business value within your applications and infrastructures, fueling innovation and exceeding customer expectations.

    Given how complicated the modern database has — and continues to — become, arming your enterprise with the right observability solutions can provide a boost to efficiency and performance and pardon your teams from a sentence to time-consuming, mundane and error-prone work.

  • Bitrise Tightens Mobile DevOps Integration With AWS Cloud Services

    Bitrise Tightens Mobile DevOps Integration With AWS Cloud Services

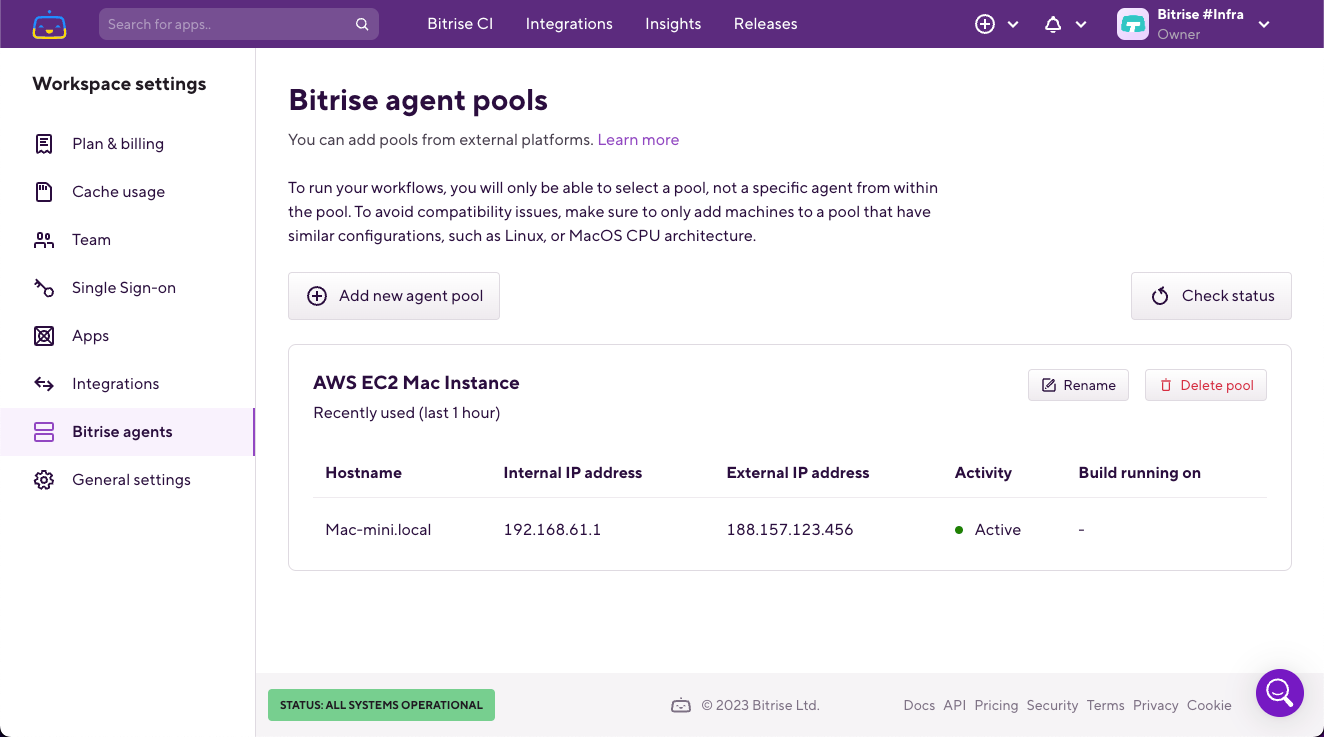
    Bitrise this week will tighten integration with its DevOps platform for building and deploying mobile applications and the application development services provided by Amazon Web Services (AWS) cloud.

    Announced at the AWS re:Invent 2023 conference, the goal is to provide easier access to automated building, testing and release management capabilities provided by AWS as part of an effort to increase overall efficiency.

    Bitrise CEO Barnabas Birmacher said those capabilities will streamline workflows for a Bitrise Mobile DevOps platform that has been specifically designed for building and deploying mobile applications that typically need to be updated frequently.

    Based on a continuous integration/continuous delivery (CI/CD) platform developed by Bitrise that can be deployed in an AWS cloud computing environment, the integrations will make it simpler to build and run mobile applications at scale, noted Birmacher.

    The goal is to reduce the total cost of building mobile applications while at the same time improving developer productivity for mobile applications that have to be thoroughly tested before being made accessible via an application store, he added.

    It’s not clear how many organizations will prefer to have a dedicated CI/CD platform for building and deploying mobile applications versus using the same CI/CD platform they might already be relying on to build and deploy other applications. Bitrise claims to have more than 6,000 customers, including Reddit, WISE, Equinox and Philips Hue.

    As the percentage of mobile applications that make up an organization’s portfolio continues to increase, the pace at which those applications need to be updated lends itself better to a CI/CD platform optimized for those types of applications, said Birmacher.
    In fact, a recent survey conducted by Bitrise found 62% of respondents have been adversely impacted by manual processes that slowed the rate at which mobile applications were deployed and updated. The survey also found (44%) of respondents reported their release approval process is mostly or entirely manual, with only 9% having fully automated application releases.

    The survey also found that nearly two-thirds of organizations (66%) have deployed applications that can’t be opened in two seconds or less, which is widely considered the accepted level of performance required for mobile applications. In addition, three-quarters of organizations (75%) required more than two days to address bug fixes.

    Many mobile apps have become increasingly mission-critical thanks to digital business transformation initiatives. Consequently, the amount of focus on them within most organizations is high; any issues that arise are likely to be noticed at the highest echelons of an organization. That level of attention can easily put pressure on DevOps teams, mainly because the general expectation among end users is that mobile applications will be regularly updated with new functionality. However, if release processes are largely manual, regularly improving the user experience can become problematic.

    Each IT organization will need to decide for itself how best to go about building and deploying mobile applications, but the one thing that is certain is adjustments to DevOps workflows will need to be made as a lot more of these applications are continuously built, deployed and updated.

  • LaunchDarkly Previews Generative AI Testing Tool for Feature Management

    LaunchDarkly Previews Generative AI Testing Tool for Feature Management

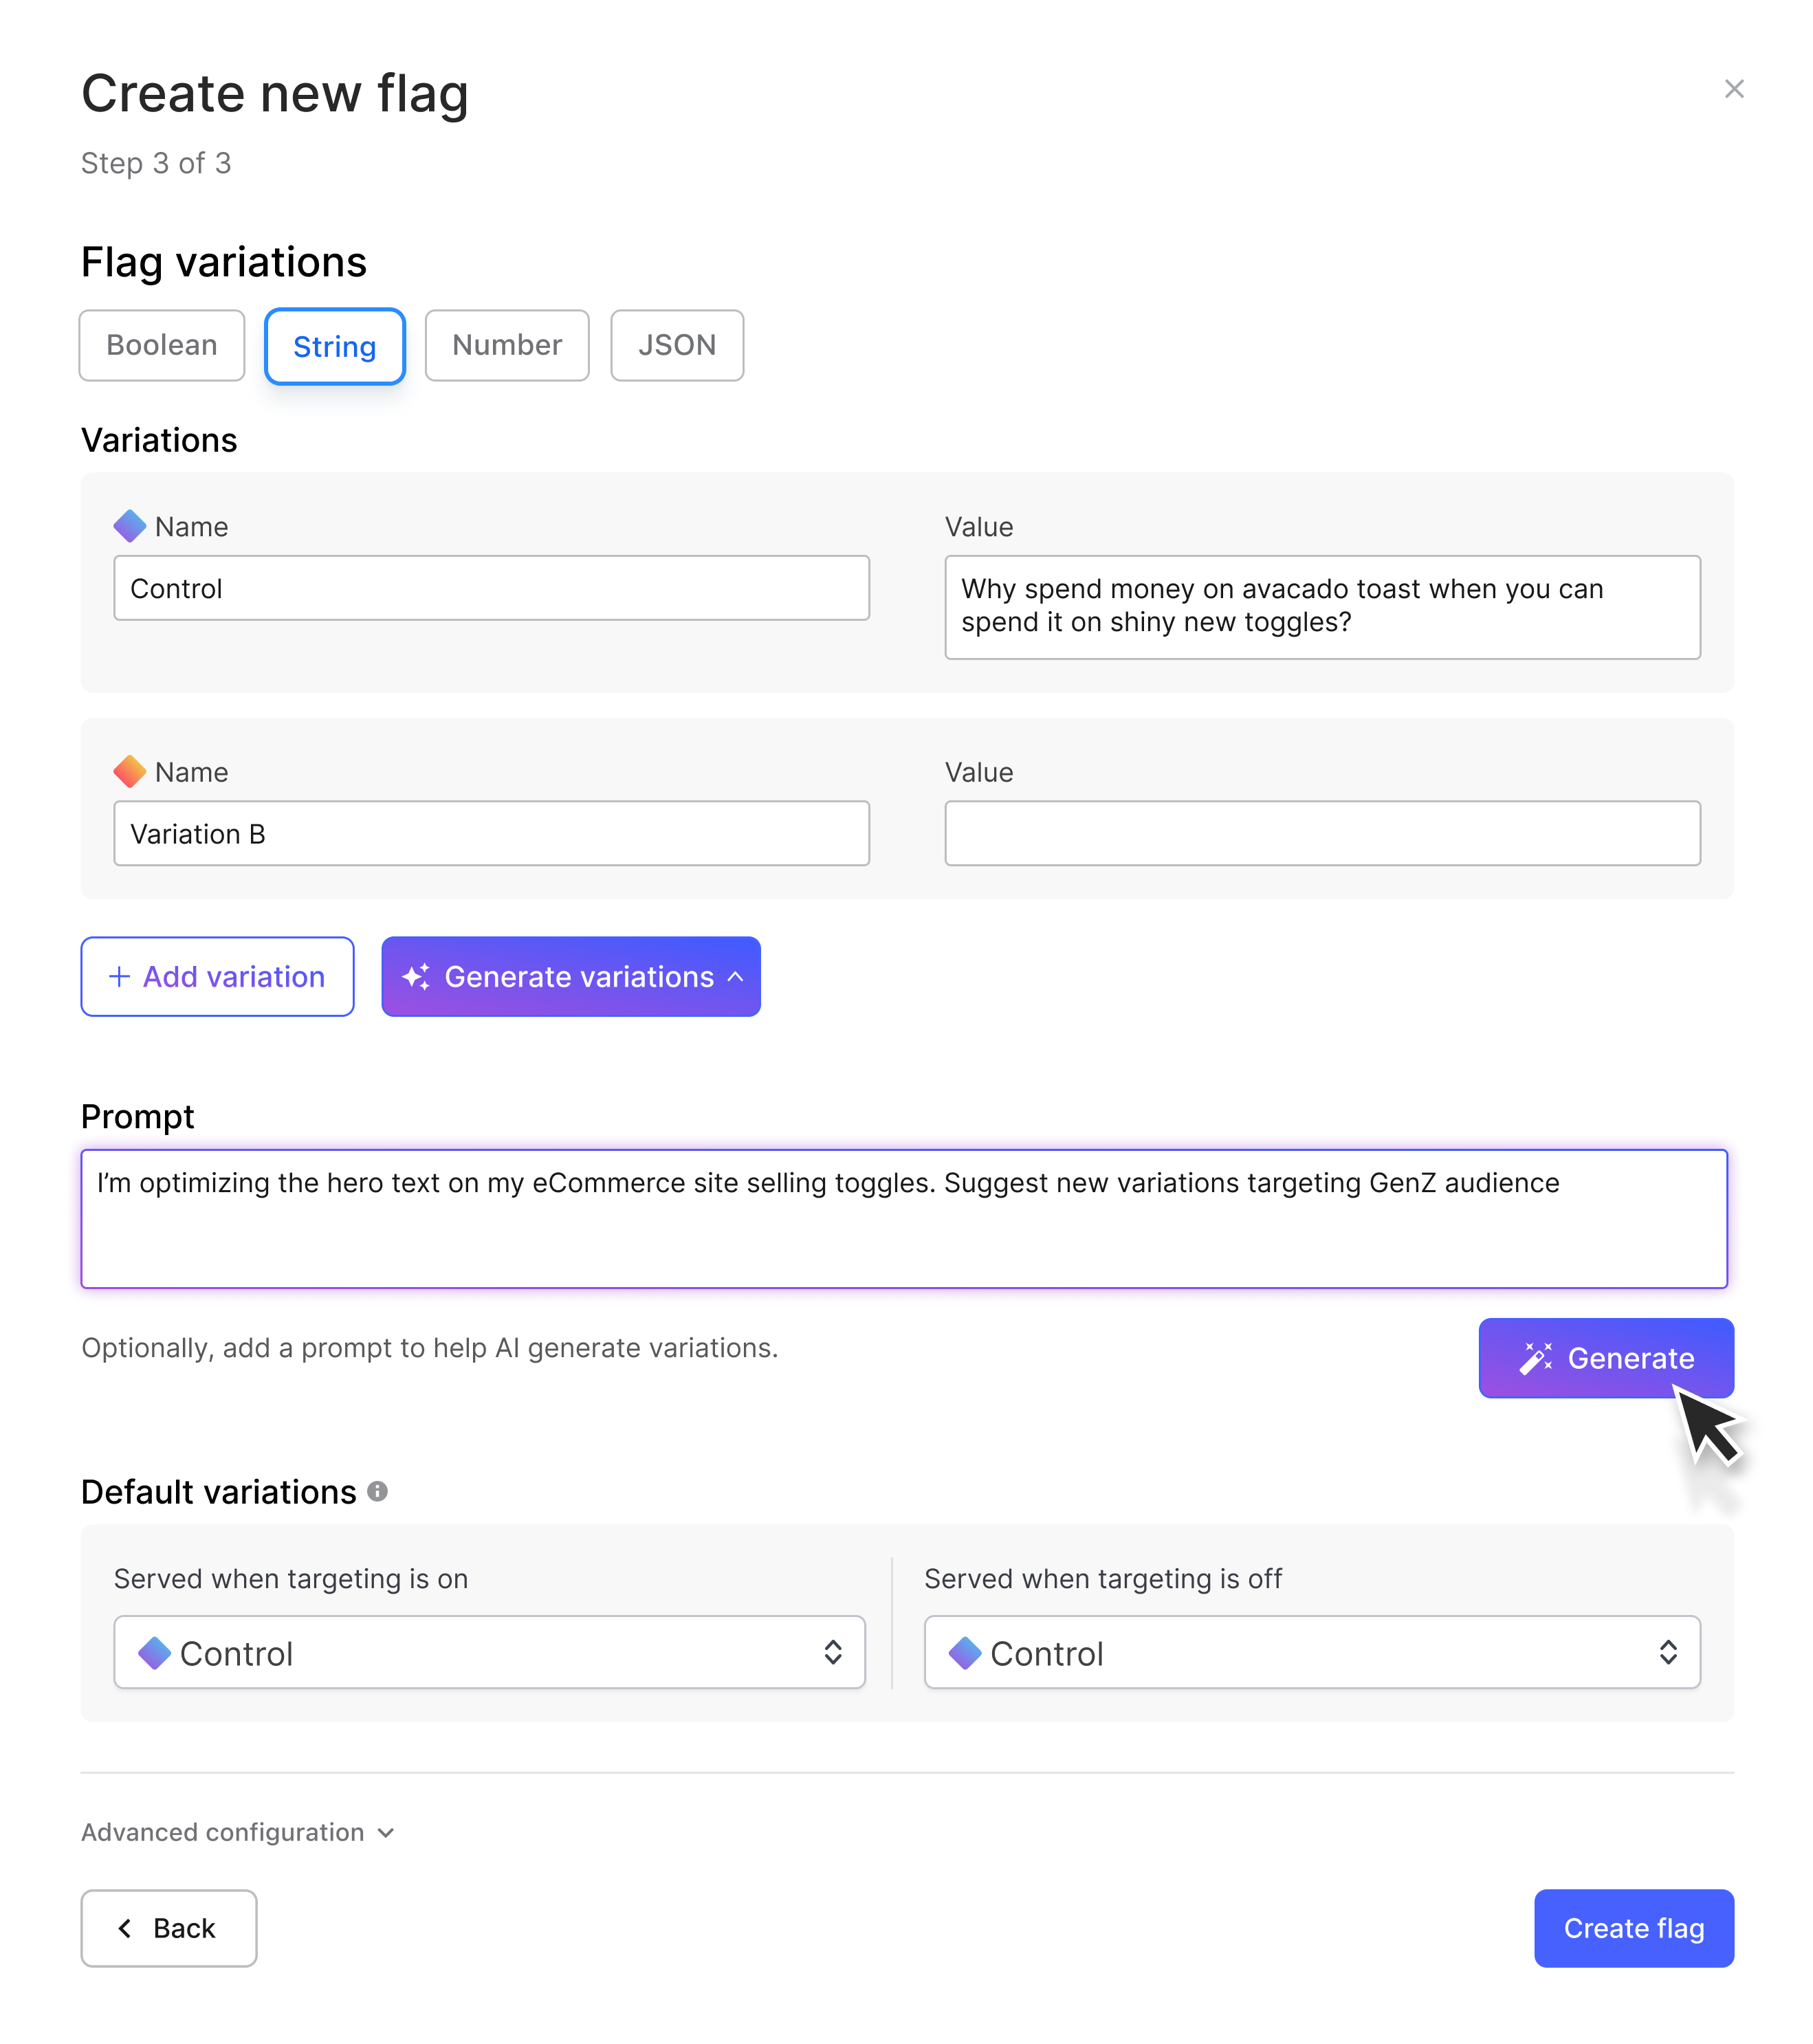
    At the AWS re:Invent 2023 conference, LaunchDarkly today previewed an ability to leverage generative artificial intelligence (AI) capabilities to create experiments for its feature management platform.

    Based on the Bedrock foundational large language models (LLMs) made available via AWS, this extension to the company’s Product Experimentation platform promises to make it simpler to use historical data to create a wider range of offerings that might be made available within an application.

    LaunchDarkly is making a case for a SaaS platform that can be used to centrally manage features across multiple workflows and platforms.

    Robert Neal, director of engineering for LaunchDarkly, said the company is now extending its testing capabilities using a managed Bedrock service provided by AWS that will enable leveraging generative AI to define a testing hypothesis more easily. That should also make it possible to involve more stakeholders in an iterative testing process within the context of a set of well-defined guardrails, he added.

    As more organizations start to deliver different tiers of digital services at varying price points, there is a clear need to be able to restrict access to those digital services. Application development teams have been employing feature management since the 1970s to isolate the development of various components into a branch that can be worked on and tested without impacting the primary build the application is based on.

    Feature management enables development teams to experiment with adding new capabilities in a way that doesn’t disrupt the application. When a project is completed, that branch is then usually merged into the primary build or can be deployed as a microservice that might be invoked via an application programming interface (API) by other modules with the application or another external application.

    At the core of that capability are what are known as feature flags, also known as feature toggles or feature switches, that make it possible to dynamically turn services on or off based on who is accessing them. Rather than being limited to the application development process, those feature flags are now being employed in production environments to enable the continuous delivery of multiple types of digital services to various classes of users of an application. A feature flag management platform enables an organization to keep track of all the flags being employed to keep the overall application environment consistent.

    It’s still early days in terms of understanding the extent to which generative AI can be applied to DevOps workflows, but it’s clear many of the manual processes that conspire to slow down the pace at which applications are built and deployed are going to be either reduced or outright eliminated. Each DevOps team will naturally need to determine for itself to what degree DevOps workflows can be automated using AI, but the overall pace at which applications can be built and deployed is going to clearly accelerate. The challenge now will be finding ways to keep pace with a rate of application development that is about to exponentially increase.