Category: Features

  • Of Max and Min: When Performance Engineering Plans Go Awry

    Of Max and Min: When Performance Engineering Plans Go Awry

    Modern software developers have access to powerful tools and services which allow them to quickly develop, demo and deploy fully functional applications. But what happens when the single-user prototype satisfies all required functionality but the user says the system seems slow? Or if the initial implementation turns out fine for one user, but multiple users start to experience delays? Or if users are happy, but the cost of auto-scaling grows prohibitive?

    The Problem with Performance Engineering

    Concern over non-functional aspects of computing systems—response times, resource utilization and costs—falls under the domain of computer systems performance engineering (CSPE). Unfortunately, the practice of CSPE has evolved into something more akin to art than engineering—with few standardized principles and practices. Because software is constantly evolving its languages and abstractions, CSPE practitioners appear obligated to evolve and change their abstractions and languages, too.1 As a result, part of our jobs as performance engineers is to understand what the heck other performance engineers really intend or mean.

    There are many reasons for this state of affairs, but ultimately this lack of a common language and engineering standards for CSPE is a deficiency in the education and training of software engineers. There is very little in the typical university software engineering curriculum that prepares software engineers for doing CSPE. This sometimes leads to practices that are not backed by scientific or engineering principles. As a result, practitioners are forced to “wing it”—creating their own art or hitching their wagons to someone else’s star and learning (or not) through trial and error.


    The PMWG – A POSIX for Performance?

    The Performance Management Working Group (PMWG) was started in the late 1980s during the “UNIX wars,” when computer vendors were feuding over claims to the UNIX leadership mantle and had formed two factions: UNIX International and the Open Software Foundation. The group was unique in that its members included computer systems vendors on both sides of the “war.” Its members put aside those differences to try to come up with performance management standards and practices that would put UNIX on par (at least) with the performance management tools found on mainframes.

    In retrospect, the PMWG was probably the best chance UNIX had for establishing, promoting and enshrining some basic performance engineering principles—a kind of POSIX for performance. Unfortunately, the group failed—in large part, in my opinion, because it put too much priority on the latter stages of the performance management data pipeline and did not spend enough effort toward establishing key primitives. Today, in the absence of established rules and practices for performance engineering, history is repeating itself. Current efforts in observability continue to focus mainly on data presentation and data transport and storage, without much focus on the right metrics and data quality based on basic performance engineering principles. Presentation, transport and storage are important, but the efforts around metrics, logging and tracing coverage and data quality are sporadic at best.


    Inertia, Expediency and Superstition

    Why are more formal, engineering-based practices around CSPE needed? Consider the use of CPU utilization as a key performance indicator (KPI) of system performance. I’m a member of Bloomberg’s Trading Solutions SRE team, which manages hundreds of machines on which the company’s Trading Solutions software runs. We often see or hear statements like “This host’s CPU is too busy,” or “That host is out of CPU resources.” I’ve found that these observations are not actually very helpful and sometimes divert our attention from the real problem(s). When misused as a system KPI, focusing solely on CPU utilization can lead us down the wrong path and draw incorrect conclusions. To understand why, let’s first look at how we assess the performance of real-world, non-computing systems.

    Take fast-food restaurants. One of the most important attributes of fast-food restaurants (besides their health inspection rating) is that they are fast. But we’ve all been to fast food restaurants that are anything but fast. Without actually standing in line and waiting, we can often tell that we will have a slow experience at a fast food joint if there is a long line. The line length gives us a lot of information. Our assessment of the situation is different whether there are 100 customers versus 10 customers versus a single customer waiting in line.

    In the real world, this line length (or queue length) assessment is almost universal. Supermarket checkouts, ATMs, airport security screening, toll booths, elevators and COVID-19 testing are all areas where we apply this semi-conscious assessment. In contrast, we almost never use “cashier utilization” or “self-serve soda fountain utilization” as a way of assessing how slow a fast-food restaurant is. We always say “the lines are long” or, if we actually choose to wait in line, we’ll make the more direct statement that “service is slow.”

    Which brings us back to our computing systems. Why do we reflexively look to CPU utilization when computing systems are slow while, in the physical world, we rely on queue lengths? The question is even more relevant when we consider that the concept of CPU is less well-defined today. Are we measuring the CPU, its cores or hardware threads?2 I believe the contributing factors to this misuse include inertia, expediency and superstition.

    In the early days of computing, CPUs were perhaps the most expensive component of the large monolithic computer systems of the time. Measuring how much these expensive components were being used was an important part of maximizing the financial investment in these large machines. Fortunately, measures of CPU utilization were relatively easy to estimate. Ease of implementation meant that CPU utilization measures were almost universally available.

    The universal availability of this simple metric, combined with some correlation (sometimes weak) between high CPU utilization and system slowness made it a default indicator of systems performance. When a belief becomes ingrained to the point of superstition, even weak correlations are enough to validate and perpetuate it. Better metrics—for example, run queue lengths at the CPU(s)3—can help us shed our superstitions to better understand our systems and lead us in the right direction in identifying and correcting problems.

    Dispelling Superstition and Other Irrational Practices

    Which brings us to the title and purpose of this series. As a title, “Of Max and Min” is meant to evoke John Steinbeck’s classic novella “Of Mice and Men,” which in turn got its title from the famous line in Robert Burns’ poem “To a Mouse”: The best-laid plans of mice and men oft go awry. The two main characters in “Of Mice and Men” fail in their efforts to better their lives during the Great Depression because they are tragically ill-equipped to do so. Similarly, we should not be surprised if plans go awry when software engineers are tasked with doing performance engineering without the proper training in performance engineering principles.

    “Max and Min” also highlights the importance of data analysis and statistics in understanding systems behavior. Effective CSPE requires us to be familiar with concepts in statistics, numerical analysis, and even operations research—in addition to the more standard computer science areas of algorithmic complexity and computer architecture.

    With “Of Max and Min,” in addition to calling out superstitions, I will be pointing out some common mistakes we make and blind spots that we have.4 Through case studies, I’ll illustrate how our blind spots can lead to mistakes that can persist for years. I will also try to cover some basic CSPE principles that I believe are skipped in most software engineering training. Like everyone else, I’ve been winging it for 40+ years. And I’m still learning. If you disagree with any of my points or have further insights into the topics that I am presenting, please let me know.


    1But, as in the application of the principles behind algorithmic complexity, there are some performance engineering principles that can and should be adhered to regardless of the system and language du jour.

    2There are in fact some bizarre implementations of “CPU utilization”. Here’s an example of how AIX “broke” the meaning of CPU utilization on their multiprocessor systems running in hyper-threading mode.

    3UNIX and Linux do in fact have metrics that could be used as CPU queue length indicators.  In a future installment, I will go into the quirks of some of the CPU queue length implementations and further argue for more consistent mathematical bases for queue length metric implementations.

    4For example, have you ever wondered why, after so many outages caused by logging, malloc, DNS and other low-level services, we still don’t have good, out-of-the-box visibility into these and other low-level components? We are accepting key blind spots as a fact of life when we really shouldn’t.

    About Me

    Like many software engineers, I started off studying a different field (Physics). Unlike most software engineers, I’ve always wanted to be a performance engineer. When I started taking computer classes as an undergraduate in Columbia College’s Physics program, I did not wish for a career writing programs in Fortran (yes, it was that long ago). But I did envision myself making systems run better and faster.

    To that end, when I added a Computer Science major to my undergraduate studies, I also added a minor in Industrial Engineering and Operations Research. For those unfamiliar with IEOR, it is a multidisciplinary engineering field that leverages mathematical and analytical methods to address complex system problems like resource allocation, supply chains, wait times, fairness, etc. Tools and methodologies from IEOR are invaluable to CSPE.

    At the start of my career, I joined the Bell Labs Computer Center as a computer systems performance engineer, where I made the somewhat contrarian decision (for 1980) to work in the group supporting their in-house, low-key UNIX systems (as opposed to their commercially popular MVS mainframes). I didn’t realize it at the time, but having access to the source code of the system you support/study can be a boon to understanding. At Bell Labs, I had the opportunity to contribute to the UNIX System V kernel, where I co-developed the first general-purpose kernel and user-land tracing system for UNIX and made significant performance enhancements to the virtual memory subsystem, and participated in the PMWG.

    Since then, I’ve spent the bulk of my professional career working on financial software systems—ranging from market data to messaging to transaction management. I’ve worked on monitoring systems on an enterprise level. I’ve made and witnessed many CSPE mistakes. In my current role as an SRE on the Trading Solutions team at Bloomberg, I’m seeing and helping remedy lots of operating system issues that stem from our runtime scale.


    Thanks

    Thanks to everyone who reviewed this document and provided constructive feedback. Special thanks to Nate McNamara and Peter Wainwright for suggesting substantive organizational and structural improvements. Peter also reined in my default stream of consciousness, run-on style. None of them had any hand in the writing of this paragraph.




  • Five Great DevOps Job Opportunities

    Five Great DevOps Job Opportunities

    DevOps.com is now providing a weekly DevOps jobs report through which opportunities for DevOps professionals will be highlighted as part of an effort to better serve our audience.

    Our goal in these challenging economic times is to make it just that much easier for DevOps professionals to advance their careers.

    Of course, the pool of available DevOps talent is still relatively constrained, so when one DevOps professional takes on a new role it tends to create an opportunity for others.

    The five job postings shared this week are selected based on the company looking to hire, the vertical industry segment and naturally, the pay scale being offered.

    We’re also committed to providing additional insights into the state of the DevOps job market. In the meantime, for your consideration:

    Dice.com

    Oscar Technology
    Remote
    DevOps Engineer- Go Language
    $120,000 to $180,000

    LinkedIn

    Proprio
    Seattle, Wash
    Senior ML-DevOps Engineer
    $120,000 to $170,000

    SimplyHired

    DISH
    Littleton, Col.
    Senior DevOps Engineer
    $106,210 to $143,750.

    Indeed.com

    RumbleOn
    Irving, Tex.
    DevOps Engineer
    $115,000 to $135,000

    Monster.com

    PROLIM Corp.
    Washington, D.C.
    AWS DevOps Engineer
    $90,000 to $110,000

  • Dell Launches Project Frontier Initiative to Advance Edge Computing

    Dell Launches Project Frontier Initiative to Advance Edge Computing

    Dell Technologies this week launched Project Frontier initiative that promises to make deploying software at the edge simpler using integrated platforms that will be available in 2023.

    Announced at a Dell Technologies Summit event, Project Frontier will create an integrated edge computing platform for vertical industry segments such as manufacturing and retail.

    Dell CEO Michael Dell told conference attendees these platforms will help customers simplify, optimize and scale their edge applications in a secure way.

    The offerings can be centrally managed either by an internal IT operations team or via managed services that Dell provides to simplify onboarding and ensure zero-trust security. The overall goal is to reduce the number of instances that might require IT personnel in the field to configure and update them.

    According to a 2022 IDC survey, 42% of businesses say the most challenging aspect of edge deployments is putting together an entire edge solution. To address that challenge, Dell is also launching a Dell Edge Design Program through which it will collaborate with customers to further advance edge computing solutions.

    Through its Dell Validated Design program, the company is already building edge computing platforms for specific customers, but the goal now is to make it simpler to deploy edge computing platforms at scale.

    The number of application workloads being deployed on edge computing platforms is rising sharply as organizations seek to process and analyze data closer to the point where it is created and consumed. In fact, that shift is at the core of many digital business transformation initiatives that depend on edge computing platforms and devices running, for example, internet of things (IoT) applications to process data in near-real-time.

    A major issue—and one that remains largely unsolved, in many cases—is that organizations lack the ability to consistently deploy software on edge computing platforms. That results in a hodgepodge of homegrown tools deploying software on a wide range of edge computing platforms using manual processes that don’t scale well.

    It’s too early to say just how much software will ultimately be deployed on the edge, but there may come a day when there is more software at the edge than there is in the cloud. Of course, the real challenge will be unifying the management of DevOps processes, regardless of where any given piece of software might be deployed. In fact, Dell is betting that as edge computing continues to evolve, the line between edge computing and cloud computing will continue to blur until they are little more than natural extensions of each other.

    Dell, of course, is not the only IT vendor that views edge computing as the next trillion-dollar IT opportunity. There is already no shortage of options. The issue will be determining which IT vendor has the most robust edge computing ecosystem. In the meantime, DevOps teams would be well-advised to revisit DevOps workflows now with an eye toward making sure they can truly scale. After all, as edge computing platforms continue to proliferate, their ability to build, deploy, update and secure software is about to be put to the ultimate test.

  • Kill the Password: Google on Board | 4-Day Week Proves Worthy

    Kill the Password: Google on Board | 4-Day Week Proves Worthy

    Welcome to The Long View—where we peruse the news of the week and strip it to the essentials. Let’s work out what really matters.

    This week: Passkeys is getting another big-tech supporter, and the four-day workweek train picks up speed. (more…)

  • Microsoft Expands DevOps Portfolio in the Cloud

    Microsoft Expands DevOps Portfolio in the Cloud

    At the Ignite conference this week, Microsoft launched a slew of updates to its DevOps portfolio as part of an effort to make it simpler to build, manage and secure cloud applications.

    Microsoft is adding Azure Deployment Environments, available in preview, that enable developer teams to invoke a set of best practices to quickly spin up application infrastructure using project-based templates.

    Microsoft is also making generally available Visual Studio Image for Dev Box, a self-service environment for accessing workstations on the Microsoft Azure cloud. Those images make it simpler to access Visual Studio functions and complimentary tools. Microsoft has also made generally available the latest version of the Visual Studio 2022 application development platform.

    In addition, Microsoft has signed an agreement with Postman to collaborate on integration that promises to accelerate the development of application programming interfaces (APIs) starting with the ability to both import and export APIs from Azure API management into Postman.

    Microsoft is also making generally available a predictive tool that employs machine learning algorithms to automatically scale virtual machines on Azure. In addition, updates to the Azure Monitor Log service now make it possible to ingest logs at a fifth of current costs and archive them for up to seven years. ​​​​​​​Microsoft is also now providing tools to migrate from legacy log agents to the Azure Monitor Agent (AMA) and has added Java profiling with a Java Flight Recorder (JFR) tool that collects data from a Java virtual machine and Java applications.

    In terms of managing application environments, Microsoft has now extended the reach of Azure Automanage to now include servers managed via the company’s Arc management platform, in addition to virtual machines running on the Azure cloud. Other capabilities added to Azure Automange include enhanced backup settings and different auditing modes for the compute server baselines and the ability to specify custom Log Analytics Workspaces and Azure tags to identify resources based on settings.

    Microsoft is also previewing an enhanced Azure remote support service through which Microsoft personnel will collect logs and commands to help resolve issues.

    Finally, in terms of securing applications, a GitHub Advanced Security for Azure DevOps tool that, now available in private preview, promises to make it simpler to identify and fix exposed secrets and vulnerable open source dependencies across the software life cycle using a CodeQL code scanner.

    At the same time, Microsoft is making available Microsoft Defender for DevOps to better secure code created to configure clouds. In addition, it will also enable DevOps teams to better prioritize their remediation efforts across multi-pipeline DevOps environments spanning multiple clouds. Microsoft Defender for DevOps is available in preview and supports GitHub and Azure DevOps with future support for other DevOps platforms planned.

    Another security addition available in preview is Microsoft Defender Cloud Security Posture Management (CSPM), which promises to provide contextual risk-based information via attack path analysis surfaced using a cloud security graph service to identify the most exploitable cloud resources. Microsoft has also made generally available a multi-cloud security framework for Microsoft Defender for Cloud to help organizations adopt DevSecOps best practices.

    Microsoft is also previewing support for agentless scanning for Microsoft Defender for Servers and an expansion of Microsoft Defender for Containers that adds support for Amazon Web Services Elastic Container Registry.

    Microsoft CEO Satya Nadella told conference attendees that Microsoft is making a concerted effort to natively embed security capabilities within its platforms to reduce the total cost of security. Many of the tools DevOps teams rely on today don’t integrate well, which is challenging at a time when application environments are becoming more dynamic as more cloud-native applications are deployed.

    It’s too early to say how much better security will entice organizations to opt for one cloud platform versus another. But it is almost certain that cloud service providers will be expected to contribute to securing software supply chains.

  • GraphQL: Security by Obscurity Just Isn’t Enough

    GraphQL: Security by Obscurity Just Isn’t Enough

    The debate about how to secure GraphQL rages on. Many organizations are hesitant to adopt GraphQL for public-facing APIs as there is no precise method to handle authorization concerns as of yet. Without a role-based access layer to enable fine-grained permissions for each field (and underlying services that GraphQL might wrap), the query language can be prone to access control issues.

    One method to hamper GraphQL access is to turn off introspection features altogether. Some may assume that hackers can’t perform introspection on an endpoint if it’s not visible. But this isn’t entirely true—even though an “internal” endpoint may not be fully documented, any endpoint on the public web can be searched and introspected quite easily by brute-forcing queries or through field suggestions.

    I recently met with Karim Rustom, cybersecurity engineer, Escape Technologies. According to Rustom, “making something obscure isn’t enough to make it secure.” Leveraging a single slip-up in access control could be used as a doorway into these systems. Although it’s a best practice to limit introspection, it’s likely not enough to protect production GraphQL endpoints, he said. Below, we’ll consider some common GraphQL threats and alternative solutions to retain a safe GraphQL implementation.

    Common GraphQL Threats

    Having run thousands of scans on production GraphQL endpoints, Rustom found common trends emerge around GraphQL threats. First, he noticed the potential for denial-of-service attacks to be quite high. GraphQL, by design, is intended to query whatever data the client requires. But sometimes, these queries can return a mountain of data.

    If GraphQL owners don’t place a limit on what can be requested in a single query, the platform can easily fall victim to denial-of-service attacks and service interruptions. And limits aren’t only necessary for bulk read-only operations—although GraphQL is primarily used for fetching data, some methods might initiate intense server-side processing, which should be limited in some form. According to Rustom, such data manipulation methods are especially pervasive in FinTech, food delivery or health care-related applications.

    Another rampant GraphQL threat lies in access control issues. This comes as little surprise, as access control is ranked as OWASP’s most common web application security risk. Often, when creating new objects or new queries, a developer might forget to add the correct authorization, said Rustom. This can become a huge problem and lead to privilege escalation.

    Finally, too many production GraphQL implementations rely on security by obscurity. “Folks think that disabling introspection is a layer of security—we highly stress that it’s not,” said Rustom. He recalled performing penetration testing for a certain client; even though they had disabled introspection, the team was able to fetch ample open paths and discover an unsecured doorway to divulge secret internal knowledge.

    Solutions and Best Practices

    To avoid some of the vulnerabilities presented above, it’s recommended to first place request limits on overly complex GraphQL calls to prevent denial-of-service attacks. One nuance here that Rustom recommended is to consider request complexity—not in terms of the query size, but the overall processing required. He suggested assigning scores for every query and permutation to help inform the decision about whether or not to process the incoming call.

    Furthermore, it’s recommended to disable field suggestions as the feature could be prone to abuse. Using field suggestions, hackers can leak a lot of information to build a partial or complete introspection. These tactics are similar to the word-busting techniques black hats use to perform introspection on REST endpoints.

    Although it’s a good practice to limit the possibility of surveillance, hackers can still discover systems and leverage other common vulnerabilities like broken access control. Rustom suggested other tactics, such as luring attackers into a honeypot or logging them into a fake account. Or, creating error messages that are intentionally misleading for a attacker.

    To retain a safe GraphQL implementation, organizations can use pre-made free and open source tools to audit their surface area and scan for known vulnerabilities. For example, GraphQL.security quickly scans your GraphQL URL endpoint to discover vulnerabilities. Or, Graphinder can examine a subdomain to discover GraphQL endpoints, which could aid auditing purposes. There’s also middleware that wraps a GraphQL service with additional security, such as GraphQL Armor and GraphQL Shield.

    Future of GraphQL in the Market

    There appear to be many flavors of GraphQL throughout the market. We’ve seen it emerge as a mechanism to power backend microservices. We’ve also witnessed the technology adopted as a layer to centralize multiple REST services with a more usable data retrieval mechanism for frontend engineers. Some GraphQL endpoints also run on the public web to serve end clients and external partners.

    “GraphQL is a beautiful technology, just lacking in security,” said Rustom. And unfortunately, his outlook for API security looks grim—amid political turmoil and economic instabilities in regions like Europe, some companies may seek to cut cybersecurity investments to stay lean. For companies that haven’t yet suffered a breach, security is easy to ditch to slim budgets, but it should remain a priority, said Rustom. “Keep securing GraphQL.”

  • Google Looks to Secure Software Supply Chains

    Google Looks to Secure Software Supply Chains

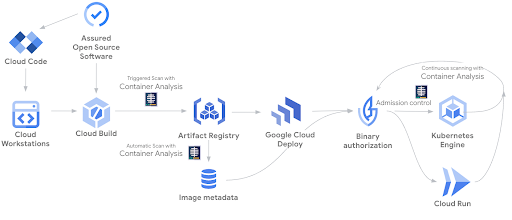
    At the Google Cloud Next ’22 conference, Google today launched a managed Software Delivery Shield (SDS) service to enable DevOps team to store, manage and secure the build artifacts in Artifact Registry. At its core, SDS is based on a trust-based policy engine to establish, maintain and verify a chain of trust across the software supply chain.

    In addition, Google has updated its container analysis tool to include vulnerability scanning for Maven and Go containers along with preview support for non-containerized Maven packages.

    The managed Software Delivery Shield service spans a range of Google runtimes environments, including Google Kubernetes Engine (GKE), Cloud Code, Cloud Build, Cloud Deploy, Artifact Registry and Binary Authorization. Cloud Build also now officially supports Supply chain Levels for Software Artifacts (SLSA) Level 3 best practices by default in addition to generating authenticated and non-falsifiable build provenance for both containerized applications and non-containerized Maven and Python packages.

    GKE, in preview now, provides detailed assessments, assigns severity ratings and surfaces the security posture of the clusters and workloads, including insights into operating system vulnerabilities, workload configurations and other actionable insights. Log data can now also be captured while security event information can be routed to, for example, a security information and event management (SIEM) platform.

    The Google Cloud Run serverless platform can also, in preview, display software supply chain security insights such as SLSA build-level compliance, build provenance and vulnerabilities found in running services.

    At the same time, Google is also making available in preview Cloud Workstations, which provide fully managed secure development environments on Google Cloud that can be accessed via a browser. Built-in security capabilities include virtual private cloud (VPC) controls, no local storage of source code, private ingress/egress, forced image updates and identity access management (IAM) policies.

    Finally, the Cloud Code plug-in for integrated development environments (IDEs) now includes a preview of Source Protect to give developers real-time security feedback in the form of vulnerability dependencies and license reporting as they write code.

    Collectively, Google claimed it now provides more than 250 curated packages across Java and Python with verified provenance. It also automatically generates a software bill of materials (SBOM) to create an inventory of all components and dependencies.

    Historically, cloud service providers have been advocating a shared responsibility approach to cloud security that required organizations to not only secure their applications but also the way cloud infrastructure is provisioned. The challenge is developers generally provision cloud infrastructure themselves even though they generally have limited cybersecurity expertise. Too many developers assume the underlying cloud infrastructure is more secure than it actually is.

    Now, cloud service providers are extending the security services they provide at a time when organizations are making security a bigger factor in determining where to build and deploy applications.

    Sunil Putti, vice president and general manager for Google Cloud Platform, said Google is attempting to make cybersecurity invisible to developers in the sense that guardrails will automatically be embedded within the platform.

    The issue is that cloud computing environments are becoming more complex as new classes of cloud-native applications are deployed alongside legacy monolithic applications. Complexity, as always, is the enemy of cybersecurity.

  • GitLab Allies With Google to Improve Developer Productivity

    GitLab Allies With Google to Improve Developer Productivity

    GitLab Inc., in collaboration with Google, today launched an open source Cloud Seed tool that makes it simpler for DevOps teams to consume Google Cloud Platform (GCP) resources.

    The Cloud Seed tool, announced at the virtual Google Cloud Next ’22 conference, is integrated within the GitLab web UI to make it simpler for developers to consume Google cloud resources—such as Cloud Run for building and deploying containerized applications—and the managed Cloud SQL database service.

    Nima Badiey, global vice president of alliances for GitLab, said the goal is to reduce friction that would otherwise be created by requiring developers to write code to consume these services using a set of lower-level application programming interfaces (APIs).

    That self-service approach not only improves productivity but provides the added benefit of reducing the odds those services might be misconfigured in a way that creates a cybersecurity vulnerability, he added.

    As it seeks to gain ground on Amazon Web Services (AWS) and Microsoft, Google has a vested interest in working with providers of DevOps platforms to make it simpler for developers to consume cloud resources. The challenge is that developers often make mistakes when they programmatically invoke cloud services. Those resulting misconfigurations are all too often not discovered and remediated until after there has been some type of cybersecurity incident.

    In the wake of a series of high-profile breaches of software supply chains, there is a lot more focus on security. The challenge, of course, is finding a way to ensure application development platforms are as secure as possible without slowing down the rate at which software is developed and deployed. Achieving that goal requires the right mix of policies, training and systems, said Badiey.

    Most organizations are trying to strike a balance between the need for greater security and their need to attract and retain developer talent. In theory, the rise of DevSecOps best practices is pushing more responsibility for security further left toward developers. However, most developers have little to no cybersecurity expertise, so it’s clear more guardrails need to be built into DevOps tools and platforms to prevent cybersecurity mistakes from being made.

    It’s not clear how much improved developer productivity and greater security will drive organizations toward one cloud platform versus another, but in an age where many more organizations now routinely employ two or more cloud platforms, it could make a significant difference. Developers don’t especially enjoy remediating applications after they are deployed in a production environment because they have generally already moved on to other projects. IT operations and cybersecurity professionals are also likely to nudge developers toward platforms that create the least amount of operational overhead for them.

    Regardless, one thing that is certain is compliance requirements are about to become stricter for all concerned as scrutiny of software supply chains intensifies in the months ahead. The issue now is how to proactively address those requirements before they become a much larger issue.

  • Microservices Explained: Not Your Father’s SOA

    Microservices Explained: Not Your Father’s SOA

    Microservices are frequently referred to as a variant or derivative of service-oriented architecture (SOA), if not essentially the same thing. While there are similarities and both are designed around the concept of services, that’s where the similarities end. Each was created around a different set of principles and intended to address different problems.

    Microservices architecture is built around key concepts that, when applied, not only differentiate it from other architectures but deliver advantages that accelerate software delivery and help to scale large, complex applications. To deliver on the promise of cloud-native, microservices must be loosely coupled so that, ultimately, they are independently deployable. Any microservice can be updated and deployed—just that containerized microservice—without requiring changes to other microservice(s). Loosely coupled microservices mean they are not sharing databases or maintaining state, for example.

    How big should a microservice be? Or, in other words, how much should it do? The answers range from ‘a single thing’ to ‘a small set of related code with high cohesion’. Another factor is that getting too granular can overrun a microservices-based application with large numbers of microservices, increasing complexity and making triage through observability and tracing very challenging.

    Scaling microservices-based apps is another important factor. Autonomous microservices can be replicated and scaled for performance and workload using container orchestration tools such as Kubernetes.

    Microservice communications are achieved through well-thought-out APIs created around the business or operational capabilities the microservice provides to anyone or anything engaging through the API. The API, and data provided through the API, are often referred to as ‘technology-independent.’ It’s probably better stated that microservice APIs are built using approaches like RESTful and GraphQL over networks that are not tied to any one specific operating environment, technology or programming language. JSON, YAML and XML similarly represent data that is transferable across technologies.

    The following diagram of a media application demonstrates the principles of microservices architecture. Microservices for scheduling media, digital rights management, tracking impressions and adding new ad insertions are loosely coupled, autonomous and have well-defined API interfaces. Each microservice can be changed, enhanced and deployed rapidly and independently of other microservices.
    Microservices SOA

    Service-oriented Architecture, or SOA, emerged to solve a very different problem; the overwhelming size and complexity of monolithic applications. Monolithic applications have very large codebases that often don’t do a good job of compartmentalizing functional or business logic. This makes changes to the codebase challenging even to developers who know much of the codebase well.

    Services in SOA were often used to gather a collection of similar business logic together and then share them as a service with other parts of the application, as needed. Technologies like message buses are used to make requests of a service and operate as traffic managers for requests across multiple services and other parts of the application. While reusability was a critical design consideration, SOA services were still quite large, and deploying services at high velocity was not an important design consideration. SOA services often take considerable time to code and test the service including interdependencies across other parts of the application before deploying as part of a larger software release.

    One important note: There are benefits and drawbacks to microservices and SOA architectures; neither is ‘better’ than the other. Which architecture to use when mainly depends on the purpose of the application you are building. For larger, more complex enterprise application environments that require integration with many other applications, you might choose SOA. That’s a better fit than for smaller applications that don’t require middleware elements for managing the requests within the app or between other applications. Microservices, on the other hand, are better-suited for smaller and well-partitioned web-based systems. They are becoming the standard for today’s cloud-native applications, and also are a great fit for developing a mobile or web application because they give developers more control.

  • Allstacks Adds Alert Capability to VSM Platform

    Allstacks Adds Alert Capability to VSM Platform

    Allstacks has added an alert capability to its software-as-a-service (SaaS) value stream management platform that automatically notifies DevOps teams when software project goals and deadlines are likely to be missed.

    The core Allstacks platform employs machine learning algorithms and artificial intelligence (AI) models to keep track of pull requests, commits and card changes via a set of dashboards that are designed to be accessible to anyone in an organization.

    The Allstacks Alerts capability makes it possible to notify those stakeholders via email or Slack any time a specific indicator, such as a pull request, has been open for four days, which would suggest risks of delays have increased. Support for Microsoft Teams will be added early next year.

    Adam Dahlgren, senior vice president of product for Allstacks, said the goal is to leverage the advanced analytics built into the platform to surface thoughtful observability insights versus simply firing off a series of generic alerts that lack any context.

    Value stream management (VSM) platforms such as Allstacks automatically take technical metrics collected via DevOps tools and correlate them to key performance indicators (KPIs) defined by business leaders. The concept of value stream management traces its lineage back to lean manufacturing methods, which called for each step of a manufacturing process to be continuously measured. As software development has evolved from being a craft to a highly-automated process using DevOps best practices, an appreciation for the value of monitoring the impact of missed software development deadlines on the business has grown as organizations realize how dependent they are on software.

    In fact, many organizations are discovering there is a clear disconnect between their business goals and software development processes. Business leaders are especially anxious to understand how a software development project delay might impact future revenue projections at a time when economic conditions are the most uncertain they’ve been in recent memory.

    VSM platforms also make it possible to track KPIs spanning multiple software development projects; the hope is that doing so will make it easier to see where resources should be reassigned as various bottlenecks are encountered. In the long term, Allstacks is also working toward adding scenario planning tools to make it easier for IT and business leaders to model “what-if” scenarios, added Dahlgren.

    It’s not clear how much organizations are willing to invest in VSM platforms, but the need for them is becoming more acute. The challenge many organizations still face is making sure they have the tools in place to collect the appropriate technical metrics. A SaaS-based platform should make it simpler to achieve that goal and to apply algorithms to what can quickly become a large corpus of data.

    Of course, it’s still early days as far as the adoption of VSM platforms are concerned. But there’s no doubt the divide between application development teams and the rest of the business is continuing to narrow. Less clear is to what degree that increased visibility will lead to a higher degree of empathy between dev teams and the business.