Category: DevOps Toolbox

  • CI of Complex Cluster Environment with CircleCI and DigitalOcean

    CI of Complex Cluster Environment with CircleCI and DigitalOcean

    At CloudSlang, we’re passionate about all thing open source. Integrating with other open source projects is a key part of what we’re all about. We focus on integrating with many cloud native technologies, such as CoreOS, Docker, and Consul.

    As such, it is important for us to test these integrations automatically as part of our CI. But setting up a complex cluster environment (like CoreOS/Swarm cluster) using popular CI solutions such as Travis or CircleCI for testing can be tricky.

    In this post we’ll outline how we test our content integrations using a combination of DigitalOcean, CircleCI and CloudSlang. The same formula can be used to set up your own complex testing environments.

    Recently CloudSlang introduced a testing framework to write tests for CloudSlang content and run them with the Build Tool. The Build Tool’s features include grouping tests into test suites and validating flow results, expected outputs or exceptions.

    CloudSlang has a fast growing repository of content which is housed on GitHub. When a flow in the repository is changed it can affect other parts of the content that depend on the changed flow. Therefore, it was crucial for us to come up with a proper CI solution.

    After investigating the available CI providers and our configuration needs, we decided to split our test suites in two categories and distribute them between CircleCI and Travis. Both solutions are based on the CloudSlang Build Tool to validate our content: CircleCI runs cluster related test suites (e.g. CoreOS, Docker Swarm) and base content (which does not require SSH access) while Travis handles most of the Docker content and flows that require access to the environment via SSH.

    Logical Steps of the Build Process

    The process begins with working on a local content repository. The content repository contains two main folders: content (for regular CloudSlang files) and test (test related CloudSlang files). The changes could be adding new content and tests or just updating the existing files.

    After the changes are completed they are committed to a working branch. When all the commits are ready, they are pushed to GitHub and associated with a pull request.

    Any changes pushed to the pull request trigger a CircleCI build which is configured based on a circle.yml file. CircleCI builds your code using Docker containers. Currently we use a parallelism of two containers, each of them running the Build Tool. Combining CircleCI’s parallel modifier and environmental variables (e.g. node index) you can specify if a command should be executed on every machine (downloading the Build Tool) or just a specific one (creating resources that are used by only one machine).

    circle.yml

    test:
      pre:
        - ? > ### machine 0
            if [ "${CIRCLE_NODE_INDEX}" = "0" ];
            then docker run -d -p 49165:8080 jenkins
            && docker run -d -p 8500:8500 -p 8600:8600/udp fhalim/consul;
            fi
          : parallel: true
        - if eval "${RULE_DROPLET_MACHINE_NOT_FORK}"; then chmod +x ci-env/create_droplets.sh && ci-env/create_droplets.sh; fi:
            parallel: true ### machine 1
        - ? > ### every machine
            wget https://github.com/CloudSlang/cloud-slang/releases/download/cloudslang-0.8.0/cslang-builder.zip
            && unzip cslang-builder.zip -d cslang-builder
            && chmod +x cslang-builder/bin/cslang-builder
            && mkdir cslang-builder/lib/Lib
            && pip install -r python-lib/requirements.txt -t cslang-builder/lib/Lib
          : parallel: true
        - ? > ### machine 1
            if eval "${RULE_DROPLET_MACHINE_NOT_FORK}";
            then chmod +x ci-env/wait_for_droplets_and_update_test_inputs.sh
            && ci-env/wait_for_droplets_and_update_test_inputs.sh;
            fi
          : parallel: true

    On the first machine (machine 0) the default test suite is activated. It verifies the base content which includes things like working with files or string operations. This test suite does not require additional environmental configuration.

    Tests running on the second machine (machine 1) require additional configuration. In this case we are using a cluster of CoreOS machines as the infrastructure used by the test flows. We use DigitalOcean to create and manage the CoreOS machines (droplets). Each build has its own set of droplets named after the following convention: ci-{build_number}-coreos-{machine_number} so the builds are running completely independently.

    Once all the parallel executions finish running, CircleCI collects and evaluates the build result. CircleCI also publishes an artifact called execution.log which is created by the Build Tool and contains relevant logging information about the execution – which can be very useful when debugging flow executions.

    Running tests against the droplets

    The second container’s execution phases are presented in the following image:

    These steps use bash scripts to execute relevant commands. The scripts and configuration files can be found under the ci-env directory. Droplets are created and managed using DigitalOcean’s REST API. The first step (create_droplets.sh) generates a discovery URL for the CoreOS cluster and updates the cloud-config file with the newly created URL. The  cloud-config file contains regular CoreOS configuration data for the cluster (private networking configuration, starting up services like etcd and fleet) and a write_files section where we prepare a unit file (docker-tcp.socket) for the Swarm use cases (this socket will be used to enable Docker Remote API). Once the cloud-config file is ready we can create the droplets by sending POST requests to DigitalOcean:

      CURL_OUTPUT=$(curl -i -s -X POST https://api.digitalocean.com/v2/droplets \
                    -H 'Content-Type: application/json' \
                    -H "Authorization: Bearer ${DO_API_TOKEN}" \
                    -d "{
                      \"name\":\"${COREOS_MACHINE}\",
                      \"ssh_keys\":[${DO_DROPLET_SSH_PUBLIC_KEY_ID}],"'
                      "region":"ams3",
                      "size":"512mb",
                      "image":"coreos-stable",
                      "backups":false,
                      "ipv6":false,
                      "private_networking":true,
                      "user_data": "'"$(cat ci-env/cloud-config.yaml | sed 's/"/\\"/g')"'"
                    }')

    The request is dynamically generated using global environmental variables defined in the project’s properties page (DO_API_TOKEN, DO_DROPLET_SSH_PUBLIC_KEY_ID), environmental variables defined in the script (COREOS_MACHINE: name of the machine, depends on build number) and cloud-config file. The script also verifies that the requests were accepted by DigitalOcean (status code: 202) storing the droplet IDs in an array:

    DISCOVERY_URL: https://discovery.etcd.io/5f30dd91642ae055ff24efd6b2359f3d
    ci-1439-coreos-1 (ID: 6748964) droplet creation request accepted - status code: 202
    ci-1439-coreos-2 (ID: 6748965) droplet creation request accepted - status code: 202
    ci-1439-coreos-3 (ID: 6748966) droplet creation request accepted - status code: 202

    The second step (which is executed in parallel for both build machines) downloads and prepares the Build Tool. The related commands are read from the circle.yml file.

    The third step (wait_for_droplets_and_update_test_inputs.sh) waits for the droplets to become operational, adds the necessary post startup configuration (e.g. activating TCP socket for Docker Swarm) and updates the inputs with the actual information (droplet IP addresses, private key file location). The script is periodically checking the droplet status by sending GET requests to DigitalOcean:

    Droplet(6748964) information retrieved successfully
    Droplet(6748964) status: new
    Droplet(6748964) information retrieved successfully
    Droplet(6748964) status: new
    Droplet(6748964) information retrieved successfully
    Droplet(6748964) status: new
    Droplet(6748964) information retrieved successfully
    Droplet(6748964) status: active
    Droplet(6748964) IPv4 address: 188.166.45.76

    Here we combine regular bash scripting (grep, awk) with Python (for complex data processing):

              IP_ADDRESS=$(\
              echo "$RESPONSE_BODY_JSON" | python -c \
    '
    if True:
              import json,sys;
              obj = json.load(sys.stdin);
              ipv4_container_list = obj["droplet"]["networks"]["v4"];
              public_ipv4_container_list = filter(lambda x : x["type"] == "public", ipv4_container_list);
              print public_ipv4_container_list[0]["ip_address"] if len(public_ipv4_container_list) > 0 else "";
    '\
              )

    Two CoreOS machines will be used as Swarm agents (the remaining one will have the Swarm manager) so we need to enable a Docker socket for these machines. The unit file which defines the socket was created at droplet startup time based on the cloud-config file. At this stage we need to enable the socket with the following command:

      LAST_LINE=$(ssh -i ${SSH_KEY_PATH} \
      -o UserKnownHostsFile=/dev/null \
      -o StrictHostKeyChecking=no \
      core@${DROPLET_IP} \
      'sudo systemctl enable docker-tcp.socket \
      && sudo systemctl stop docker \
      && sudo systemctl start docker-tcp.socket \
      && sudo systemctl start docker \
      && echo -e "\nSUCCESS"' | tail -n 1)

    Now the droplets are ready to be accessed. While the CoreOS cluster is properly configured, the Swarm cluster will be set up using flows since Swarm is based on Docker containers (need to run manager and agent containers on the machines). The last step before starting the Build Tool is updating the test input files with the actual data (e.g. IP addresses of the droplets):

    find test -type f -exec sed -i "s/<coreos_host_1>/${DROPLET_IP_ARRAY[0]}/g" {} +

    At this point everything is prepared to run the tests. The Build Tool is executed by activating the relevant test suites. The flows in these suites interact with the droplets using SSH calls. The Build Tool displays relevant statistics about the execution – coverage, how many test cases passed and cause of the problem in case of test failures.

    02:41:58 [INFO] 97% of the content has tests
    02:41:58 [INFO] Out of 158 executables, 154 executables have tests
    02:41:58 [INFO] 
    02:41:58 [INFO] ------------------------------------------------------------
    02:41:58 [INFO] BUILD SUCCESS
    02:41:58 [INFO] ------------------------------------------------------------
    02:41:58 [INFO] Found 153 slang files under directory: "/home/ubuntu/cloud-slang-content" and all are valid.
    02:41:58 [INFO] 11 test cases passed
    02:41:58 [INFO] 145 test cases skipped

    Once the tests finish – in the last step – we need to delete the droplets used for this build by sending DELETE requests to DigitalOcean (cleanup_env.sh).

    Managing Sensitive Data

    Since the working mechanism of our build system is based on heterogeneous components we need a secure way to store sensitive data (e.g. DigitalOcean API token for authentication). CircleCI provides the possibility to define global environmental variables where we can store this kind of data. These environmental variables are not included in builds which come from external pull requests (pull requests created by users who are not part of CloudSlang organization), otherwise they could be easily obtained. Someone could print them by modifying the circle.yml file inside the pull request.

    Conclusions

    In this post we’ve show you how CloudSlang developed its own continuous integration mechanism by combining technologies like the Build Tool (the worker that executes tests), GitHub to host the codebase, CircleCI (CI solution to define the skeleton of the build system) and DigitalOcean (IaaS provider to host testing machines).

    If you would like to learn more about the build system or just check out the project, visit us at CloudSlang’s website or GitHub page.

    And remember – keep the bar green …


  • Does MariaDB replace the “M” in LAMP

    Does MariaDB replace the “M” in LAMP

    If you were starting a new application tomorrow, which backend would you use? Chances are you said MySQL. However post Oracle acquisition MySQL has changed. After Oracle purchased the code they broke the hearts of many. And there is hope that MySQL has re-invented itself in the form of MariaDB

    (more…)

  • Practice Safe SSH with Teleport

    Practice Safe SSH with Teleport

    Decentralized Key Management and Sharing Is Not The Answer ­­ Practice Safe SSH with Teleport

    View PostAll projects start off with the best intentions, user management and security around accounts won’t be an afterthought. Despite those intentions, the requirements to move fast tend to override things suchDecentralized Key Management and Sharing Is Not The Answer ­­ Practice Safe SSH with Teleport All projects start off with the best intentions, user management and security around accounts won’t be an afterthought. Despite those intentions, the requirements to move fast tend to override things such as account hygiene, and before you know it, you are trying to manage hundreds, if not thousands, of SSH keys and privileged accounts either manually or with a tool that wasn’t designed for key management. You also probably need to keep track of authorization privileges, and a shared document or spreadsheet is not the correct method, especially when you have systems that need to be PCI compliant or are in SOX scope.

    Centralized Key Management

    Does your current SSH key management strategy feel like this? Are you using manual methods to distribute and manage SSH public keys? As the number of hosts and users increase, this method becomes more and more unwieldy and also can present you with security and compliance risks. By moving to a centralized approach with Conjur’s Teleport open­ source solution, you are now able to benefit from the following: ● No more SSH key sharing between developers ● Each developer has their own unique login, with their own distinct set of privileges ● Simple SSH key creation and deletion

    User Management

    A proper strategy for programmatic provisioning and deprovisioning of user accounts is equally as important as SSH key management. In addition to SSH key management, Teleport also provides an LDAP service that allows for a customized list of users/groups that can be associated with specific projects and environments. When a new developer joins a project, you can quickly programmatically provision the account and access rights, and when a developer departs, you can revoke the rights as well as remove the SSH key.

    SSH Key Rotation

    Scheduled SSH Key rotation should also be part of the overall security strategy and posture, and for those systems that need to be PCI DSS compliant, SSH keys need to be rotated annually. By providing a centralized SSH key solution, Teleport allows you to seamlessly rotate the keys, as well as keep a detailed audit log around which key was rotated when.

    Conclusion

    SSH is a powerful tool that provides a great deal of value and security for your developers, but with that great power comes great responsibility. Teleport is a tool that allows you to provide that power to your developers while also knowing that you are practicing safe SSH and are being secure and responsible.as account hygiene, and before you know it, you are trying to manage hundreds, if not thousands, of SSH keys and privileged accounts either manually or with a tool that wasn’t designed for key management. You also probably need to keep track of authorization privileges, and a shared document or spreadsheet is not the correct method, especially when you have systems that need to be PCI compliant or are in SOX scope.

    About the Author/Mike Kail

    mike_kailMike Kail was Yahoo’s CIO and SVP of Infrastructure, where he led the IT and Data Center functions for the company. He has more than 24 years of IT Operations experience with a focus on highly scalable architectures, prior to joining Yahoo. Most recently, Kail served as VP of IT Operations at Netflix. Prior to that, he was VP of IT Operations at Attensity, where he was responsible for the Americas data center operations team; including managing various big data systems with their Hadoop cluster, HBase, and MongoDB components. He has been recognized widely for his insightful industry commentary on Twitter, and was recently named by the Huffington Post as one of the “Top 100 Most Social CIOs on Twitter.” He holds a B.S. in Computer Science from Iowa State University. Reach out to him on Twitter or LinkedIn.

  • Impacts of DevOps on Testing

    Impacts of DevOps on Testing

    DevOps

    I always come across a standard question from testers in any DevOps related presentation. “Will DevOps remove the need for Testers?” A simple answer is “No”. DevOps is not going to replace Testing as a discipline. Firms implementing DevOps have a vision for better product quality workable by brilliant Testing.

    DevOps is an enabler for the following.

    • Reduction in IT Budgets
    • Efficient end-to-end delivery
    • Lean delivery framework
    • Working end-to-end automation framework

    Successful businesses today are design thinking driven. Businesses have a strong sense of urgency, aided by innovative software engineering practices. Businesses today need to have a working continuous delivery practice in place. Continuous delivery also mandates better product quality and zero touch end-to-end delivery. Automaton is key to success across DevOps processes.  Delivery by co-located, integrated teams using innovative tools prevents collaboration and communication issues.

    Manual errors, Stove-piped communication issues get sorted with a good DevOps Governance model.

    DevOps mandates “Fail Fast, Fail Often” driven by “Test First” concept. This means that testing is a continuous process and more extensive in nature. Testing allows for cohesiveness between various teams, automation of everything possible. Testing also allows for continuous improvement in test process delivered via iterations. Intelligent test automation, improved regression, continuous test augmentation are some benefits delivered by DevOps.

    • Key benefit delivered byDevOps is the cost reduction in end-to-end delivery.Businesses achieve cost reduction by Automation, manual error reduction and reduction of duplicate effort.
      • Continuous delivery enables streamlined governance and reduces time-to-market.
      • With fail-first, fail-fast, fail-often philosophy, shift-left testing is a reality. With early defect identification, product quality increases. With increased automation, continuous testing is a feasibility.
      • With co-location, productivity of DevOps teams (design, test, operations) improves.

    Implementing DevOps could be tricky in organizations having monolithic systems and processes. Culture change is critical for successful initiation of DevOps and Continuous Delivery.

    From a testing standpoint, DevOps addresses the following key testing challenges.

    • Test Environment – Virtualization, Automated Deployment, Automated build and configuration management, data refresh and maintenance becomes simple
    • Continuous Integration, Automation and Verification – Test First centric test driven development, behavior driven development concepts allow test processes to improve in a DevOps Model

    As per a report published in 2002 by NIST – Cost of Poor Quality (in US) was $59.5 Billion per year. Cost of poor quality is higher in large organizations running legacy infrastructure. By some industry guesstimates average cost of a production bug is about $7000. Customer experience and agility for quick delivery takes a hit if the organizations aren’t quicker. DevOps becomes a positive catalyst here.

    Some skeptics may say “DevOps looks easy on paper but difficult to put in place”. Any innovative change is difficult to implement at first. It takes discipline and drive to run the operations watertight to achieve the goals.

    Some key factors to implement for Successful DevOps are

    • Cohesive, One Team mentality between teams
    • Implementation and Use of Tools that take away manual effort
    • Continuous Delivery Phases
      • Superior, Automated Configuration Management Approach
      • Continuous Improvements across phases
      • Continuous Automation
      • Continuous Integration
      • Continuous Testing
      • Continuous Monitoring

    Use of tools is key to success of a DevOps program. Plethora of tools are available to support automation. Tools are available for Environment Build, System Configuration, Application Build, Database Setup, Artifact/Document Generation, Testing, Requirement Management, Collaboration, Production Monitoring, and Reporting across DevOps activities.

    Like Agile Delivery Programs DevOps needs a strong Team Cohesion to be successful. A DevOps team need to have a Product Life-cycle Management mindset as well. This also means that team needs to unlearn standard SDLC processes.  This means, DevOps team should have a clear vision. Vision to Ideate, Implement, and improvise and retire the product. An integrated DevOps team with clear vision will make DevOps projects successful.

    Conclusion:

    DevOps testing needs to address the need of Business and Technology needs. Automation plays a major role to achieve this aim. DevOps in principle has a goal for better product quality albeit the need for faster delivery. Terms such as “Shift-Left”, “Fail-First, Fail-Fast, Fail-Often” will be regular vocabulary in DevOps. DevOps Test team comprises of Cross Functional Specialists and Testing Purists. A Performing Testing Practice for DevOps will take some time. Testing as a practice has matured over the past two decades and is well equipped to support DevOps. Use of automation and productivity enhancement tools helps testing move faster.

    Successful DevOps implementation in large firms with legacy processes and technology is a challenge. A big culture change is the only way to achieve success in such firms. It will be a hybrid DevOps Model as purist implementation will be a challenge.


  • How to lower risk in agile development

    How to lower risk in agile development

    The increasing complexity of application development and subsequent rise of Agile development is changing the risk appetite in many software development organizations. Unless you’ve got an application which is highly regulated or mission-critical, it’s rarely feasible or sensible to manage Quality Assurance within the zero-bug environment often associated to Waterfall. Software development teams can become handcuffed by the lack of flexibility and struggle to maintain a focus on delivering business value. Agile methodologies paired with DevOps emphasize speed, rapid iteration and a “fix as you go” mentality over driving toward a perfect product out of the gates. So how can we lower risk in agile development?

    There are other contributing factors to the growth in software risk, notably the continuing adoption of cloud computing. Given the appealing economics and flexibility for updating and repairing code in the cloud, many teams will choose to host even the most high-risk data on the cloud. Conversely, teams must focus even more attention on security, as the cloud exposes more data outside of the company’s network.

    Software interdependencies are another risk; many business processes today rely upon the use of outside services from APIs to OAuth authentication. Teams must be on top of changes in these external systems to ensure that critical functionality can still operate. This is especially true in a mobile context, where even the operating system and hardware components are changing at a rapid pace.

    There doesn’t have to be a trade-off between speed and quality. It takes a change in mindset and processes, however: managing software risk in the age of Agile and cloud is a whole new game. Here are a few things to consider:

    1. Balance risk with business needs: A shining reason behind Agile’s popularity is the unceasing demand for speed and business alignment. Software and IT organizations have realized that in order for their employers to be competitive, they must operate in ways that are highly business-responsive and adaptive. Agile also helps organizations address the complexity of software development today, given the impact of mobile devices, the proliferation of new languages and tools for Web apps, growth in cloud-based computing and the overall importance of digital processes to a company’s success. QA teams need a more educated and informed approach to testing. That means taking on a measured approach to risk, wherein risk management tasks are implemented with business priorities in mind rather than as a one-size-fits-all strategy.
    1. Risk-based testing: In order to take on more risk as part of Agile and DevOps thinking, there must be proper checks and balances integrated within the testing process. Instead of testing every feature and function, and shifting timelines, prioritize testing and quality management measures to fit business priorities. Risk-based testing commonly assigns a risk rating score for individual tests, which gives developers and QA an idea of the level of risk involved in delivering the code covered by that test if the test is skipped. As a result, the product team might spend more time testing versions of the application for devices which comprise the most important or largest sector of the customer base. However, common device types and operating systems are not the only variables that can factor into risk scores. For example, if one particularly large customer relies on a key feature or function, that should mandate additional testing around that area of the application. By linking business drivers to development and testing, organizations can still deliver quickly yet with the assurance of superior results in the areas that matter most to revenues and customer satisfaction. Ongoing testing of high priority application features also results in the avoidance of costly, wholesale changes down the road.
    1. Integrate development and testing: As mentioned earlier, integration between development and testing is critical for many projects, yet it is frequently overlooked when managing Agile teams. To maximize success, there needs to be a deeper understanding between coders and testers on potential ripple effects of introducing new features as they are planned. This can occur during the everyday processes of Agile collaboration and sprint planning. Testers should know early on which are the top risk areas affected by a piece of new development; testers and developers both should incorporate development best practices which focus on understanding and planning for interdependencies, such as designing code that limits the downstream impact of integrations.
    1. Best of Breed tools: The market for tools has expanded vastly along with the onset of cloud, mobile, social and big data technologies and the DevOps and Agile movements. The average IT shop is using dozens of tools for application lifecycle management (ALM), build, automation, project management, change management and testing. The newer tools, designed for Agile and Web development, allow for rapid iteration yet still provide controls and collaboration features to minimize risk. Beyond functionality, look for tools that will integrate with your existing toolsets. This will allow for faster, real-time visibility on application deliverables, new features and any quality issues that have been discovered.

    Software development is more complicated today than ever. The good news is, it’s much less expensive, faster and easier to make a change in the code compared with even a few years ago. Incorporating some risk into a product is good, because it means that innovation and time-to-market are top of mind. However, introducing too much risk in high-priority customer areas or critical periods in a company’s growth can sink a business. Understanding the difference is what can allow you to keep both your customers and executives happy, with a brisk yet manageable pace of innovation.

    About the Author/Kevin Dunne

    kevinKevin Dunne is the Director of Product Strategy at QASymphony, ensuring their continued commitment to innovation and delivering tools to create better software. With a deep interest in the emerging trends in software development and testing, Kevin is dedicated to collaborating with thought leaders in this space.

    Kevin comes to QASymphony from Deloitte, where he managed testing on large government and Fortune 500 engagements delivering ERP implementations and custom software development. As one of the first employees at QASymphony, Kevin has seen many facets of the business working in sales, customer support, marketing, and product management.

    Kevin holds a Bachelor of Science degree from Vanderbilt University. Connect with Kevin on twitter.

  • How IT Operations Analytics is Delivering on the Promise of DevOps

    How IT Operations Analytics is Delivering on the Promise of DevOps

    DevOps is one of the most significant movements in IT of the past several years, and the same trends that are making DevOps so important – speed, automation, and iteration – are also opening up new opportunities for IT infrastructure management. DevOps, at heart, is a matter of adopting new philosophies of working as an IT team, while letting go of legacy processes and technologies that no longer deliver an adequate level of efficiency. DevOps is all about doing things in a more efficient, smart and cost-effective way by adopting the latest innovations, working across siloes to combine the strengths of different people on the team, and bringing different functions together to make a more responsive and effective DevOps organization.

    In the same way, today’s IT operations analytics solutions are becoming more friendly to this spirit of collaboration, as infrastructure is becoming more complex and heterogeneous. DevOps teams have to work together in new ways, with different processes and different parts of the organization interacting in unique ways that might not have been expected just a few years ago. Similarly, today’s IT operations analytics world is evolving to run IT more smartly by taking advantage of new opportunities to manage the stack more efficiently.

    Ultimately, the role of DevOps and the role of IT operations analytics are about developing competitive advantage. If your organization can use DevOps principles to build packages or release code faster or more accurately, you’re going to be ahead of the game compared to your competitors. If your organization can harness the power of the latest IT operations analytics innovations, you will similarly have a competitive edge because you will have a higher degree of control and visibility into what’s happening within your infrastructure. IT operations analytics can serve as an ideal complement to DevOps – because it helps to reinforce and protect the competitive advantage gains that are realized by DevOps.

    Here’s what I mean by that statement: DevOps does a great job of combining speed, automation, and iteration. But as a practical issue, creating competitive advantage is more than new features, the apps you deliver must be reliable and high performance or customer expectations will not be met. IT operations analytics serves as a complement to the speed and agility of DevOps by identifying new innovation opportunities and providing “wow!” moments for the customer. With better IT operations analytics, you can exert better control over your IT infrastructure – and better control leads to bigger innovation opportunities, because you can keep the control in-house without having to rely on an outsourcer for identifying your innovation opportunities.

    There are several market segments where the link between IT, the customer experience, and revenue are quite obvious. Optimizing online game play using real-time analytics is a great example, but the trend is much broader than that. With so much of the customer experience determined by IT systems, we are seeing more and more large customers moving to: (a) Continuous Integration and Continuous Delivery to accelerate delivery and (b) IT operations analytics as the way to ensure service delivery. IT operations analytics helps create the stable foundation for the high-speed and dynamic innovations of CI/CD.

    With DevOps opening up an unprecedented level of speed, it’s important to have the right tools in place to process significant volumes of data. This is another area where IT operations analytics serves as an ideal complement to DevOps – because today’s IT operations analytics tools are powered by Big Data and machine learning, making it possible to achieve new levels of scalability. Unlike just a few years ago when getting a Big Data system up and running required significantly more resources, companies can get a lot more Big Data bang for the buck today than was possible even 3 years ago.

    Now, companies are focusing on the analytic applications on top of Big Data, which is how businesses will find the optimization and innovation opportunities. Companies like Netflix are leading the charge in how Big Data can be used, not only to ensure service levels but also to create great customer experiences. While customer data may be the “crown jewel” of a corporation, IT operational data is the “diamond in the rough” that companies will be mining for the next big wins. We are just barely scratching the surface of what is possible with Big Data analytics of IT operational data – by drawing upon a fuller picture of what’s happening within the stack (various applications, servers, shared services, etc.), today’s IT operations analytics tools are going to help IT managers identify new insights and innovation opportunities that would not have been possible in the pre-DevOps era.

    Another lesson of today’s reality of DevOps and IT operations analytics is that the divide that used to exist between customers and IT is almost gone. The future of IT is represented by the Internet of Things (IoT), where every system and behavior is monitored and analyzed in real-time, triggering operational processes from turning off a light to delighting a customer. Everyday objects, from household appliances to cars, are going to get exponentially “smarter,” and our IT processes need to evolve along with them to continually analyze, evaluate and respond to the ever-shifting ocean of data that is silently speaking to us. While DevOps and CI/CD define the trend to more rapid innovation, the collection and analysis of the reams of data generated by systems and customers will be the key to finding and maintaining competitive advantage.

    This is where IT operations analytics will have an ever-more-important role as a complement to DevOps – with Big Data analytics and machine learning tools becoming more responsive and integrated into the life of overall IT operations, our IT admins are going to have more powerful insights at their fingertips each day. The convergence of IT operations analytics and DevOps will be a virtuous cycle of enhanced speed, smarter automation, and better control of IT operations for more reliable service and more delightful customer experiences.

    About the Author/Omer Trajman

    oWkhyC91_400x400Omer Trajman, Co-Founder and CEO of Rocana. Omer’s fifteen years of front-line business and technical experience guide his vision for Rocana. Leading teams responsible for some of today’s largest modern database management system deployments, Omer has worked with customers and partners to identify where Big Data technology solutions address business needs. Omer’s experience in Big Data includes responsibilities as Vice President of Technology Solutions at Cloudera, focusing on Cloudera’s technology strategy and communication. Prior to this role, Omer served as Vice President of Customer Solutions at Cloudera, which included responsibility for Cloudera University, Cloudera’s Architectural Services and Cloudera’s Partner Engineering team. Before joining Cloudera, Omer was responsible for the Cloud Computing, Hadoop and Virtualization initiatives at Vertica. Omer received his Bachelor’s degree in Computer Engineering from Tufts University and was a visiting scholar at Oxford University reading in Computation and Electrical Engineering with a focus on large scale distributed systems.

  • Rolling Updates with Rundeck

    Rolling Updates with Rundeck

    CAUTION: If you haven’t used Rundeck yet, clear your calendar for next Valentine’s Day because you’re about to fall in love… How many times have you written a shell script that runs via cron, or a PowerShell script that lives in the Windows Task Scheduler? How many times have you struggled to remember which server you built that script on? Let’s take it one step further: when was the last time that job ran successfully? Using rundeck makes you click-your-heels happy!
    I’ve used multiple solutions to address this problem in the past: jump boxes, dedicated scripting boxes, puppet manifests, the list goes on- but each left me feeling like I could have done something better. Recently, I discovered Rundeck and have been jump-in-the-air-click-my-heels-happy with it.
    What is Rundeck?
    Rundeck is a web application server that allows you to define jobs and tasks. It’s that simple. Where it excels is in its ability to automate those jobs, hand those jobs off to other people to run (without giving them access to the servers), call those jobs via API, monitor the progress and status of those jobs, and log all of the above for auditing purposes.
    Some common use cases I’ve personally used Rundeck for include:
    • deploying EC2 instances in AWS
    • creating scheduled jobs to run on remote servers
    • implementing blue/green deployments from a centralized location
    • rolling updates to ensure only one server is being updated at a time
    I’m sure that gets your mind going with all kinds of ideas, so let’s not waste any more time and get right to
    Setting up Rundeck
    Rundeck is a java web application and as such, requires your host system to have java installed. Java 1.7 is the minimum, and either Open JDK or Sun/Oracle Java will work just fine. If you have a system that supports RPM or Debian packages, installation can’t get any easier as both package formats are available and not only handle the installation process, but shell tools and init.d scripts for startup and shutdown as well. Users of other Operating Systems can use the Launcher for running the app, but installation details are left up to you. Finally, Rundeck can also install as a war file for use in an external container like Tomcat. With the server up and running, it’s time to:
    Build our first project:
    Rundeck_create_projectWhen getting started with Rundeck, I was expecting a lot more configuration prior to building a project. I actually struggled a bit when I couldn’t find out where to plug-in my AWS details at a system level. Turns out, you can’t because it’s configured on a project-by-project basis. This actually works out well, allowing you to isolate which jobs can be run against which servers, preventing mishaps such as running a script intended for your public-facing web servers on your finance servers!
    Creating a new project is done by clicking the big, green “New Project” button on the main screen. On the “Create New Project” screen, filling out the Project Name and Description details are pretty straight forward. The Resource Model Source is where things really start happening. In Rundeck, the Resource Model Source is how you specify the list of servers for the project. In its simplest form, Rundeck receives the list of nodes in XML or YAML format and can receive this data from a variety of sources ranging from hand-crafted files, CMDB, hosted virtual machine service, or a number of available plugins. More information about the Resource Model Source can be found in the Rundeck documentation here. If you are using AWS, the Rundeck EC2 Nodes Plugin allows you to specify nodes (a.k.a. ec2 instance) by tags. Installation is as easy as installing the plugin from the github repo into the $RDECK_BASE/libext directory (/var/lib/rundeck/ if you installed from rpm on RedHat based systems).
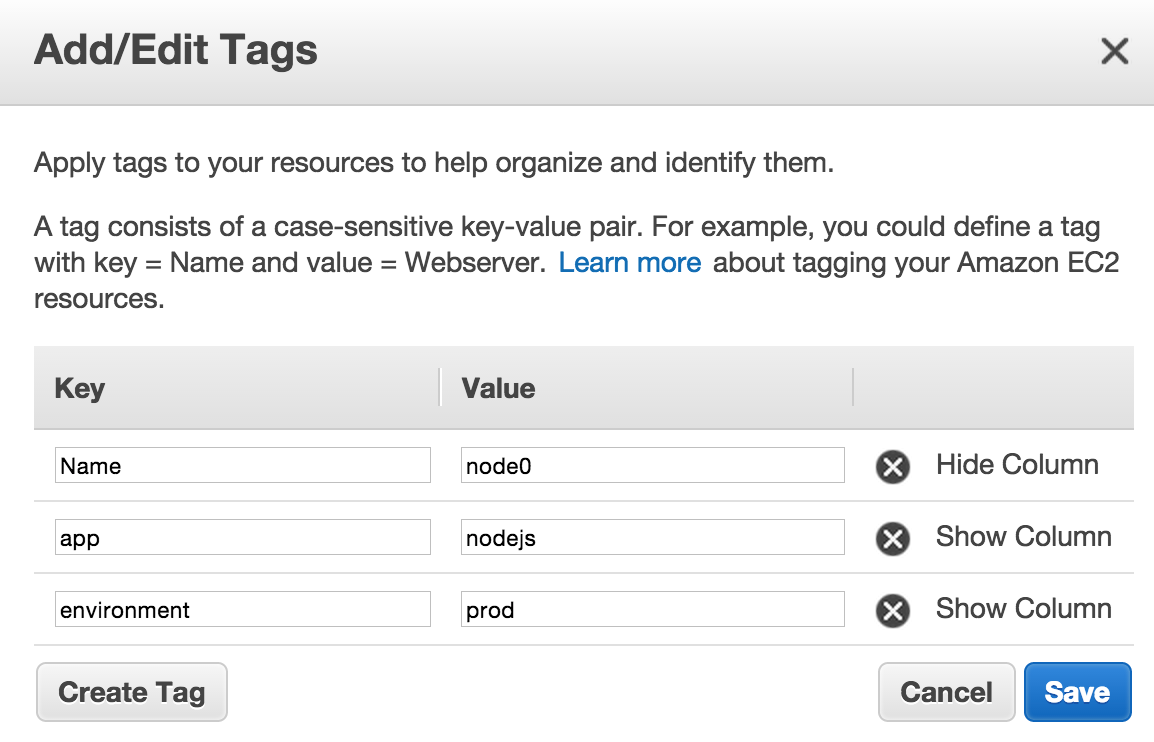
    You will want to create a new set of access keys for Rundeck. This will allow you to control what permissions Rundeck has in AWS via IAM policies, and make it easier to rotate keys as the keys will only be used in one place. Using the “Filter Params” textbox allows you to filter the AWS nodes to match your criteria. For example, I have all of my node.js servers tagged in AWS with a tag named “app” and the value set to “nodejs”.
    EC2_tagging
    Mapping Params is another area worth noting. Use this field to adjust the mapping of the values returned by AWS to the fields used in Rundeck. For example, this is a mapping I use:
    hostname.selector=privateIpAddress,privateDnsName;environment.selector=tags/environment;username.default=ec2-user
    First I have the hostname.selector field set to “privateIpAddress,privateDnsName”. This allows me to use either the IP address or DNS name of the instance when selecting nodes. It also uses the same data for displaying which nodes a given project will run on (much more insightful than seeing a list of instance IDs!).
    Next I have an “environment.selector” set to “tags/environment”. As you can see in the screenshot above, I use a tag named “environment” and set values to “prod”, “staging”, and “dev”. This allows me to further filter jobs by selecting the environment from a selector at runtime to determine which environment the job will run on.
    Finally, the username is set to “ec2-user”. This tells Rundeck who it should log in as when opening an ssh session to the node.
    If you are using ssh as the default node executor and file copier, you’ll need to upload keys with appropriate permissions as well. With all of that done (it seems like a lot- but it packs a lot of power in those steps, and it only needs to be done once for the project), it is finally time to:
    Create A Job:
    Creating a job is much simpler than configuring the project. Most of the options on this screen are pretty straightforward. I’ve had so much success with the “Script” step, I find it is my go-to favorite. It allows you to define a script and run it directly on the host. For example, I need to restart node.js on all my servers but don’t want to take them all down at the same time. To accomplish this, I would use a Bash script similar to the following:
    (A couple of notes here:
    – I’m using pm2 to manage the node process, so that is the application the script targets
    – My node.js servers have a /ping endpoint that returns OK when the server is up and running)
    # Shutdown the local node
    echo “Shutting down node.js on $(hostname)”
    /usr/bin/pm2 kill
    sleep 15
    # Start node.js
    echo “Starting node.js on $(hostname)”
    /usr/bin/pm2 start /etc/pm2/ecosystem.json
    sleep 30
    # Wait for the server to come online
    echo “Waiting for a positive response”
    while true; do
        STATUS=$(curl -s http://localhost:3000/ping)
        echo “$(date): $STATUS”
        if [ “$STATUS” = “OK” ]; then
            break
        fi
        sleep 10
    done
    echo “Done with $(hostname)”
    Boom. This script will now sequentially roll through all of my servers tagged “nodejs” in AWS, terminate the node process (via pm2), and wait for the server to come back online before moving to the next server. If the node doesn’t come back online, the Rundeck script for that node will not continue, preventing an unidentified error from taking all of my node.js servers offline! The key to this is ensuring that the Workflow Strategy is “Node-oriented”. This tells Rundeck to perform all steps on a given node before moving on, fully allowing the job to fail if something goes wrong. It’s also noteworthy to point out that Rundeck can email the results to you as well as logging all job executions. With our job in place and ready for action, it’s time to do what all DevOps people do best:
    Sit back and troll hacker news:
    hacker_news_logoSeriously. Rundeck can be an integral part of your DevOps toolkit. Using it for rolling updates, patching, and deployments are just the start. Imagine taking it a step further so that it integrates into your monitoring system and executes jobs as a result of alert conditions, or use it as a stand-in replacement for a complete DIY provisioning system for AWS OpsWorks. With a little work upfront, you may never have to minimize hacker news again!
  • Q & A: AppDynamics on commercial monitoring applications

    Q & A: AppDynamics on commercial monitoring applications

    AppDynamics hired Enterprise Management Associates (EMA) to produce a study about why the enterprise is plagued with numerous commercial monitoring applications that are not in use. According to AppDynamics, the enterprise is encumbered with disparate applications, resulting in vast challenges for IT teams including underperformance, monitoring gaps, and siloed tools—not to mention that many IT managers do not have time to address these application-based issues.

    AppDynamics emphasizes what it identifies as a finding that almost two-thirds of respondents report that it takes at least three hours to determine the root cause of an application performance issue. AppDynamics concludes that very few IT organizations have an accurate, comprehensive view of today’s complex applications environment, business transactions, and dependencies.

    devopsy.kinsta.cloud spoke with AppDynamics’ VP of Product Marketing, Kalyan Ramanathan about this study.

    devopsy.kinsta.cloud: How did you select and reach study participants?

    Kalyan Ramanathan: We worked with the analysts from Enterprise Management Associates (EMA) to do this survey and study. They have a standard database of people who they always work with, who they interact with. EMA did the heavy lifting, surveying the audience for the study. We did, however, put criteria in place in order to make sure that the survey is relevant.

    We made sure that the survey targeted enterprises of all sizes. So as you may have read, 80-percent of the surveyed respondents had more than a thousand employees, which is about the size where companies start to have some mission-critical applications that might affect a substantial number of either internal employees or consumers when they don’t work well.

    We also wanted a smattering of fairly large customers, or I should say enterprises, only because the challenges that people at that spectrum have are very different from let’s say an enterprise with a thousand employees. So 25-percent of the surveyed respondents had more than 10K employees.

    The other thing that we did as a part of the survey was to focus on the personas that we are talking to, so that again we get good representation across the board. So we had everybody from practitioners to managers to IT execs in this survey because the interesting thing that we found out is that there are some questions where we see a fairly wide discrepancy between these personas.

    DevOps: You say that the survey shows that respondents need flexible deployment options. Did respondents say why in particular they needed flexible deployment options?

    Kalyan Ramanathan: Absolutely, and I think you’re specifically referring to the fact that the solution can be available on premise or in the cloud, and just about every enterprise that we talked to believes that this is a key requirement and it has become a key differentiator for AppDynamics in the market. Many of the companies that we talked to are, I would say, Fortune 1,000 to Fortune 2,000 companies, and in these companies not all their assets are in the cloud today, not all their applications are in the cloud today, and they also deal with a lot of sensitive data.

    So today many of them may choose to work with our on-premise solution, but at the same time I think the writing’s on the wall. I think none of us can question the fact that the cloud is indeed gaining acceptance and that some or many of these applications will indeed go to the cloud at some point. So having that option, having the flexibility that one day my applications will go to the cloud and therefore I could use a cloud-based monitoring solution, without doing a forklift upgrade or replacement of everything that I have, is indeed a good flexibility to have and that’s essentially what our customers see in the AppDynamics product.

    Final Thoughts

    Consider this exchange, dear reader, as enlightenment into what went into this study or as a backdrop for your examination of the published survey results from AppDynamics if you care to read them. You can get the full study here.

  • 28 DevOps and Continuous Delivery Reference Architectures (Vol. 2)

    28 DevOps and Continuous Delivery Reference Architectures (Vol. 2)

    People want to get going with DevOps or Continuous Delivery, but need a place to start.  Others are already on their way, but need some validation of their choices.  In April, I published the first volume of DevOps and Continuous Delivery reference architectures which has now been viewed over 37,000 times on SlideShare (it’s free to download…no registration required).  Three things helped people in the deck: (1) the reference architectures, (2) links to the sources for each architecture attached to each slide, and (3) no marketing fluff.

    [slideshare id=45996806&doc=nexusandcontinuousdelivery-150318110625-conversion-gate01]

    I am honored to have helped so many people on their DevOps and Continuous Delivery journeys.  So this month, I compiled Volume 2 of the reference architectures.  You can now view the deck on SlideShare, download it (again…no registration required), and share it with others.  Have a look and let me know what you think.

    As I did with Volume 1, if you have a reference architecture that you would like to share, I would be happy to add it into Volume 2 with full attribution to you.  Just ping me in the comments section or reach out to me @weekstweets.

    Here is Volume 2:

    [slideshare id=50972100&doc=devopscontinuousdeliveryreferencearchitecturespart2-150727141843-lva1-app6891]

  • 9 Open Source DevOps Tools We Love

    9 Open Source DevOps Tools We Love

    While we have been building our SaaS company, we have been investing much time in researching and deciding which tools to include in our DevOps toolkit. We’ve based these decisions on our years of experience in the IT industry, dealing with infrastructure for the most part. From building a petabyte-scale, data analytics infrastructure, our architecture, tools, and processes have become key components of our technology and operations. We’ve taken great care in selecting, benchmarking and constantly improving our tool selection.

    As a company that is building a solution on top of an open-source stack (ELK), our team is heavily involved in the open source community, contributing to multiple projects such as Camel and Kafka while customizing tools to fit our needs. The vast majority of tools we use internally are open-source ones. By sharing the toolset that we’ve collected and honed over time, we hope to foster a discussion within the DevOps community on what further improvements can be made.

    With that, we welcome you to enjoy browsing through the following list that we’ve created. Some tools you may have known about for years, while others may be new. Of course, we invite any and all feedback, especially from those of you who are using alternatives!

    Must-Have DevOps Tools

    1. Nagios (& Icinga) 

    nagiosInfrastructure monitoring is a field that has so many solutions… from Zabbix to Nagios to dozens of other open-source tools. Despite the fact that there are now much newer kids on the block, Nagios is a veteran monitoring solution that is highly effective because of the large community of contributors who create plugins for the tool. Nagios does not include all the abilities that we had wanted around the automatic discovery of new instances and services, so we had to work around these issues with the community’s plugins. Fortunately, it wasn’t too hard, and Nagios works great.

    We also looked into Icinga, which was originally created as a fork of Nagios. Its creators aim to take Nagois to the next level with new features and a modern user experience. There is a debate within the open source community about the merits of Nagios and its stepchild, but for now we are continuing to use Nagios and are satisfied with its scale and performance. The switch to newer technology, such as Icinga, may be appropriate in the future as we progress.

    2. Monit

    monitSometimes the simplest tools are the most useful, as proven by the simple watchdog Monit. Its role is to ensure that any given process on a machine is up and running appropriately. For example, a failure occurs in Apache, Monit will help to restart the Apache process. It is very easy to setup and configure and is especially useful for multi-service architecture with hundreds of micro-services. If you are using Monit, make sure to monitor the restarts that it executes in order to surface problems and implement solutions (rather than just restarting and ignoring the failure). You can do this by monitoring Monit’s log files and ensuring that you are alerted to every restart.

    3. ELK – Elasticsearch, Logstash, Kibana – via Logz.io

    logz.ioThe ELK Stack is the most common log analytics solution in the modern IT world. It collects logs from all services, applications, networks, tools, servers, and more in an environment into a single, centralized location for processing and analysis. We use it for analytical purposes (e.g., to troubleshoot problems, monitor services, and reduce the time it takes to solve operational issues). Another use for this tool is for security and auditing (e.g., to monitor changes in security groups and changes in permissions). After receiving alerts on these issues, it is easy to act on unauthorized users and activities. We also use ELK for business intelligence, such as monitoring our users and their behavior. You can set up your own ELK or buy it as-a-service. We’ve written a guide for the community on using ELK to monitor your application performance.

    Disclaimer: Logz.io is our ELK-as-a-service that we use in our own environment. You can say that we eat our own dog food.

    4. Consul.io

    consulConsul is a great fit for service discovery and configuration in modern, elastic applications that are built from microservices. The open-source tool makes use of the latest technology in providing internal DNS names for services. It acts as a kind of broker to help you sign and register names, enabling you to access service names instead of specific machines. If, for example, you have a cluster of multiple machines, you can simply register them as a single entity under Consul and access the cluster easily. We praise this tool for its efficiency, although we still feel there is more that can be done with it. If you also use it, it would be great to hear about your own use case.

    5. Jenkins

    jenkinsEveryone knows Jenkins, right? It’s not the fastest or the fanciest, but it’s really easy to start to use and it has a great ecosystem of plugins and add-ons. It is also optimized for easy customization. We have configured Jenkins to build code, create Docker containers (see the next item), run tons of tests, and push to staging/production. It’s a great tool, but there are some issues regarding scaling and performance (which isn’t so unusual). We’ve explored other cool solutions such as Travis and CircleCI, which are both hosted solutions that don’t require any maintenance on our side. For now, however, since we’ve already invested in Jenkins, we’ll continue with it.

    6. Docker

    dockerEverything that can be said about how Docker is transforming IT environments has already been said. It’s great…life changing, even — (although we’re still experiencing some challenges with it). We use Docker in production for most services. It eases configuration management, control issues, and scaling by allowing containers to be moved from one place to another.

    We have developed our SaaS solution with a twelve-layer pipeline of data processing. Together with Jenkins and Docker, we have been able to run a full pipeline across all layers on a single Mac. It would be wrong to say that there aren’t any complications with Docker, as even small containers can take a significant amount of time to build. However, we want to ensure that our developers are as satisfied as possible and enable them to work rapidly. With all of the management involved in storage, security, networking — and everything surrounding containers — this can be a challenge.

    We see Docker progressing and look forward to welcoming the company’s new management and orchestration solutions. For those who might be having issues with Docker, we’ve also compiled a list of challenges and solutions when migrating to Docker.

    7. Ansible

    ansibleAgain, simplicity is key. Ansible is a configuration management tool that is similar to Puppet and Chef.  Personally, we found those two to have more overhead and complexity to our use case– so we decided to go with Ansible instead. We know that Puppet and Chef probably have a richer feature set, but simplicity was our desired KPI here. We see some tradeoffs between configuration management using Ansible and the option to simply kill and spin new application instances using a Docker container. With Docker, we almost never upgrade machines but opt to spin new machines instead, which reduces the need to upgrade our EC2 cloud instances. Ansible is used mostly for deployment configuration mostly. We use it to push changes and re-configure newly-deployed machines. In addition, its ecosystem is great, with an easy option to write custom applications.

    8. Collectd/Collectl

    Collectd/l are nifty little tools that gather and store statistics about the system on which they run and are much more flexible than other tools. They allow users to measure the values of multiple system metrics and unlike other log collection tools that are designed to measure specific system parameters, Collectd/l can monitor different parameters in parallel. We use these two tools to measure customer performance parameters and ship them to our ELK-as-a-Service platform. We’ve specifically wrapped a Collectl agent in a Docker container and push it with Ansible to all of our servers. It collects information every couple of seconds and then ships it to ELK to allow us to run reports and send alerts. If you’d like to see a specific example of how we do this process in our environment and how others can do the same, we’ve created a guide for everyone.

    9. Git (GitHub)

    githubGit was created 10 years ago following the Linux community’s need for SCM (Source Control Management) software that could support distributed systems. Git is probably the most common source management tool available today. After running Git internally for a short period of time, we realized that we were better suited with GitHub. In addition to its great forking and pull request features, GitHub also has plugins that can connect with Jenkins to facilitate integration and deployment. I assume that mentioning Git to modern IT teams is not breaking news, but I decided to add to it to the list due to its great value to us.

    Other picks?

    The modern DevOps world is full of outstanding and unique open source tools—it’s a jungle out there. We found the tools listed here to be the best in breed and think they should be included in every DevOps engineer’s shortlist.

    Or am I wrong? What open source DevOps tools are in your toolkit? I’d love to hear your own recommendations and experiences in the comments below.