Category: DevOps and Open Technologies

Editorial Calendar for February 2016

  • Google’s Shiny New AI Dev Environment — the ‘Experimental’ Project IDX

    Google’s Shiny New AI Dev Environment — the ‘Experimental’ Project IDX

    Welcome to The Long View—where we peruse the news of the week and strip it to the essentials. Let’s work out what really matters.

    This week: Google’s full-stack, browser based development environment in the cloud. It’s not just a Copilot clone, but aims to help you “get an app from zero to production.” (more…)

  • 2024—Year of the Linux Desktop? ChromeOS Reflects its Inner Penguin ¦ GNOME Rethink

    2024—Year of the Linux Desktop? ChromeOS Reflects its Inner Penguin ¦ GNOME Rethink

    Welcome to The Long View—where we peruse the news of the week and strip it to the essentials. Let’s work out what really matters.

    This week: Can the Linux desktop installed base ever break the mythical 10% barrier? Google has been refactoring ChromeOS, and GNOME is working on new window manager ideas. (more…)

  • Overture Maps’ Challenge to Google ¦ Frontier Model Forum’s AI Safety Shtick

    Overture Maps’ Challenge to Google ¦ Frontier Model Forum’s AI Safety Shtick

    Welcome to The Long View—where we peruse the news of the week and strip it to the essentials. Let’s work out what really matters.

    This week: A big-tech consortium goes toe-to-toe with Google Maps, and a big-tech consortium tries to fool AI regulators. (more…)

  • Using Generative AI for Issue Remediation and Software Reliability

    Using Generative AI for Issue Remediation and Software Reliability

    In today’s fast-paced digital landscape, keeping your services up and performant, especially for cloud-based and online services, is crucial for staying competitive. Downtime or latency issues can drive customers away, especially when all it takes is a click to switch over to a competing SaaS solution. DevOps and site reliability engineering (SRE) teams face the constant challenge of minimizing mean-time-to-remediation (MTTR) when dealing with errors and issues. As valuable as search engines like Google are, the sheer amount of information available can make finding the right solutions a time-consuming task. What if there was a way to automate and streamline this process, making error investigation more intelligent, focused and efficient?

    This article will walk you through the journey of error resolution from the first obscure log line to identifying the problem hidden within it. We’ll resolve the issue using several tactics, ultimately leading to the use of generative AI to cut MTTR and provide precise IT recommendations. This journey includes useful measures and principles that can be applied by DevOps teams and explores the potential for applying generative AI.

    The Current Experience of DevOps/SRE

    Picture this: A log line pops up with an obscure error message, and the first instinct is to search for this message on Google for potential solutions. After all, someone else must have encountered a similar problem, right? However, the abundance of resources and search results can be overwhelming. The search results are often displayed based on website relevance, not necessarily the relevance of the error itself. Consequently, precious time is wasted sifting through countless search results, leading to a longer time to understand and remediate the error. For DevOps and SRE teams responsible for maintaining system stability, reducing MTTR is a crucial key performance indicator (KPI). This begs the question: How can we leverage automation and artificial intelligence to improve the search process and accelerate error resolution?

    Our First Step: Cognitive Insights

    In our organization’s initial attempt to tackle this challenge, we focused on leveraging crowdsourcing techniques to get more relevant results than the brute-force Google search. Moreover, we wanted to automate the process and run it offline so that when an incident occurs, we can offer useful insights rather than starting the search as the system is down or malfunctioning.

    The approach involves an offline phase and an online phase. The offline phase involved analyzing all our ingested logs and identifying common log patterns. This also allowed us to count how often this pattern occurred in our system and how prevalent it is. Then we crawled relevant technology forums like StackOverflow, Google Groups and Bing Groups for relevant discourse around these log patterns that could offer relevant solutions. The next step was to rank the search results by relevance and take the top five most relevant links.

    The offline phase resulted in a library of known log patterns and, for each one, a cognitive insight containing these links, as well as additional information such as the severity level, how many times this pattern occurred in the logs, the date of first occurrence and additional tags of involved technologies, tools and domains.

    The online phase occurs in real-time as new logs come in. Upon ingesting the log, it is automatically matched against all known patterns; if it matches one, it gets the cognitive insight for that pattern. This means that as soon as the problematic log comes in, the DevOps engineer already has focused and ranked search results and context to start from, which accelerates the investigation process.

    The Next Step: Why Don’t we ask Generative AI?

    After reflecting on our initial approach, we had an epiphany. Large language models (LLMs) like ChatGPT had already crawled the web and absorbed a vast amount of information. So, why not leverage their capabilities and ask them directly for insights? The idea was simple: Let the AI “read the posts” for us and provide us with recommendations. We started by formulating specific questions such as “What could the possible errors be?” and even went a step further by asking for further investigation steps. However, implementing this seemingly straightforward approach came with its own set of challenges. We needed to run preprocessing before asking the generative AI, as well as running post-processing on the answers it returned, to get what we expected. Let’s see what that process entails.

    How we Did It: Analyzing, Sanitizing and Validating

    Before asking ChatGPT (or any other generative AI tool) for assistance, several preparatory steps were necessary. First, we had to analyze incoming logs, identify patterns and score them based on severity. This allowed us to prioritize the most critical issues.

    Secondly, we had to carefully design our prompts for the generative AI using prompt engineering, ensuring that we framed our questions in a way that yielded precise and relevant responses. Prompt engineering is the practice of strategically designing effective prompts or instructions for language models to achieve more accurate responses. It involves carefully specifying the input format, context or constraints to guide the model’s generation process and obtain more accurate and desired results. This is true for any use of generative AI, and for our case in particular. Beyond accuracy, prompt engineering helped us tune the requested format and length of the answer to fit the “executive summary” paragraph we popped up for the user. This ensured it wasn’t too lengthy nor too short to provide meaningful insights.

    Additionally, we took great care in sanitizing the queries and removing any sensitive data to maintain privacy and security. This step was especially crucial for those working with public services, highlighting the importance of protecting users’ personally identifiable information (PII), such as names, emails, phone numbers, IP addresses or GPS coordinates.

    With all this preprocessing done, we sent the prompt to the generative AI. It is important to note that public services may not always be available (as some returned a “service is busy” message when working with ChatGPT and other services), so automation should take care of delays and employ retries as needed.

    Finally, as responses were received from the AI, it was essential to validate those. We ran an analysis and filtered out non-relevant answers from different domains (after all, a log is also a product of a tree, and Kafka is also a novelist), ensuring there was no offensive content or misleading information. The semantic integrity of the responses was also carefully evaluated.

    These AI insights have proven to be a powerful troubleshooting tool, and we’ve made it an integral part of our service.

    This journey is not unique. In fact, DevOps teams can employ similar measures for their own telemetry data to serve their own operational workflows. These principles, such as data sanitization and validation, even apply to other types of data and use cases.

  • Five Great DevOps Job Opportunities

    Five Great DevOps Job Opportunities

    devopsy.kinsta.cloud is now providing a weekly DevOps jobs report through which opportunities for DevOps professionals will be highlighted to better serve our audience.

    Our goal in these challenging economic times is to make it easier for DevOps professionals to advance their careers.

    Of course, the pool of available DevOps talent is still relatively constrained, so when one DevOps professional takes on a new role it tends to create an opportunity for others.

    The five job postings shared this week are selected based on the company looking to hire, the vertical industry segment and, naturally, the pay scale being offered.

    We’re also committed to providing additional insights into the state of the DevOps job market. In the meantime, for your consideration:

    Indeed.com

    SAP
    San Francisco, California
    DevOps Engineer
    $141,378 to $162,000

    CareeerBuilder.com

    Citigroup
    Tampa, Florida
    DevOps Lead Engineer
    $110,090 to $165,130

    Dice.com

    Cognizant Technology Solutions
    Seattle, Washington
    xStore DevOps Lead
    $114,365 to $127,538

    LinkedIn

    J.Crew
    New York, New York
    Lead DevOps Engineer
    $108,800 to $136,000

    SimplyHired.com

    Hearst Media Services
    New York, New York
    DevOps Engineer
    $98,900 to $125,000

  • Syslogs in Linux: Understanding Facilities and Levels

    Syslogs in Linux: Understanding Facilities and Levels

    Recently, I found myself in the position of investigating the root cause of a booting failure in an embedded device. To diagnose the problem effectively, I relied on syslogs, which proved to be invaluable. Syslogs, or system logs, are a crucial element of Linux systems, as they capture and retain important data about different events and actions. In this article, we will emphasize the importance of syslogs in Linux and examine the various facilities and levels utilized to classify and prioritize log messages.

    Understanding Facilities

    Facilities in syslogs are used to categorize log messages based on their sources or purposes. They provide a way to differentiate between various components of a Linux system.

    Photo from RFC5424

    Understanding Levels

    Syslog levels indicate the severity or importance of log messages. They help prioritize and filter log entries based on their significance.

    Photo from RFC5424

    An Example

    For easier debugging, you can clear out the syslog before running the user application for investigation and to get fewer lines of logs. To clear out the syslogs, you can either truncate or delete them.

    Remember that clearing syslogs removes log history, so ensure you don’t require the information for troubleshooting, analysis, or compliance purposes before clearing the logs. Additionally, clearing logs may require administrative privileges, so you may need to use the command or run the commands as the root user.

    After clearing the syslog, remember to restart the rsyslog. Otherwise, your application won’t be able to log your user-level messages. Below is an example in Ubuntu on how to truncate, remove and restart the service.

    This is a simple C++ code that generates a log message for the facility user that indicates an informational message.

    In this example, we include the <syslog.h> header file, which provides the necessary functions and constants for syslog logging. The <openlog() function is used to open a connection to the syslog service, specifying a custom identifier (“SyslogSampleApp”) for our application, the logging options (LOG_PID to include process ID), and the facility (LOG_USER for user-level messages).

    We then use the syslog() function to generate log messages of different levels. In this case, we create a user-level message using LOG_INFO. You can adjust the log levels based on your specific needs.

    Finally, we close the syslog connection closelog() to release any resources associated with the syslog service.

    Viewing your syslog depends on the Linux distribution that you’re using. /var/log/syslog is used for Debian and Ubuntu while /var/log/messages is used for Red Hat and CentOS.

    Conclusion

    Syslogs are an integral aspect of Linux systems, serving as a foundation for efficient monitoring, troubleshooting and analysis. They play a crucial role in capturing and organizing log messages across various facilities and levels. This categorization allows for valuable insights into system behavior, promotes effective issue resolution, and contributes to the overall maintenance of system health and security. It is essential to utilize the appropriate log level, such as LOG_INFO, to ensure that the syslog remains uncluttered and focused on the relevant scenario, avoiding the unnecessary inclusion of LOG_ERR entries.

  • Splunk Goes Azure With Microsoft Partnership

    Splunk Goes Azure With Microsoft Partnership

    It’s not every day that a well-established technology provider announces they are building their solutions on a new cloud technology stack, but that’s what Splunk announced at its .conf23.

    “…[O]ne of the most exciting [announcements] is Splunk’s new strategic partnership with Microsoft to build Splunk’s cloud solutions natively on Microsoft Azure. Together, our approach will enable our joint customers to migrate, modernize and grow their environments with end-to-end cloud and hybrid visibility at scale,” Splunk President and CEO Gary Steele said in a Splunk blog post this morning.

    Why such a bold move, might you ask? “Splunk’s strategic partnership with Microsoft to build Splunk natively on Azure demonstrates our commitment to advancing digital resilience and meeting our customers where they are…” Well, indeed, a big, big draw is the vast landscape of customers building and operating applications in Azure. While Gary didn’t share too many details about specific new capabilities or offerings yet, customers will get to use their Azure credits for Splunk offerings. I suspect two other important underlying factors made such a tech marriage happen: Open source and AI.

    First, Microsoft is far removed from the days of being viewed as a pariah by the open source community and is now a leader and contributor to well-known open source projects (OpenTelemetry, to name one); it abandoned its proprietary service mesh tech and got behind Istio (a recently-graduated CNCF project) and now owns the largest open source repository ecosystem with GitHub.

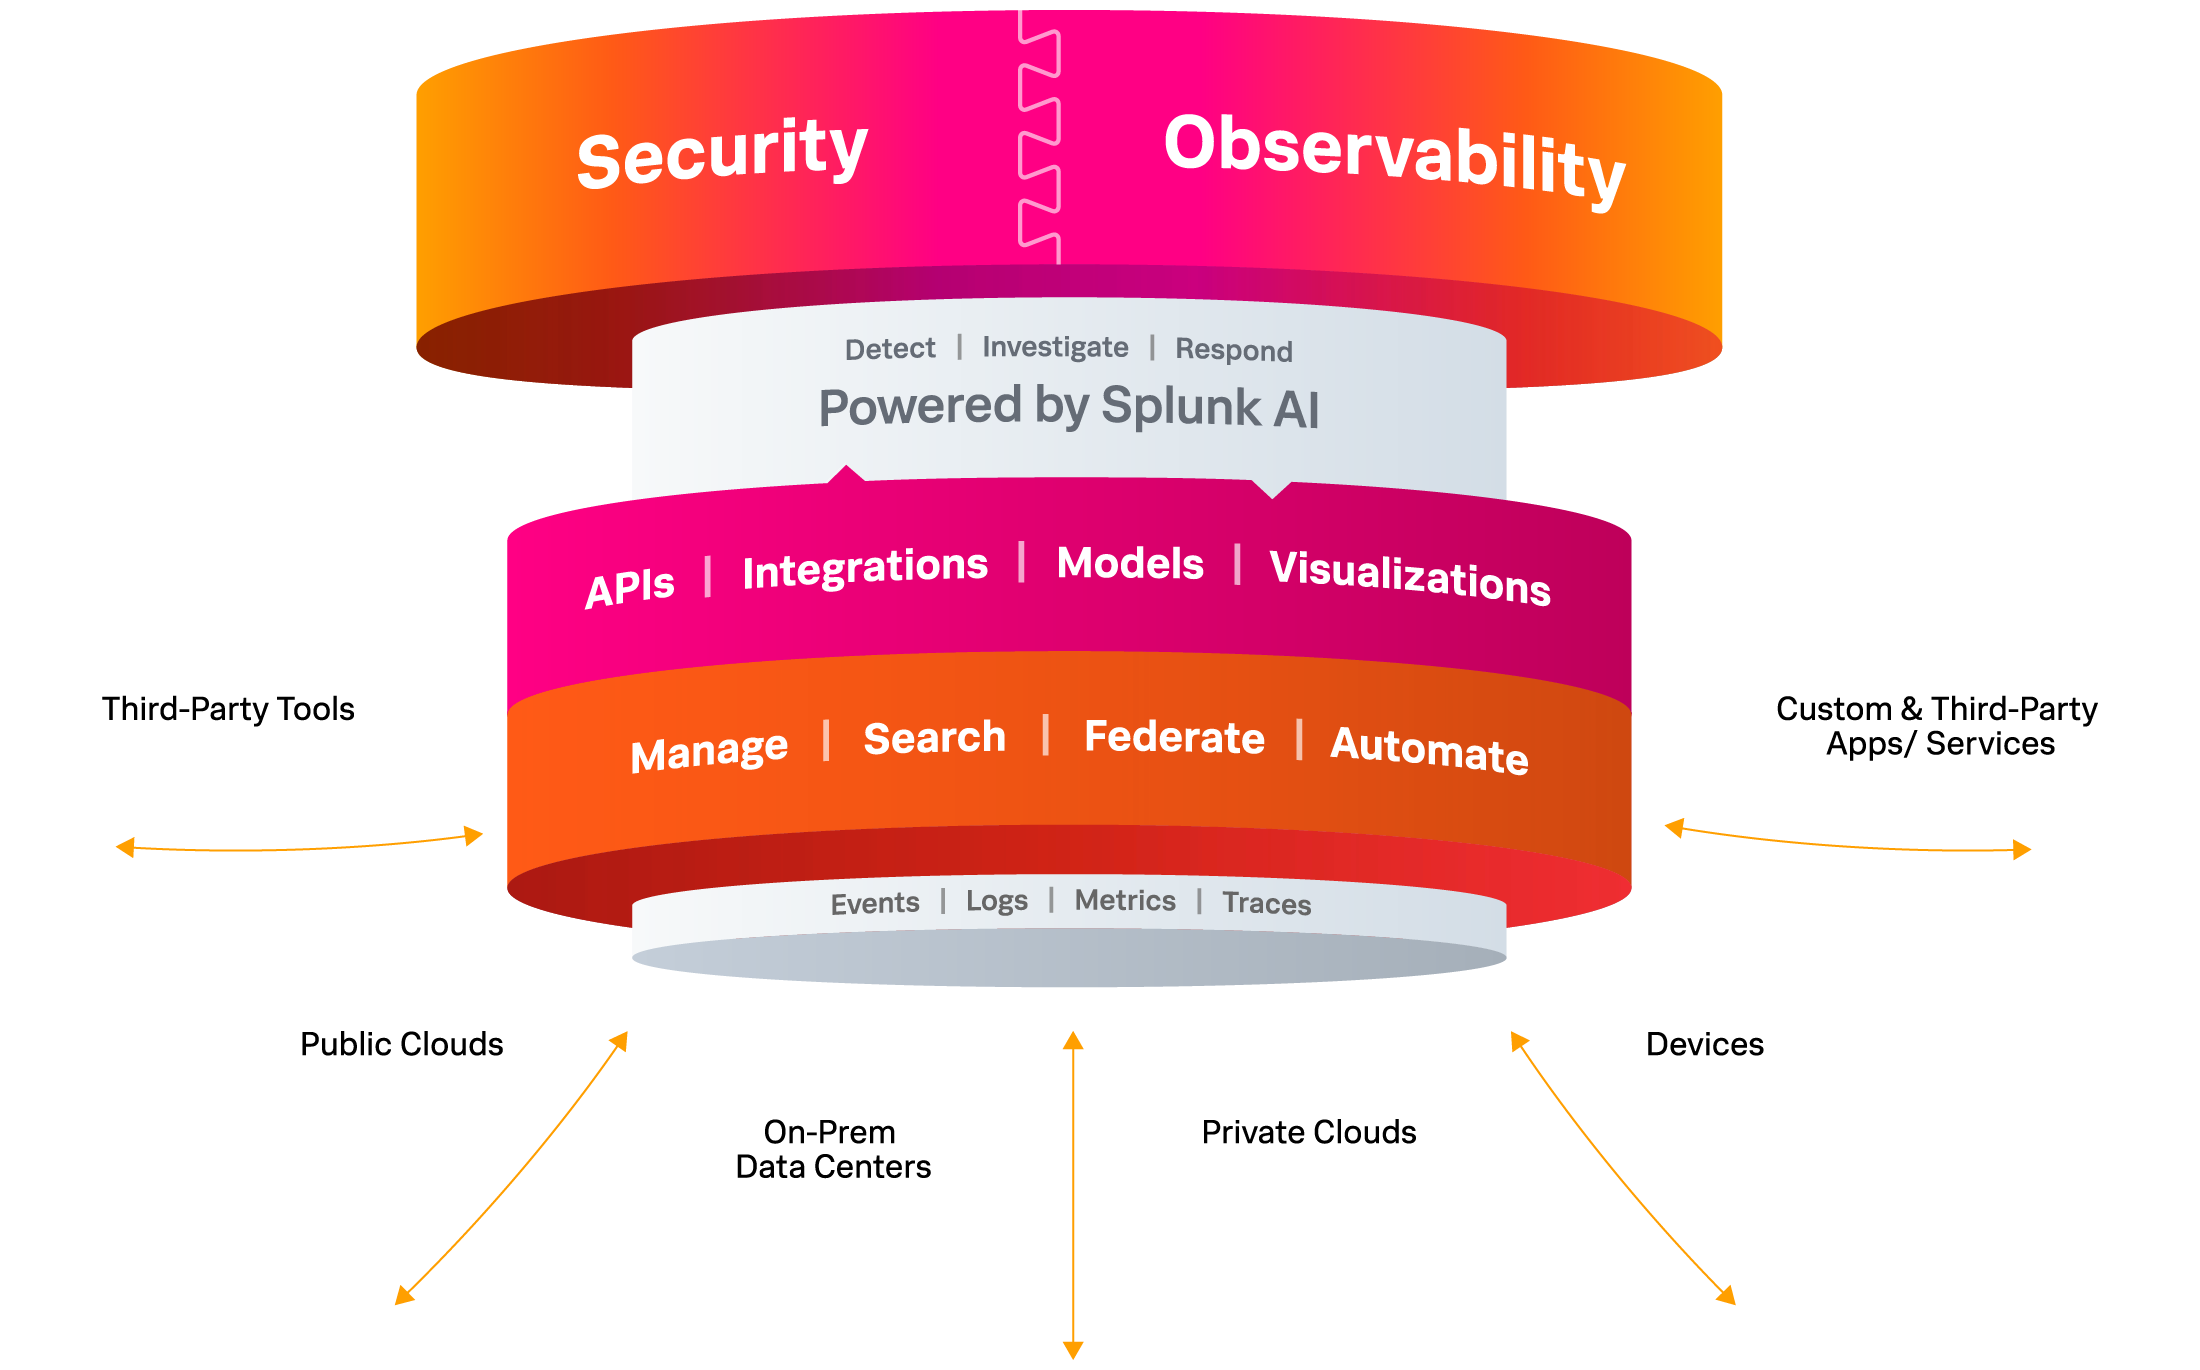
    While Splunk is by no means a noob when it comes to incorporating AI into products, the company continues to announce new AI capabilities, including a generative AI chat interface with a preview of Splunk AI Assistant, an improved version of the former SPL Copilot. Other AI-related announcements include Splunk App for Data Science and Deep Learning (DSDL) 5.1, which allows customers to leverage LLMs to build and train models with their domain-specific data for text summarization and text classification use cases. Stay tuned for more from .conf 2023!

  • Splunk Adds Generative AI Tool and OpenTelemetry Collector

    Splunk Adds Generative AI Tool and OpenTelemetry Collector

    At its .conf23 conference, Splunk today revealed it added a slew of capabilities to its portfolio of operational analytics tools, including an assistant that leverages generative artificial intelligence (AI) capabilities that use large language models (LLMs) the company developed to enable IT teams to use natural language to invoke the Splunk Processing Language (SPL).

    In addition, Splunk is also previewing OpenTelemetry Collector, an add-on that uses open source agent software being developed by the Cloud Native Computing Foundation (CNCF) to capture metrics and traces. It is designed to enable IT teams to use OpenTelemetry alongside existing agent software that Splunk uses to capture metrics.

    Tom Casey, senior vice president for products and technology at Splunk, said the domain-specific LLMs that the company created enable Splunk Assistant to write or explain customized SPL queries in a way that augments rather than replaces the need for IT professionals. Splunk Assistant is designed to surface recommendations to optimize IT environments to reduce toil rather than automate entire processes, he noted.

    Splunk is adding other tools infused with machine learning algorithms to its portfolio. These include the Splunk App for Anomaly Detection and an Outlier Exclusion for Adaptive Thresholding to detect and omit abnormal data points that has been added to version 4.17 of the Splunk IT Service Intelligence platform.

    In addition, Splunk is previewing an ML-Assisted Thresholding tool for Splunk IT Service that uses historical data and patterns to create dynamic thresholds with a single click.

    The company is making available a 5.4 update to the Splunk Machine Learning Toolkit (MLTK) 5.4 and a Splunk App for Data Science and Deep Learning (DSDL) 5.1 toolkit that provides access to additional data science tools that can extend MLTK to enable organizations to build their own custom LLMs and AI assistants.

    Finally, Splunk added Unified Identity to make it simpler to access Splunk Cloud Platform and Splunk Observability Cloud along with an update to Splunk Cloud Platform and Splunk Enterprise that make it simpler to ingest, route, search and export data.

    It’s still early days as far as the application of generative AI is concerned, but it’s already clear that the way IT is managed is about to be transformed. Coupled with tools such as OpenTelemetry that make it less expensive to collect massive amounts of data, the opportunity to train LLMs that streamline a wide range of processes is immense. Those capabilities won’t replace the need for humans to manage those processes, but they will most certainly cause staff realignments as many manual tasks become increasingly automated.

    In fact, it’s hard to imagine an IT team that would not want to take advantage of AI capabilities to simplify the management of complex IT environments that now function at a level of scale that few IT professionals can successfully manage on their own. One way or another, AI is going to be broadly applied to IT workflows. The only thing left to be seen now is the ultimate impact.

  • The Cyber Resilience Act Threatens the Future of Open Source

    The Cyber Resilience Act Threatens the Future of Open Source

    The European Union (EU) is currently considering approval of the Cyber Resilience Act (CRA), a proposed regulation that is a major threat to the future of the global open source industry. While the intention of the act is to enhance cybersecurity (which is extremely welcome), its current form lacks clear liability exemptions for many open source developers and maintainers, which could be a death knell for open source in the EU and which could spark additional, global implications.

    The CRA regulation for the EU was proposed on September 15, 2022, by the European Commission. The intent is to improve cybersecurity and cyberresilience in the EU through common cybersecurity standards for products with digital elements. In theory, this is welcome. But there are some notable areas that many open source developers and industry organizations are concerned about.

    Modern applications are comprised of 90% open source code; penalizing open source developers would lead to a fragmented community and hinder important projects across various sectors, including critical infrastructure, health care and even military systems.

    The seemingly purposeful omission of exemptions for open source would put undue onus on open source foundations and maintainers and poses a serious risk to not just EU innovation and security but global collaboration. Something we, and many others in the industry, have tried to raise awareness about over the past six months. Unfortunately, the EU has largely ignored the industry’s voice. Holding open source developers whose components end up in commercial products liable for security issues will stifle innovation and harm the EU economy without providing a substantive improvement in security.

    This legislation is slated for a vote on July 19 in the parliament’s Industry, Research and Energy (ITRE) committee, where it will then be sent on to the full parliament. And, if nothing is done, it could be adopted without even a vote in a plenary session by the Parliament itself. I feel strongly that if the open source industry doesn’t take a stand now, it will become law and the open source community as we know it will be no more.   

    There are two main problems with the proposed CRA: It discourages commercial support of open source and imperils vulnerability disclosure.

    CRA Discourages Commercial Support of Open Source

    The revised CRA offers new cybersecurity requirements for hardware and software products, much like the U.S.’s National Cybersecurity Strategy does. It calls for software vendors and producers to understand what components are in their software and to be able to recall software that is affected by a vulnerability. But, unlike the recently released details for the U.S. strategy, it seems to be trying to call out certain open source projects from foundations and large companies. By doing so, it potentially impacts every open source project, which creates a web of issues.

    It goes without saying that open source projects rely heavily on volunteers, individual contributors and small teams who often work without significant resources or financial support. The support that foundations and contributors do get often comes from commercial entities who have adequate resources to provide developer time to give back to the community.

    The current CRA text only excludes OSS software that has no commercial activity around it. Unfortunately, it defines commercial activity in part, this way:

    “where the main contributors to free and open-source projects are developers employed by commercial entities and when such developers or the employer can exercise control as to which modifications are accepted in the code base, the project should generally be considered to be of a commercial nature.”

    This can be read to mean that if the main contributors are not unemployed, then the project is commercially tainted. It does not clarify what was probably intended—that the employer fully controls the project here.

    Additionally, it says:

    “Accepting donations without the intention of making a profit should not count as a commercial activity, unless such donations are made by commercial entities and are recurring in nature.”

    The first part is acceptable, but recurring donations from commercial entities are the upside of contributing back to open source. This may force the projects to reject large contributions to avoid becoming “tainted,” and will likely cause commercial entities to enact further bans on OSS contributions and pull their support entirely.

    Further, if the CRA is passed without proper exemptions, these developers and maintainers may face legal risks and liabilities for vulnerabilities found in code used in commercial products. The OSS developers have no visibility into how and in what instances their components are used; only the final manufacturer of the product has this visibility.

    The potential legal risk, without an upside, would discourage OSS developers from contributing to and maintaining open source projects. This situation not only undermines the spirit of open source but could bring about an open source crisis and isolate the EU from the rest of the world. Non-EU open source producers will avoid the EU market, meaning no access to Linux, Apache, Kubernetes and many other projects. Repositories like Maven Central, npm and PyPi may be prompted to ban EU consumption to avoid being considered a distributor. EU projects concerned about liability could pull their source code off the internet, and EU businesses may be forced to halt contributions to open source projects.

    CRA Imperils Vulnerability Disclosure

    The regulation also would require that vulnerabilities be disclosed to the European Union Agency for Cybersecurity (ENISA) within hours of discovery, whether or not a fix is available. This would make it difficult to conduct coordinated disclosure—where researchers give vendors time to develop security patches before vulnerabilities are disclosed publicly. This would increase the chances that bad actors will develop exploits for the vulnerabilities before they are fixed, putting every company that uses that software at risk. This would be an unfortunate outcome for a law whose purpose is to improve security of software.

    What Can we Do?

    As I mentioned earlier, time is of the essence since this measure is moving quickly and faces a vote this week. We need the community to take immediate action. GitHub and other industry bodies need to publicly oppose the proposed measure. EU developers, maintainers and others need to ask their European Parliament Members (MEPs) to investigate further and bring the voices of the open source community to the discussion.

    Legislators need to understand the importance of collaboration and the role of the global developer community in driving open source innovation. Open source projects underpin much of the software we use every day. It’s the lifeblood of the internet. Legislation that deters contributors would interfere with the open source community’s ability to maintain existing projects and deliver new software, impacting the tech industry, hurting the EU economy and compromising overall software security.

  • Adopting a Low-Code GraphQL Approach to Build a Core Data Platform

    Adopting a Low-Code GraphQL Approach to Build a Core Data Platform

    Our education platform has relied on an outdated monolithic legacy application for years. It’s an outdated system built of a single service layer on top of a database designed for use cases that have evolved over the last decade. But we’re using the wealth of data in the monolith as a foundation for our current projects, thanks to our newly adopted tools.

    With our product line continually expanding, our need for a centralized API that can sit over commonly used data has become even more critical. This includes data related to our customers’ organizational units, purchased products, licensing information, and student, teacher and class rosters, among other things.

    The stakes are high since we have multiple downstream clients depending on us. Our goal is to move some functionality and data out of the main system while making sure our design is flexible enough to adapt to future product changes. We envision a hub-and-spoke model where all our products interact through a central hub to access shared data. Efficiency, security and reliability are all top priorities. Because we’re a small team, we need to move fast and be open to new ideas. That’s why we’re using a low-code backend solution to minimize manual coding and maximize our productivity.

    A few months ago, we adopted a tool called Hasura. Its core value proposition is that it places a production-grade GraphQL API over any database, saving teams months of recurring effort in building, shipping and maintaining their APIs. We put the open source Hasura community edition to the test and found that it lived up to its claims. In this article, we’ll show you how it worked for us and how it can work for you too.

    Converting GraphQL to SQL

    Before a team can convert GraphQL to SQL, they must undergo a data modeling phase. After this data modeling phase, backend teams must complete some unavoidable tasks. One of these tasks is to build an API that allows clients to read and mutate data. Hasura provides this instantly, freeing engineers from the toil of writing basic CRUD APIs. Hasura compiles a GraphQL string into a GraphQL abstract syntax tree (AST), which is then compiled into a SQL AST. This abstraction lets us do powerful things, like using a bulk GraphQL mutation to transactionally and atomically insert or update data. GraphQL provides a flexible way for us to query our data in the form of a graph. This means that, as engineers, we get to focus more on business logic.

    API Federation, Aggregation and Composition

    Hasura’s support for remote GraphQL schemas enables us to design a service-oriented architecture in which Hasura functions as an API federation/composition layer and delegates to other Go microservices that provide specialized business logic for a particular domain. This ability to federate doesn’t just end at remote GraphQL schemas—Hasura also supports remote data sources, opening multiple possibilities for how we traverse through the graph and explore relationships in our data, including how we might join remote databases to each other or to remote APIs (REST or GraphQL).

    In greenfield projects, teams typically spend months crafting a fully-featured API, a common language that all clients can share. With Hasura, we get this in seconds and can spend that saved time writing automated tests or implementing business logic.

    Developer Dashboard

    Hasura’s Dashboard/Console improves developers’ experience. Using the dashboard, developers can craft experimental GraphQL queries and mutations against our local instance of Hasura. The embedded GraphQL playground makes it a breeze for new developers joining the team to introspect and discover our API. We can also visualize our database schema in the UI directly and make changes to it with a few clicks of a mouse (if needed), generating source-controlled SQL migration scripts like you’d find in other web frameworks.

    Observability

    No production-ready system would be complete without observability, or the ability to gauge a system’s internal state based on external output, usually in the form of logs, traces and metrics. Hasura ships logs and traces to our New Relic telemetry platform for each database operation, allowing our team to identify bottlenecks and receive early alerts of unexpected or degraded system performance.

    Authorization

    Hasura’s role-based authentication support allows us to check an additional box on our production-readiness checklist. Clients with certain roles may have permission to execute specific GraphQL API operations or access particular database tables. Hasura can derive a client’s role in one of two ways: Either the client will send Hasura a JWT auth header (which includes a signature containing claims providing the client’s role), or Hasura will refer to an external webhook which, in turn, makes the auth decision. Without Hasura, we would need to write and maintain the code to perform all of this work.

    Change Data Capture

    The last way Hasura enables us to build our core platform is through change data capture (CDC), or the process of tracking changes to a database. Hasura provides this in the form of event triggers, which function like a transactional outbox system. When a record is inserted, updated or deleted, a bona fide database trigger will record this event in a table. Then, a reliable process in Hasura will guarantee that the event is delivered at least once to its intended webhook (one of our microservices). This is tremendously useful for our team since we need to sync data from our new database to the older legacy database.

    There are many tools we could use for CDC, such as AWS SQS or Kafka (some of which we use downstream to integrate our platform with individual products), but having this feature baked into Hasura makes the process simpler, as it frees us from having to provision any new infrastructure or deal with the complexities of bringing on additional tools.

    Conclusion

    For the Teaching Strategies platform modernization team, we’re just getting started. As we continue to evolve and improve our product, we’re considering Hasura for finer-grained authorization, such as attribute-based access control (ABAC) over coarser role-based access control (RBAC). We will also investigate real-time streams so other systems, such as users’ browsers, can see data changes as fast as possible.

    Using the functionality and features of Hasura community edition outlined above, our team is well on the way to building a strong core platform. By leveraging this tool, we can meet our milestones faster and provide even more support for educators and caregivers, making their lives easier.

    Interestingly, Hasura is a combination of the programing language Haskell and the Sanskrit word asura—or demon.  As far as tech choices go, this one feels much more like a guardian angel.