Category: DataOps

  • GraphQL Vulnerability Analysis: The Top Threats

    GraphQL Vulnerability Analysis: The Top Threats

    Publicly available vulnerability data can be a goldmine for insights into how DevOps and DevSecOps teams can prioritize threats and improve security across the pipeline. With this in mind, Inigo recently performed a deep-dive analysis of known vulnerabilities affecting GraphQL components—including GraphQL clients such as Relay and GraphQL servers such as Apollo, Graphene, Ariadne, GitLab Enterprise, Magento and others. Our main data sources for this investigation were the MITRE CVE database and the HackerOne Hacktivity portal.

    Analysis and Findings From the MITRE CVE Database

    First, a few caveats about the MITRE CVE database. While it’s considered the source of truth for CVEs and the best data source available for understanding these vulnerabilities, it has its limits. Not every vulnerability gets reported, and not every reported vulnerability gets an assigned CVE identifier. Vulnerabilities generally receive a CVE identifier when an impacted software vendor or researcher recognizes a vulnerability and files a CVE request with MITRE. Large software vendors including GitLab, GitHub, Adobe and many more also serve as CVE Numbering Authority (CNA) partners, authorizing them to issue CVE identifiers themselves (often only for the scope of their own software). All this is to say that the MITRE CVE database is a strong data source for our analysis, but it shouldn’t be considered comprehensive.

    Inigo started its investigation by searching the MITRA CVE database for the term “GraphQL,” revealing 45 CVE records (at the time of the research) relevant to GraphQL clients, servers, and other components. Interestingly, the first tracked GraphQL vulnerability was CVE-2019-1000011 from 2019: Most likely not the first vulnerability ever discovered in GraphQL software, but the oldest available in this database.

    Researchers were curious to know which classes of GraphQL vulnerabilities were most common, and which GraphQL software has the most known CVEs. The following chart displays the results of the analysis answering the first question.

    Authorization bypass vulnerabilities are far and away the most common vulnerability class, and a majority representing 54.8% of all GraphQL vulnerabilities. At 16.7%, denial-of-service (DoS) vulnerabilities stand out as the second most common vulnerability class, followed by information disclosure (9.5%), code execution (7.1%), cross-site request forgery (CSRF) (7.1%) and injection (4.8%).

    Analysis into which GraphQL software has the most CVEs revealed the following:

    To be clear, these findings don’t necessarily speak to how hardened or how safe a particular GraphQL component is. Popular GraphQL servers simply draw more attention and have more eyeballs searching for vulnerabilities, whether they belong to attackers or security personnel. While this fact skews these results, viewing this data at a glance remains interesting.

    Analysis and Findings From the HackerOne Vulnerability Database

    The HackerOne Hacktivity portal offers a robust database resource that collects information on vulnerabilities as reported by researchers. The analysis looked at public reports of GraphQL vulnerabilities, finding 74 results since 2018.

    As the graph shows, identified GraphQL vulnerabilities fell mostly into the authorization class (87%), with DoS (7%) a far second and race condition and session management vulnerabilities each coming in at 2.8%.

    Bug bounties offer an interesting and likely influential factor here. Over the 2018-2022 timeframe, bug bounties granted for these vulnerabilities ranged from $250 to more than $20,000. At the same time, authorization vulnerabilities carry a high risk to sensitive data such as personally identifiable information (PII). This drives organizations to place premium bounties on these authorization flaws and motivates security researchers to focus on earning those prizes. Therefore, white-hat hackers will naturally test for authorization flaws first, perhaps leading to their overrepresentation in the data. It’s also important to note that bug bounty programs tend to prohibit testing for DoS vulnerabilities for obvious reasons, possibly reducing their representation here.

    Open-Eyed GraphQL Security

    For developers, DevOps and security teams tasked with safeguarding GraphQL deployments, the first step is knowing what you’re up against. The findings above should serve as an eye-opener that helps teams to prioritize threats, whether they be authorization, DoS and other classes of GraphQL vulnerabilities. As more and more organizations rush into GraphQL (increasingly migrating from REST APIs), security cannot be put on the back burner. There’s too much at stake, and ensuring the security of GraphQL deployments isn’t nearly as difficult or time-consuming as many teams currently think.

  • Key Findings From the 2022 State of GraphQL Report

    Key Findings From the 2022 State of GraphQL Report

    GraphQL, the open source query language, has been steadily growing in popularity over the past few years. The language is excellent for frontend development, as it creates a usable interface to fetch precisely the data required for the specific client at hand. You can also use it to aggregate multiple backend services and data sources.

    Studies show that the ecosystem around GraphQL is maturing—it has a very global user base and a growing number of tools exist to aid in its adoption. The 2022 State of GraphQL Report found that 61.8% of developers are happy with the overall state of the ecosystem. Yet many native GraphQL features go unused by developers, which suggests there is a wide range of experience levels, from novice to advanced users, working with the technology. This indicates there is plenty of room for growth and knowledge sharing.

    Below, I’ll review the key takeaways from the 2022 State of GraphQL Report, considering overall usage data and focusing on the popularity of specific features. We’ll also highlight the state of standard tools used in conjunction with GraphQL to get the job done.

    Analyzing Overall Usage Statistics

    First off, there is a wide variance in the types of GraphQL APIs in production today, ranging from private to public endpoints. The report found 47.9% of developers use GraphQL for exposing an API intended for a personal website or app, 40.4% use it for private unexposed APIs for internal usage and 19.5% use GraphQL for publicly available APIs intended for third-party developer consumption. This demonstrates its flexibility to cater to multiple scenarios. And while the majority of clients that connect to GraphQL APIs include browsers (62.3%), it’s commonly consumed by other client types such as native mobile apps, other servers and desktop apps.

    Previously, we discussed using GraphQL as a composition layer to combine underlying APIs and services. And the report backs up this idea that developers commonly use it to aggregate various data sources: 55.4% of GraphQL APIs hit databases, while 35% consume REST APIs and 14.6% eat other GraphQL endpoints.

    In terms of benefits, one strong point is the ability to enforce and validate types for every object in the API. Users find other top benefits to be avoiding overfetching and aggregating requests. Yet, some hurdles still present themselves. These top drawbacks include error handling, performance issues, client-side caching and security woes.

    Regarding user base statistics, most users have been working with GraphQL for less than five years. If we look at the type of sector utilizing GraphQL, we see it primarily leveraged in the programming and technology sector. This is followed by e-commerce and retail (16.4%), finance (8.9%) and news, media and blogging (7.2%).

    Many Advanced Features Go Unused

    Many of the more advanced GraphQL features still go unnoticed by the majority of users. For example, live queries is a feature that helps obtain live data from a GraphQL server, yet only 25% who know about it have used it. Over half of respondents had never heard of @skip, a directive that skips a field based on a value passed to it. Similarly, other directives like @specifiedBy, @defer and @stream also share little-to-no awareness or use.

    Analyzing feature usage becomes a bit more serious if we consider the unadopted security and performance features. For example, only 43.2% of respondents have disabled query introspection. Disabling query introspection is a suggested security best practice to limit a hacker’s ability to perform surveillance. But as we’ve previously covered, security by obscurity isn’t enough to protect GraphQL, and an additional security emphasis is often needed.

    As most GraphQL APIs are intended for personal or private scenarios, you would think that more security features would be leveraged to limit the threat of introspection and denial-of-service attacks. Yet, the report discovered low usage and awareness of security and performance features like query timeouts, query rate limiting and query cost analysis, all of which could be turned on to curb malicious behaviors.

    Tools Used In Conjunction With GraphQL

    Developers often seek to combine, aggregate or merge GraphQL schemas from different APIs. To do so, Apollo Federation is the most common solution, used by 22.5% of respondents. This is followed by Schema Stitching (16.9%), GraphQL Modules (4.4%), and GraphQL Mesh (2.9%).

    Looking at other technologies used in connection, Next.js is the most popular framework and PostgreSQL is the most common database used. TypeScript and JavaScript comprise the most common languages used to write a GraphQL backend. Developers also use a balanced mix of IDEs to query and test endpoints, including GraphiQL, GraphQL Playground, Postman, Apollo Studio, and Insomnia.

    The report also found relatively high usage and retention for tools like the GraphQL Code Generator schema builder, Apollo Client and Apollo Server. The data shows a crowded solution market with Apollo as an industry-leading outlier—many other clients, servers, API generators and schema builders have medium-to-high retention rates yet experience far less use.

    Final Thoughts

    The 2022 State of GraphQL Report sheds some interesting light on the state of GraphQL, validating a lot of the interest and trends we’ve covered lately on the blog. Of course, there is more to be said about many areas, such as smoothing the transition to GraphQL.

    One key finding is the low number of security features being leveraged by developers. A greater emphasis on API security is required to avoid incidents and retain a zero-trust approach. This emphasis is part and parcel of responding to ongoing software supply chain threats and will require more awareness and thought leadership around GraphQL security best practices.

    The 2022 State of GraphQL survey ran from June 15, 2022, to July 15, 2022, and collected 3,094 responses. The above analysis only scratched the surface and there are many other insights. For more findings, you can read the full results here.

  • Datadog Dives Into Universal Service Monitoring

    Datadog Dives Into Universal Service Monitoring

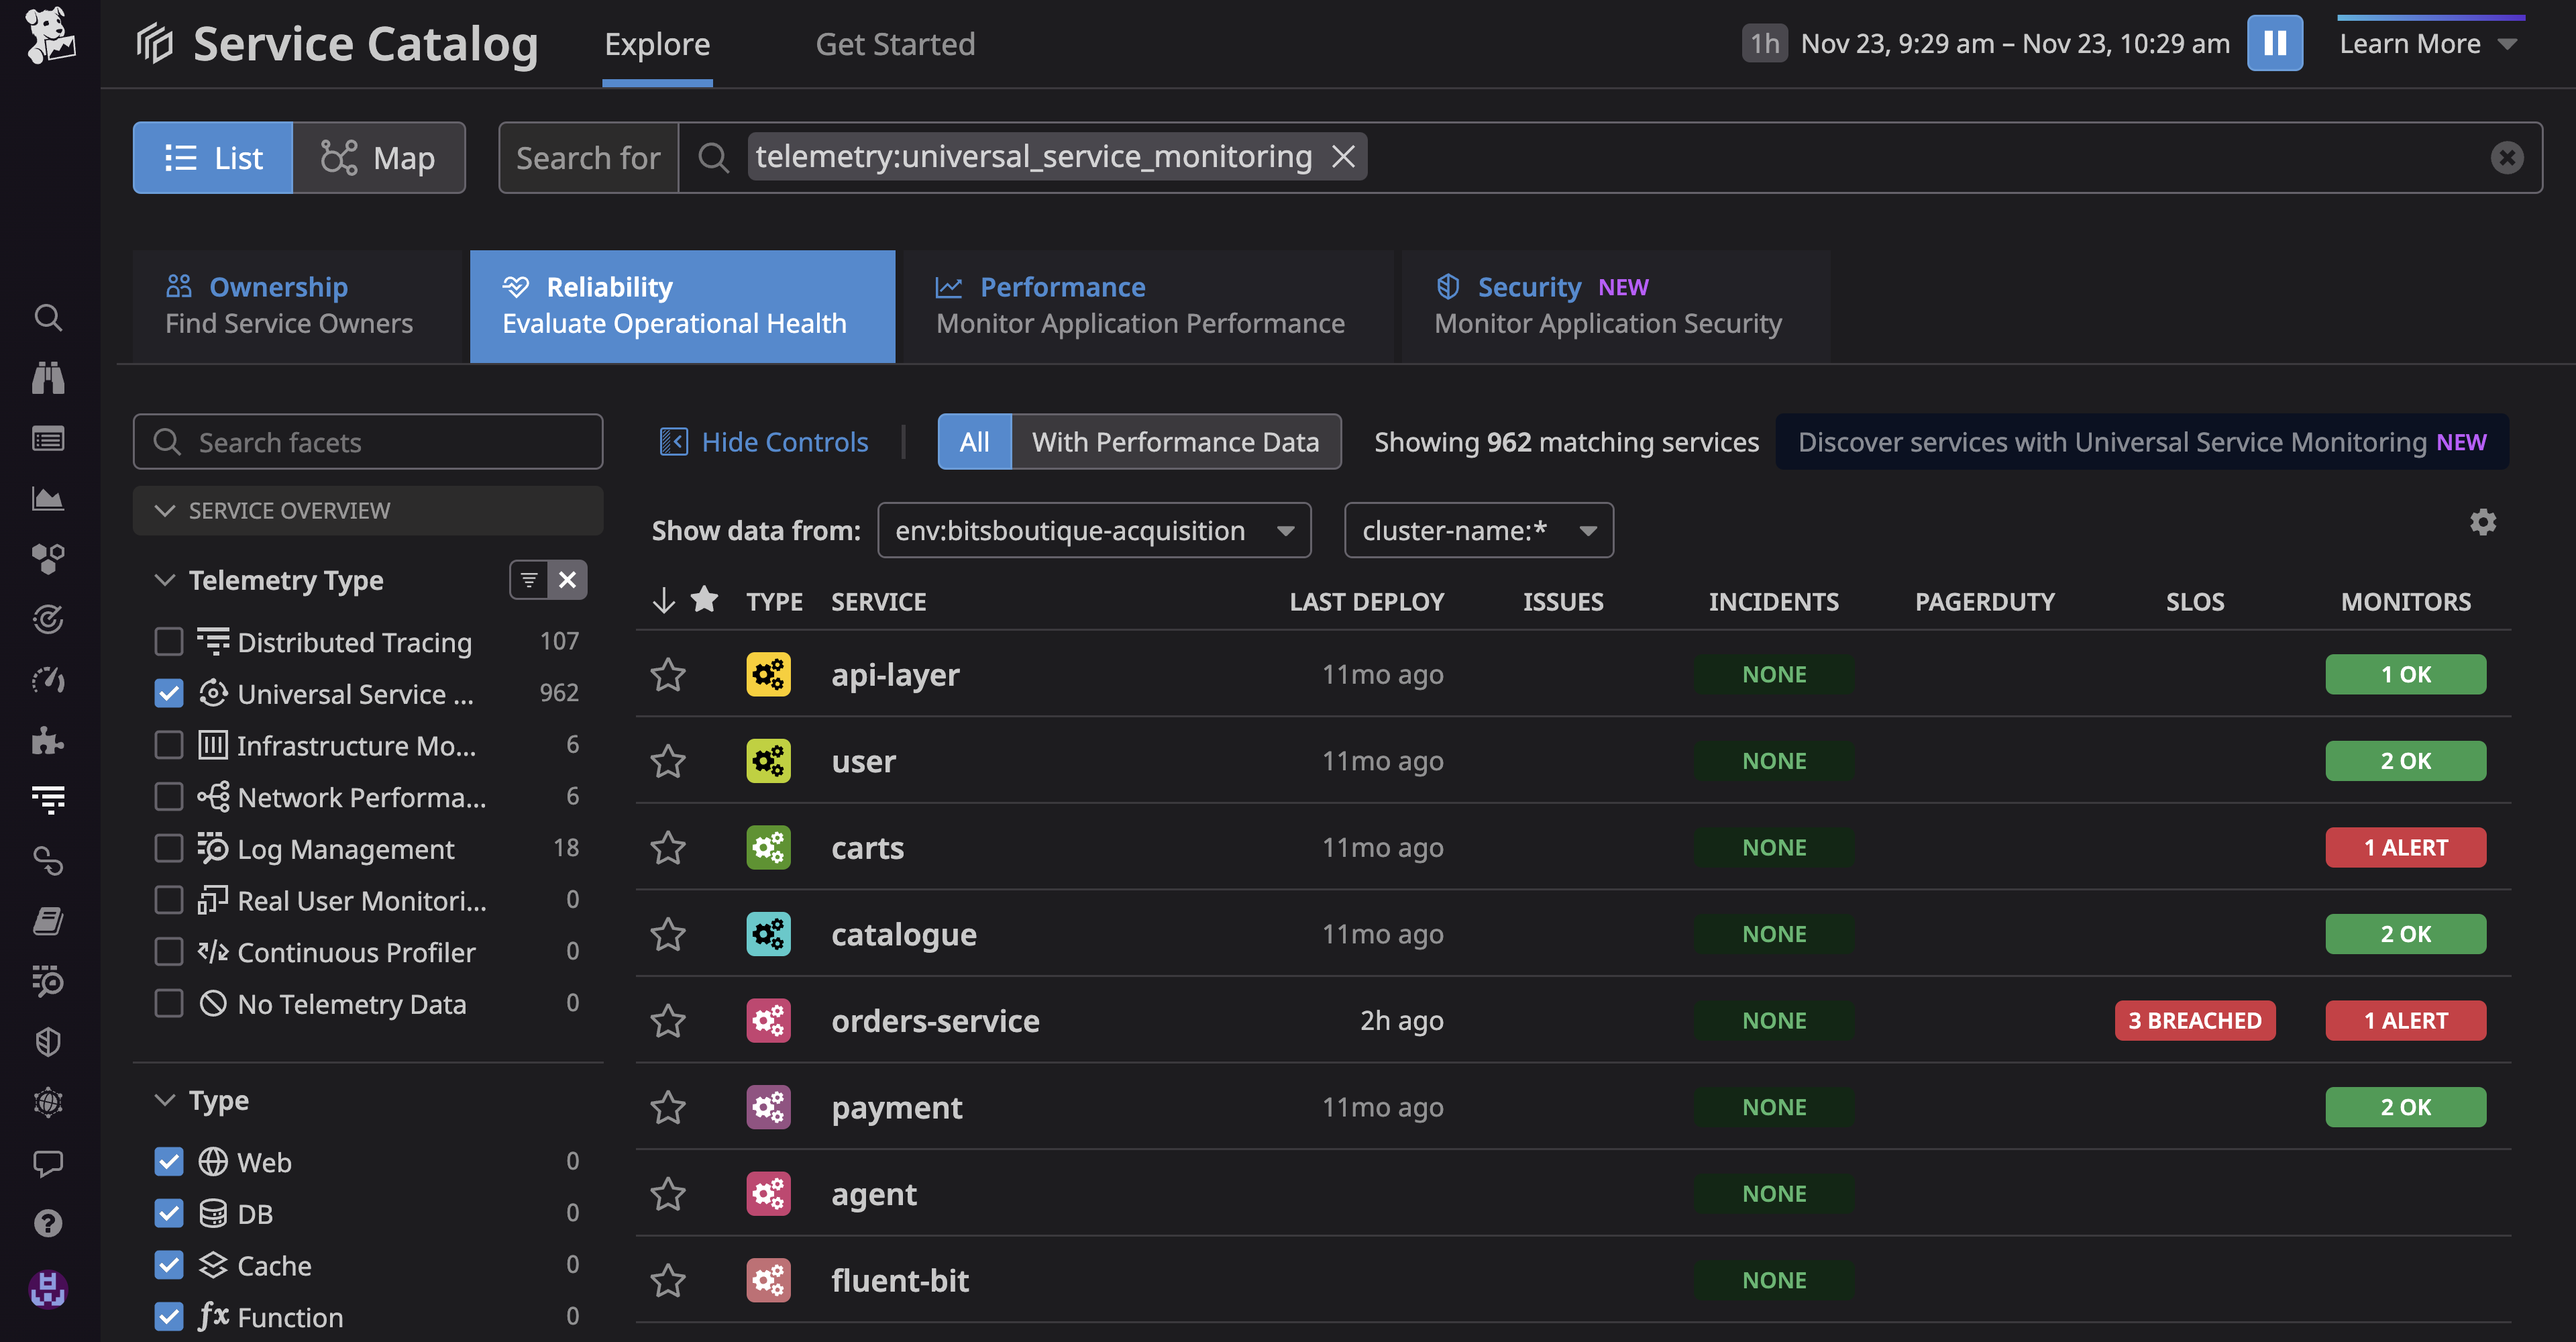
    Datadog, Inc. today made generally available a Universal Service Monitoring service that takes advantage of the extended Berkeley Packet Filtering (eBPF) microkernel in a Linux operating system to automatically detect all the services that make up an application environment without changes to the code used to construct them.

    Yrieix Garnier, vice president of product at Datadog, said as application environments continue to evolve IT teams are now trying to track not just individual microservices but also entire business processes such as order-to-cash. Before those services can be instrumented, however, DevOps teams need a simple way to discover them, he noted.

    Within the Linux operating system, eBPF makes it possible to employ a sandbox environment to identify and map the services that make up an application environment, including both internally developed and third-party services regardless of what programming languages were used to build them, added Garnier.

    DevOps teams also gain visibility into the health of every service and deployment through real-time request rate, error and duration (RED) metrics and correlated infrastructure metrics and application logs. They can then expand monitoring capabilities provided via Datadog agent software to employ distributed traces that can be correlated with observability data.

    The Datadog Universal Service Monitoring service is also integrated with the Service Catalog that Datadog makes available to determine which development team created a specific service.

    The goal is to close a visibility gap that has emerged as more IT organizations align their management efforts around specific application services in the age of digital transformation rather than the components that make up a service, noted Garnier.

    DevOps teams today are simultaneously being tasked with diving deeper into application environments to discover issues before services are disrupted and also tracking the services that span multiple application components. Collectively, the expectation is that DevOps teams will be able to ensure that application services are not just available but also consistently delivered. Ultimately, IT organizations are being tasked with removing much of the guesswork that has historically characterized the management of IT.

    Less clear is how much those shifts will ultimately drive the reorganization of IT teams that are still mostly organized around the platforms they support versus the services being delivered. However, as business leaders increasingly appreciate how dependent the overall organization is on application services, the need to manage them in a more comprehensive manner becomes apparent.

    In the meantime, DevOps teams are evaluating whether their existing tools and platforms enable them to accomplish that goal. Datadog is making a case for employing a service it manages on behalf of DevOps teams versus each DevOps team having to construct and maintain its own observability platform. Datadog, most recently, extended the reach of its namesake cloud-delivered monitoring and observability platform to address continuous testing, application security and cost management.

    It will be up to each organization to decide how best to achieve their observability goals. One thing that is certain is the current level of visibility they have into application environments is not nearly sufficient.

  • Logz.io Unveils Managed Open 360 Observability Platform

    Logz.io Unveils Managed Open 360 Observability Platform

    At the AWS re:Invent 2022 conference, Logz.io launched an Open 360 platform that combines multiple open source technologies to provide observability across both existing monolithic and emerging cloud-native application environments.

    Existing Logz.io offerings included in the Open 360 platform are Logz.io Kubernetes 360, a managed observability platform based on open source tools such as OpenSearch analytics software, Prometheus monitoring tools and Jaeger distributed tracing agents.

    In addition, Open 360 includes Logz.io Telemetry Collector agent software, Logz.io Data Optimization Hub dashboard, Logz.io LogMetrics Index for converting log data into metrics and the Logz.io Trace Sampling Wizard tool for configuring open source OpenTelemetry Collector agent software.

    Logz.io CEO Tomer Levy said rather than requiring organizations to combine a set of disjointed open software tools to create an observability platform, instances of open source tools have been curated by Logz.io. The goal is to streamline the number of tools and platforms that DevOps teams will need to observe multiple classes of applications, he noted.

    It’s still early days as far as the adoption of observability platforms is concerned, but it’s apparent that as application environments become more complex the monitoring tools DevOps teams rely on today will need to evolve. Observability platforms, in general, promise to unify logs, metrics and traces in a way that makes it simpler to launch queries to identify the root cause of an issue rather than simply tracking a set of pre-defined metrics.

    The rate at which DevOps teams will embrace observability will naturally vary, but the choice many DevOps teams are trying to navigate is how much to rely on proprietary observability platforms rather than using open source software to construct their own. Logz.io is making a case for finding a middle ground between those two extremes by relying on a managed service based on open source tools.

    Observability has always been a core DevOps tenet, but achieving and maintaining it is challenging. Most DevOps teams today aspire to maintain some level of continuous monitoring. However, as it becomes easier and less costly to instrument applications, interest is rising in observability platforms that simplify the investigation of anomalies indicative of an issue that could disrupt a distributed application environment.

    More challenging still, DevOps teams are also now managing a much wider range of application types as cloud-native applications based on microservices deployed on Kubernetes clusters are deployed alongside legacy monolithic applications running in the cloud and on-premises IT environments. The Logz.io approach enables DevOps teams to manage those applications at a lower total cost, noted Levy.

    Regardless of the approach to observability, the increasing complexity of application environments has become a major challenge for organizations that are increasingly sensitive to costs. Many of them can’t afford to hire additional DevOps engineers. Instead, the focus is on increasing the productivity of existing DevOps teams using a new generation of observability platforms that should cost less to acquire and deploy than to expand existing teams of DevOps engineers. That may not necessarily eliminate the need to hire additional DevOps engineers, but it should ensure organizations are getting the most out of the DevOps teams they already have.

  • Zilliz Unfurls Managed Vector Database Service

    Zilliz Unfurls Managed Vector Database Service

    Zilliz this week made generally available a managed cloud service that can now be spun up in less than five minutes. The service is based on the company’s open source Milvus vector database.

    Frank Liu, director of operations for Zilliz, said the managed Zilliz Cloud service running on the Amazon Web Services (AWS) cloud will make vector databases much more accessible to a wider range of application developers.

    Vector databases are gaining traction because they provide artificial intelligence (AI) application developers with a more efficient method for managing the unstructured data need to train AI models. Currently, many of those teams are relying on labels and tags to classify and manage data. The Milvus vector database employs deep learning algorithms and its own AI model to create and store, index and manage vectors to more efficiently classify data, said Liu.

    Based on a cloud-native architecture that, for example, employs Kubernetes to scale consumption of cloud resources more efficiently, Zilliz Cloud can also scale to process tens of billions of high-dimensional vector data for data-intensive applications, he added. The company claims Zilliz Cloud delivers up to 10 times greater throughput and five times lower latency for read and write operations for data-intensive workloads.

    Other attributes of the managed Zilliz Cloud include support for multi-language software development kits (SDKs), a web-based graphical user interface to search and explore data, SOC 2 compliance, network isolation using IP whitelists and full data encryption in transit (TLS).

    In the future, Zilliz also plans to add support for Microsoft Azure Cloud and Google Cloud Platform in addition to graphical processor units (GPUs) to optimize the performance of its deep learning algorithms.

    Potential use cases for a vector database span everything from image retrieval and video analysis to fraud detection to drug discovery. Organizations that already use Milvus, which is being advanced under the auspices of the LF AI & Data Foundation, include eBay, Shopee and SmartNews.

    In general, the rise of data-intensive workloads is driving more organizations to embrace DataOps best practices to optimize the management of massive amounts of data. Organizations that build AI models are typically at the forefront of those efforts given the massive amounts of data typically required to train AI models. The challenge organizations have historically faced is not many have the internal expertise required to manage a vector database. The Zilliz Cloud eliminates the requirement by relying on the expertise of a team of database administrators trained by Zilliz to operate a managed service.

    It’s not clear at what rate organizations are embracing vector databases to build AI models. As the next era of applications are constructed, it’s only a matter of time before the machine learning operations (MLOps) practices used to build AI models converge with DevOps practices used to build the applications in which those models will be embedded. The challenge is the data science teams that build AI models tend to also have a distinct DataOps culture all their own; DevOps teams will need to find a way to embrace and extend that.

    In the meantime, the number of types of databases being used to build applications will only continue to expand so it will be up to each DevOps team to know when to manage each one themselves versus relying on a managed service.

  • Switching From FluentD to Vector Log Aggregation Tool

    Switching From FluentD to Vector Log Aggregation Tool

    Log files are extremely important to the data analysis process as they contain essential information about usage patterns, activities and operations within an operating system, application, server or device. This data is relevant to a number of use cases across an organization from resource management, application troubleshooting, regulation compliance and SIEM and business analytics and marketing insights. To manage logs created by these use cases and make use of this wealth of data, log aggregation tools enable organizations to systematically collect and standardize log files. However, choosing the right tool can be quite challenging.

    This blog will detail and compare the popular open source fluentD and Vector tools for log aggregation.

    fluentD Configuration and Efficiency Calculation

    When using orchestration tools like Kubernetes to deploy containers or other API resources, there is a need for a log aggregator to store the pod or node logs in a cloud platform. For a particular requirement, fluentD was used as a log aggregator tool to push K8s pod logs to cloud storage buckets with a sample configuration as shown below:

    <match kubernetes.**>

    @type <cloud platform name>

    project <project name in cloud platform>

    keyfile <credential json to access the cloud storage> bucket <cloud storage bucket name> object_key_format <name for the file to be used>

    path <file prefix/path where the file have to be stored>

    <buffer tag,time>

    @type file

    path /var/log/fluent/gcs timekey 1m timekey_wait 30 timekey_use_utc true flush_thread_count 16 flush_at_shutdown true flush_mode interval flush_interval 1 chunk_limit_size 10MB retry_max_interval 30 retry_wait 60

    </buffer> <format>

    @type json </format>

    </match>

    Using this system, fluentD was pushing only 47.62% of total logs to cloud storage. Since there was a loss of more than 50%, changes were made to the configuration. In most of the changes, the efficiency was somewhere between 40% and 50%, with a maximum efficiency achieved at an average 67% for an entire day. Below are some of the changes made along with the percentage of logs that were pushed to cloud storage:

    <buffer tag,time> @type file

    path /var/log/fluent/gcs timekey 1m timekey_wait 30 timekey_use_utc true flush_thread_count 16 flush_at_shutdown true retry_max_interval 60 retry_wait 30

    </buffer> Efficiency:- 46.32%

    <buffer tag,time> @type file

    path /var/log/fluent/gcs timekey 1m timekey_wait 30 timekey_use_utc true flush_thread_count 16 flush_at_shutdown true

    </buffer> Efficiency:- 49.89%

    <buffer tag,time>

    @type file

    path /var/log/fluent/gcs timekey 10m timekey_wait 0 timekey_use_utc true flush_at_shutdown true

    </buffer> Efficiency:- 37%

    <buffer tag,time> @type file

    path /var/log/fluent/gcs timekey 30 timekey_wait 0 timekey_use_utc true flush_thread_count 15 flush_at_shutdown true

    </buffer> Efficiency:- 60.88%

    <buffer tag,time> @type file

    path /var/log/fluent/gcs timekey 1 timekey_wait 0 timekey_use_utc true flush_thread_count 16 flush_at_shutdown true flush_mode immediate

    </buffer> Efficiency:- 66.77%

    Vector Deployment, Configuration and Resultant Efficiency

    To improve this further, the open source Vector tool by Datadog was also considered. This tool was suitable for K8s setup with a similar configuration as fluentD and was installed in the nodes.

    A Helm command was used to clone the official repository in its VMs; the configuration was changed as described below and installed it as an agent. Vector comes in two working modes: Agent and aggregator. While agent is the plain mode that pushes logs/events from source to destination, aggregator is used to transform and ship data collected by other agents (in this case, Vector).

    The installation of this tool requires a Helm repository in the local machine to fetch the source code. Hence the below commands were run in a sequential pattern before installing Vector in a K8s cluster:

    helm repo add vector https://helm.vector.dev (Adding vector repo to helm list)

    helm repo update (Updating the helm repos)

    helm fetch –untar vector/vector . (command to clone the repository to local machine)

    Configuration:-

    data_dir: /vector-data-dir

    sources:

    <Custom source id>:

    type: kubernetes_logs (because we are using kubernetes as our source)

    exclude_paths_glob_patterns: <Array of directories which has be excluded when collecting the logs from the nodes> (Optional)

    sinks:

    <Custom sink id>:

    type: <Destination cloud storage>

    inputs: <Array of source id’s from where log has to be pushed>

    bucket: <Bucket name of cloud storage>

    key_prefix: <Path inside the bucket where the logs has to collected> (Optional) encoding:

    codec: <Encoding of the log file> (Optional) Command to install the Vector:-

    helm install vector . –namespace vector

    After deploying Vector in the development environment and testing it, the efficiency was ~100% with negligible loss. The switch was then made to Vector and deployed in the production environment. Vector can ship up 100,000 events or logs/sec, which is a very high throughput rate compared to other tools for log aggregation performance. Vector was able to achieve 99.98-100% efficiency even in the Kubernetes production cluster.

    To learn more about how DataOps can enable highly performant data pipelines with real-time logging and monitoring, watch this video. 

  • VMware Backup Guide for Hyper-V Admins

    VMware Backup Guide for Hyper-V Admins

    At first glance, the Hyper-V and VMware virtual environments may seem similar, but upon closer inspection, a number of important differences between these two virtualization platforms become apparent. Initially, performing administration for VMware vSphere could present some challenges for administrators who are familiar with Hyper-V. There are several reasons a business might be switching from Hyper-V to VMware. The company could be deploying a multi-hypervisor environment – e.g., using Hyper-V for Windows-based virtual machines (VMs) while introducing VMware vSphere for VMs running Linux, Free BSD, Solaris, etc. This blog post is intended to help Hyper-V administrators understand the differences and similarities between these two major virtualization platforms, making the transition to VMware easier.

    Comparing Hypervisor Design

    The Hyper-V Role for Servers and Workstations

    Hyper-V users can set up the Hyper-V role not only on the Windows Server operating system (OS) but also on desktop versions of Windows, such as Windows 7, 8 or 10. The installation is similar for both server and desktop solutions. Hyper-V is classified as a type 1 hypervisor, meaning that it is run directly on hardware. There is also a lighter-weight alternative to installing the Hyper-V role on Windows Server: Microsoft Hyper-V Server. Hyper-V Server is a standalone product that is installed on bare metal.

    VMware Workstation for Workstations and VMware ESXi for Servers

    VMware provides VMware Workstation for installation on desktops with Windows and Linux-based operating systems. VMware Workstation is a type 2 hypervisor. A type 2 hypervisor is installed on the underlying OS. As you can see, both Hyper-V and VMware support installation on users’ PCs. If you want to install a type 1 hypervisor on bare metal, you should use VMware ESXi Server. VMs running on VMware Workstation can be migrated to ESXi Server with the VMware vCenter Converter.

    Management Tools

    vCenter as the Analog to SCVMM

    System Center Virtual Machine Manager (SCVMM) is a special universal product created by Microsoft for centralized virtualization management of Hyper-V hosts, clusters, virtual networks and storage. SCVMM is useful for the management of complex multi-site and multi-domain environments.

    Hyper-V Manager is a common tool that is available by default upon installation of the Hyper-V role. With Hyper-V Manager, you can connect to an available Hyper-V host. You can manage the host, the VMs residing on that host, the virtual devices of those VMs and VM replication. You can also create VM checkpoints, start or stop VMs and connect to VMs in order to interact with the user interface of a guest VM.

    Failover Cluster Manager is a tool for managing failover clusters and VMs within a cluster. With this tool, you can create a failover cluster. Failover Cluster Manager is not a substitute for Hyper-V Manager; you still need the latter to manage non-clustered VMs, Hyper-V hosts, virtual switches, etc.

    The equivalent of SCVMM in VMware vSphere is vCenter Server, which can perform the tasks that Failover Cluster Manager and Hyper-V Manager handle in Hyper-V environments. With vCenter Server, you can manage almost all components of vSphere – hosts, clusters, virtual networks (including standard vSwitches and distributed vSwitches), datastores, VM virtual devices, etc. vCenter is installed on a virtual machine, and the vCenter web interface can then be accessed through a browser. You can use vSphere Web Client (which comes in HTML5-based or Flash-based versions) to access vCenter via a web browser. To do so, simply enter the IP address of your vCenter server in the address bar of your browser.

    If you have a standalone ESXi host, you can similarly access that host using a browser with the vSphere client. Enter the IP address of your ESXi server in the address bar of your browser. Note that you cannot create data centers, configure distributed virtual switches or perform VM migrations when accessing a standalone ESXi host with the vSphere client.

    Below, you can see vCenter v.6.5 accessed via browser with vSphere Web Client. If you want to access the VM’s user interface, click Launch Web Console.

    A new tab is opened and you can interact with the guest OS.

     Another way to access the user interface of a VM is using VMware Workstation. For connection to a VM running on the ESXi host from VMware Workstation, click File > Connect to Server.

    Input the IP address of vCenter or ESXi Server, as well as the user name and password required to access that server. Click Connect.

    In the left pane of the VMware Workstation interface, you can see a list of VMs residing on the ESXi host to which you are connected. If you connected to vCenter, you would see the objects such as Datacenters, ESXi hosts and VMs that are managed by vCenter Server.

    PowerShell Vs. PowerCLI

    With the Hyper-V platform, the alternative to using a GUI for management of the virtual environment is using PowerShell. PowerShell is command-line shell that is available on Windows-based systems, allowing users to manage system components. PowerShell provides automation using combinations of cmdlets and scripts.

    In VMware vSphere, you should use PowerCLI as the alternative to a GUI. PowerCLI is a scripting tool built on PowerShell. It extends PowerShell and includes a set of more than 600 cmdlets. You can automate installation and configuration of any features, virtual machines, system patching, etc.

    Clusters

    VMware HA and DRS Clusters Vs. Hyper-V Failover Cluster With PRO

    The Hyper-V virtual environment offers failover cluster functionality. A failover cluster provides automatic failover of VMs from failed hosts to healthy hosts within a cluster. Upon host failure, VMs from the failed host are restarted on other Hyper-V hosts in the cluster. The Performance and Resource Optimization (PRO) feature collects data about resource usage in the virtual environment and generates PRO tips, recommending migration or reconfiguration of VMs for more rational usage of hardware resources. Since Windows Server 2012, PRO was replaced with Dynamic Optimization.

    There are two types of clusters commonly used in VMware vSphere – High Availability (HA) clusters and Distributed Resource Scheduler (DRS) clusters. The HA cluster provides high availability of VMs and carries out automatic VM failover in case of host failure within a cluster. The VMs that were running on the failed ESXi host are restarted on healthy ESXi hosts. The DRS cluster is used for load balancing. vCenter server monitors the usage of hardware resources such as CPU and memory for VMs and ESXi hosts within a cluster. If, after calculations and analysis of these metrics, the DRS decides that some of VMs can migrate from one ESXi host to another (e.g., from an overloaded host to a host with free resources that is almost idle) for more rational resource usage, then migration recommendations are generated. These recommendations can be applied manually or automatically depending on your DRS configuration.

    Power Optimization Vs. Distributed Power Management

    Power Optimization is a feature of Dynamic Optimization in Hyper-V. Power Optimization allows the migration of VMs from Hyper-V hosts with low workloads to other hosts that have enough resources within a cluster. The unused hosts are then powered off in order to save energy. The powered-off hosts are powered back on as soon as their hardware resources are needed for the cluster.

    Distributed Power Management (DPM) is a component of the DRS cluster in the VMware vSphere virtual environment. Similarly to Dynamic Optimization, the DPM executes VM migration from less loaded ESXi hosts to ESXi hosts that have sufficient resources to run the migrated VMs. The freed-up ESXi hosts are powered off (put into a standby state) to save power. When load is increased and the cluster needs more hardware resources again, those ESXi hosts are powered back on.

    Fault Tolerance in VMware HA Clusters

    VMware also provides a useful feature for HA clusters: Fault tolerance. If you use an HA cluster, in the event of ESXi host failure, there is a period of VM downtime between the VM’s failure and the VM being loaded on another healthy host. Using the fault tolerance feature in the HA cluster helps avoid any downtime. This is because a second VM (ghost replica), which is an exact copy of the VM protected with fault tolerance, is already running on another ESXi host within the cluster. The ghost replica is in an inactive state (its network connections and output are disabled) until the primary VM fails. When the host on which the primary VM was running fails, the ghost replica becomes active in an instant, and the network connections of the replica become enabled. Switching to the ghost replica is smooth; you would only notice a slightly higher latency for one packet if you were to ping the IP address of the protected virtual machine. There is no data loss or service interruption if you are using fault tolerance.

    Migration

    Live Migration Vs. vMotion

    There are two types of VM migration for Hyper-V: Live migration and quick migration. Quick migration puts the VM into a saved state, which is similar to hibernation. The VM’s memory is saved to the disk where the other VM files are located. There is a small period of VM downtime once the VM is put into a saved state until it is registered on the new host. Live migration is used for VM migration between Hyper-V hosts (including failover clustering) without losing service availability. The migration procedure consists of different stages. The most important stage of live migration is the iterative transfer of VM memory pages.

    The analog of Hyper-V Live Migration in VMware vSphere is vMotion. With vMotion, running VMs can be migrated from one ESXi host to another without interrupting the VMs and services that are running on the hosts. When the VM migration process from a source ESXi host to a destination host is initiated, the following operations are performed.

    First, compatibility is checked to ensure that the VM can be run on the target host. Hardware resources are reserved on the target ESXi host and the VM process is started. A VM memory checkpoint is created; all further VM memory changes are written to a special area. The data stored in memory before creating a checkpoint is copied to the target VM. The source VM is running and some memory pages are changed (these pages are called dirty pages). They are written to change buffers, which are copied to the target VM and integrated into the memory of the target VM. The process of copying dirty pages is repeated over and over (an iterative process) until there are no memory changes in the source VM’s memory compared to the destination VM’s memory. vMotion then stops the CPU of the source VM, copies the last change buffer, and integrates the memory changes stored in that buffer to the virtual RAM of the target VM. Disk access is discontinued on the source ESXi host and is started on the target ESXi host. vMotion sends a reverse ARP (Address Resolution Protocol) to the physical switch for the purposes of updating the MAC and IP address mappings. The source VM is then shut down and the VM process is deleted on the source ESXi host.

    Storage Migration Vs. Storage vMotion

    Hyper-V Storage Migration can move VM configuration files, checkpoint files, virtual hard disks and mounted ISO files to a new location. Storage migration can be used when the VM must continue running on the same Hyper-V host but must migrate to another storage location. If the VM must be run on another host and placed on another storage location, then live or quick migration must be used along with storage migration.

    Storage vMotion is the vSphere analog of Hyper-V’s Storage Migration. Storage vMotion can perform live migration of VM components such as VM virtual disks (VMDK files) and VM configuration files to another storage (e.g., ESXi local datastore, shared SAN datastore, etc.). First, the VM metadata (including configuration, swap and log files) stored in the VM’s home directory is copied, then the virtual disks are copied.

    Changed block tracking is used to track the changes after the first replication of the source VM’s virtual disk. While the source VM is running, the disk changes are copied in several iterations to the target virtual disk until there are no differences between the source and target virtual disks.

    The virtual disks can be transformed from thick-provisioned disks to thin-provisioned disks or vice versa. During migration with Storage vMotion, the ESXi host on which the VM is running does not change. Storage vMotion is used together with vMotion when the VM must change hosts and datastores at once.

    Storage

    Cluster Shared Volumes (CSV) Vs. VMFS Cluster File System

    Cluster shared volumes are developed to provide simultaneous access to the same disk by multiple Hyper-V hosts in a cluster for reading and writing data. Disk volumes with NTFS or ReFS file systems must be used for CSV.

    VMFS is a virtual machine file system that is optimized for virtual machines and is suitable for clusters in vSphere. A VMFS can be shared by multiple ESXi hosts in a cluster for reading and writing data. This high-performance file system holds files with metadata and has specific locking mechanisms to prevent data corruption caused by writing metadata by multiple hosts concurrently.

    SMB 3.0 Vs. NFS

    SMB 3.0 is a network-sharing protocol developed by Microsoft that can be used for accessing file-level shared storage by Hyper-V hosts in Hyper-V environments as well as Windows environments in general.

    Network File System (NFS) is a sharing protocol developed by Sun Microsystems that provides access to files in file-level shared storage. NFS can be used by different vendors, by different operating systems, and in networks that have different architectures. NFS can be used by ESXi hosts in vSphere for accessing VM files located on shared storage.

    VHDX Vs. VMDK (VM virtual disks)

    VHDX (VHD) is a file format of Hyper-V VM virtual disks. Gen1 VMs can use either VHD or VHDX virtual disk files. Gen2 VMs can use only the VHDX virtual disk file format.

    VMDK is an open file format of VMware VM virtual disks developed by VMware.

    Dynamic Disks vs. Thin-Provisioned Disks

    Dynamic disks are dynamically expanding virtual disks for Hyper-V VMs. The main purpose of using dynamic disks is to save storage space. When Dynamic Disk is created, not all provisioned space is occupied by the virtual disk file. Initially, the virtual disk is a small file. It grows as data is written to the disk.

    Thin-provisioned disks in the VMware virtual environment are similar to Hyper-V’s Dynamic disks. A thin-provisioned disk has a minimal size upon creation and grows as needed as data is written to the virtual disk.

    Checkpoints Vs. Snapshots

    A Hyper-V checkpoint is used to save the state of a virtual machine at a given point in time. You can create a checkpoint, work with a VM, and then revert the VM back to the state it was in when the checkpoint was created.

    The VMware snapshot is the analog to the Hyper-V checkpoint; it, too, is used to save the current state of a VM. You can take a snapshot at any time, e.g., before updating software configuration, updating installations, testing new software, etc. A snapshot can be taken even while a virtual machine is running. The snapshot captures the following VM data: Virtual disk states, virtual memory content, and VM settings. The following files are created and stored in the VM directory when a snapshot is taken: .vmdk, -delta.vmdk, .vmsn, and .vmsd.

    Pass-Through Disks Vs. Raw Device Mapping

    A pass-through disk is a physical disk that is mounted to a VM and used instead of (VHD/VHDX) virtual disks in Hyper-V environments.

    Raw device mapping (RDM) is an alternative to the use of virtual disks for accessing the VM disks in vSphere. Depending on your settings, you can let virtual machines access the physical storage device directly when RDM is used. RDM can be used in virtual compatibility mode or physical compatibility mode.

    Virtual compatibility mode provides full virtualization of the mapped device; snapshots can be used.

    In physical compatibility mode, the guest OS can access the hardware directly; minimal SCSIvirtualization is provided. If a VM snapshot were taken, the RDM disk would not be included in that snapshot.

    For example:

    Suppose DiskName.vmdk is a disk heading file.

    DiskName-rdmp.vmdk is the mapping file (as evidenced by the -rdmp suffix).

    A mapping file resembles a symbolic link to a mapped device.

    RCT Vs. CBT

    Resilient Change Tracking (RCT) makes it possible to copy only those data blocks that have changed since the last backup when an incremental backup of Hyper-V VMs is performed. RCT technology was released with Windows Server 2016. Files with .RCT and .MRT extensions are created when RCT is enabled.

    Changed Block Tracking (CBT) is the vSphere analog of RCT for Hyper-V, helping perform incremental backups. CBT allows backup software to track the blocks that were changed since the last backup and copy only the changed blocks. Files with .CTK extensions are created for each VMDK virtual disk and snapshot file. Block changes are tracked on the virtualization layer. The VMware vSphere API for Data Protection allows third-party software to access the CBT feature for the purposes of performing backups and replications more efficiently. Changed Block Tracking was introduced by VMware in 2009 with ESX 4.0.

    Storage Spaces Vs. vSAN

    Windows Storage Spaces is a technology that abstracts storage from physical disks, used for storage virtualization and provisioning. With Storage Spaces, you can create cost-effective, scalable, highly-available software-defined storage for Hyper-V virtual environments by using servers with HDD devices.

    VMware vSAN (Virtual Storage Area Network) is the equivalent of Windows Storage Spaces. vSAN provides a distributed concept of data storage that is integrated with vSphere at the cluster level and abstracted from hardware disks. ESXi hosts managed with vCenter must be used to deploy vSAN. This approach allows disks of ESXi hosts to be used for vSAN storage while ESXi hosts are used to run VMs. SSDs can be used for caching data, while HDDs are used to store data. Disk groups are aggregated into pools that are accessible for the entire cluster. The data can be mirrored on one or more hosts, which ensures protection against failure. This is defined by the number of failures setting. Using vSAN, you can achieve reliable and scalable enterprise-grade storage.

    Dynamic Memory Vs. Virtual Memory Overcommit

    Dynamic memory allows a VM to use the amount of memory that it currently needs, rather than all virtual memory provisioned for that VM. The hardware RAM on Hyper-V servers can be used more rationally with this feature.

    VMware Virtual Memory Overcommit is the equivalent feature in VMware. Both features use dynamic memory allocation methods, but the methods differ somewhat. With VMware, you can allocate more memory than the ESXi host has for VMs, thereby increasing the density of VMs on the host. The idea is to optimize physical memory consumption – thus, more VMs can run on the ESXi host, but there is no guarantee that all the memory provisioned for it can be provided to a particular VM at a given point in time. Using Memory Overcommit presumes that a memory can be rearranged between the VMs depending on demands. 25% of unused memory is reserved on an ESXi host in case the memory requirements of its VM suddenly increases.

    Hyper-V Integration Services Vs. VMware Tools

    Hyper-V “Integration Services” is a set of tools and drivers for providing proper functionality of child VMs and time synchronization. When Integration Services are installed, the standard drivers for mouse, keyboard, disk controllers, and network controllers are replaced by drivers included as part of the Integration Services suite for better performance and user experience.

    VMware Tools is a collection of drivers, modules, and utilities that is the VMware equivalent of Hyper-V Integration Services. VMware Tools offers advanced functionality to improve performance, user interaction with guest VMs, and integration. When VMware Tools is installed, you can shut down the guest OS directly from menu in the vSphere client or VMware Workstation. Video resolution and graphics performance are increased. Other useful features like Drag & Drop, shared folders, time synchronization, copying/pasting between VMs and hosts, and grabbing/releasing of the mouse cursor also become available. VMware Tools is usually provided as an ISO image or Operating System Specific Package (OSP).

    Migration from Microsoft Hyper-V to the VMware vSphere Platform

    Transitioning from Hyper-V to vSphere can be useful if the vSphere virtualization platform better meets your company’s needs. First, you should prepare the hardware and software. Check VMware’s hardware compatibility list to ensure that your hardware is officially supported. Install ESXi servers, vCenter, and other software that you need. Download and install VMware vCenter Converter. Run VMware vCenter Converter and click Convert Machine.

    Select Hyper-V Server as a source type. Select the IP address or server name of your Hyper-V Server. In this walkthrough, vCenter Converter is installed on the Hyper-V Server and localhost is input as the server name.

    Next, input the username and password of an account that has sufficient permissions to perform the operation. The Windows Administrator account is used in this example. Click Next.

    Select the virtual machine to be converted. Click Next.

    Select VMware Infrastructure virtual machine as the destination type. Type the IP address of your vCenter Server or ESXi host, then enter the username and password. Click Next.


    Select the folder and the name that should be applied to the destination VM after conversion. Click Next.

    Select a destination location, including the ESXi host and datastore. Click Next.

    Configure the options for the destination VM. You can see how to change the type of virtual disk provisioning in the screenshot provided below. Click Edit in the Data to copy section.

    In the dropdown list, select the disk provisioning type (thick or thin). Click Next.

    Check the summary and, if you are satisfied, click Finish.

    Wait until the conversion task is complete.

    Once the VM conversion is finished, you can open vCenter with vSphere Web client in your browser and find the converted VM. In this walkthrough, the VM name is Server2016-01. As you can see on the preview screenshot, the VM is successfully running. Click Launch Web console to access the user interface of the VM. You can now tune the virtual machine and install VMware Tools.

    You now know how to migrate from Hyper-V to VMware vSphere.

    Conclusion

    Knowing the differences and similarities between features of VMware and Hyper-V environments makes migration from one platform to another easier and is particularly useful for administrators of a multi-hypervisor environment. Understanding the architecture as well as the working principles of both virtualization platforms, along with their feature sets, helps administrators work comfortably and effectively when they are tasked with maintaining the less-familiar platform. There is one important rule that applies to both VMware and Hyper-V environments: The VMs must be backed up regularly. Robust VM backup can protect your business-critical data against natural disasters, technological failures, human errors and virus attacks.

  • HPE Adds VMware Cloud Platform to Managed GreenLake Service

    HPE Adds VMware Cloud Platform to Managed GreenLake Service

    At the VMware Explore 2022 Europe conference, Hewlett Packard Enterprise and VMware, Inc. this week extended their alliance to integrate instances of the VMware Cloud platform into the managed HPE GreenLake service.

    Hang Tan, chief strategy officer for HPE, said for the first time HPE is managing the entire VMware Cloud stack in addition to its servers and storage platforms via a service that is based on a consumption pricing model. The goal is to reduce the total cost of IT by not requiring IT teams to overprovision IT infrastructure resources to run VMware Cloud, he said.

    Previously, IT teams could have deployed VMware Cloud on the HPE GreenLake service in a more disaggregated fashion, but that would have required separate billing processes, added Tan.

    Many organizations are currently revisiting their IT strategies during increasingly challenging economic times, noted Tan. The managed HPE GreenLake service enables IT teams to devote more of their internal IT resources to building and deploying applications rather than managing IT infrastructure, he added.

    It’s not clear how many organizations are transitioning toward a subscription model for consuming on-premises IT infrastructure, but in the cloud era it’s apparent that more of them are comfortable consuming IT as a service. HPE reported that the HPE GreenLake service supports more than 120,000 users accessing more than one exabyte of data worldwide. Among the top 100 HPE customers, nearly 80% have already adopted the HPE GreenLake platform, the company claims.

    The challenge many organizations face is they still need to deploy and update application workloads in on-premises IT environments for both performance reasons and to meet various compliance mandates. The HPE GreenLake service is an effort to bring a cloud operating model to on-premises IT environments running not just VMware Cloud but also a wide range of other rival software stacks that HPE already supports.

    Naturally, organizations that have embraced DevOps workflows would need to align the way they build and deploy applications to a managed service. IT teams that find that challenging, however, could opt for a self-service edition of the HPE GreenLake service that provides IT teams with more control over the underlying infrastructure being consumed as a service, noted Tan.

    Regardless of approach, it’s apparent that some type of as-a-service approach to consuming IT infrastructure is being more widely employed across what are becoming highly distributed computing environments. Each organization will need to determine for itself to what degree treating IT more as an operating versus capital expense makes the most economic sense.

    However, there’s no doubt that infrastructure cycles are generally going to be less disruptive when they are included as part of a multi-year services agreement. IT teams may also find it easier to take advantage of ongoing artificial intelligence (AI) advances when IT environments are managed on their behalf by a vendor.

    One way or another, the way IT infrastructure is managed is continuing to evolve at a time when organizations are starting to focus more of their efforts on applications that are becoming more difficult to build, deploy, secure and maintain.

  • Apache Druid’s Role in Modern Data Analytics

    Apache Druid’s Role in Modern Data Analytics

    From Twitter and Netflix to Salesforce and Confluent, modern analytics applications are being built by developers across the world’s leading digital businesses to create digital tools that serve real-time analytics to hundreds or even thousands of concurrent users.

    Looking more closely at what these apps do reveals some critical, strategic technology decision-making. In particular, why do developers increasingly turn to Apache Druid instead of the myriad of other databases out there?

    In general, they look to Druid to build apps that deliver on a range of objectives, including creating operational visibility at scale, customer-facing analytics, rapid-drill down exploration and real-time ML pipelines. Let’s take a look at each of these in turn:

    Operational Visibility at Scale

    Building apps for operational visibility can include a wide range of use cases, such as product analytics, digital operations, observability, fraud detection and IoT. In each situation, developers need to minimize the gap between events created and time-to-insight.

    From a technology standpoint, there are several databases that can analyze events in real-time, including stream processors like Apache Flink or ksqlDB, time-series databases like InfluxDB or TimeScaleDB and also key-value stores such as Redis. The problem is that all of these technologies share the same inherent limitation for analytics: They aren’t able to process OLAP-style queries effectively at any meaningful scale.

    For instance, if the app in question calls for analyzing time and non-time-based dimensions over the past month, assuming ingestion was one million events per second, that would equate to more than 2.6 trillion events. Any database that supports stream ingestion can query the current status (setting aside the challenge to handle ingestion at this scale) and, to an extent, basic aggregation of numbers and counters. Difficulties can arise, however, if the app requires aggregation across all of these events, “group by” on non-time-based attributes or high concurrency. Using the wrong database leaves users looking at the ‘spinning wheel of death’ as they wait for results.

    In these circumstances, devs turn to Apache Druid. A real-world example explains how: Salesforce engineers built an analytics app using Druid to monitor their product experience. The app enables engineers, product owners and customer service reps to query any combination of dimensions, filters and aggregations on real-time logs for performance analysis, trend analysis and troubleshooting. As a result, their query results are returned in seconds with billions or even trillions of streaming events ingested every day.

    Customer-Facing Analytics

    On the face of things, the technologies offered by Twitter, Forescout and Atlassian don’t have a huge amount in common. Look beneath the surface, however, and they all apply analytics to more than just internal decision-making. They have also created analytics apps and processes to provide their customers with powerful insights as part of a value-added service or a core product offering 

    What does that teach other organizations? When building analytics for external users, a whole different set of tech challenges must be addressed. While concurrency is clearly a key consideration, the database should also support current and future user growth with ease. The thing is, concurrency also has to be delivered economically, or it can have a huge impact on infrastructure costs.

    Similarly, delivering a good interactive experience is dependent on sub-second query response performance—it has become a minimum user requirement almost everywhere. Instead of fighting PostgreSQL or Hive or any other analytics database to meet the performance requirements at scale, Druid offers the performance devs and users expect.

    Take Confluent, for example, which is a popular event streaming platform. They built their cloud-based monitoring service, Confluent Health+, with Druid. Having initially used a different database, they discovered that, as their data volume grew, their legacy pipeline struggled to keep up with their data ingestion and query loads. By switching to Druid, they have been able to create the impressive user experience developers everywhere are focused on delivering.

    Rapid Drill-Down Exploration

    Generally speaking, the primary role of reports is to fulfill a simple requirement: Deliver data in a consumable form. What organizations are increasingly looking for, however, is a deeper level of insight and understanding that shows why something happened. They can take this information and apply it to a wide range of possibilities, such as solving, anticipating or preventing future problems or opportunities.

    Addressing these ‘why?’ questions means data has to be analyzed at tremendous speed to reveal root causes. While this is a simple proposition when the data set in question is small, when dealing with data drawn from today’s high-volume sources, such as cloud services, clicks and IoT/telemetry, the underlying database has to correlate a few to hundreds of dimensions across highly cardinal data with billions to trillions of rows. That presents a much more difficult challenge.

    Indeed, when data is analyzed at a huge scale, full table scans are simply too slow. Exacerbating the problem is the typical query-shaping techniques used to speed up performance have expensive tradeoffs:

    Looking at real-world use cases once again helps demonstrate the role of Apache Druid in situations such as these. For example, developers at cybersecurity company HUMAN built an analytics app for internet bot detection using Apache Druid. Previously, their cloud data warehouse was too slow to keep up with their need to drill into massive web traffic quickly. Today, their Apache-powered app gives their data scientists the ability to aggregate and filter across trillions of events instantly, meaning they can classify anomalies and train their machine learning models to detect real-time malicious activity.

    Real-Time ML Pipelines

    For many people, analytics is synonymous with viewing a synthesized data set presented via a UI like a chart, graph, report or dashboard. Increasingly, however, new operational workflows are completely automated without any human intervention or data visualization.  

    Google Maps is an example of this use case, given it optimizes routing based on real-time and historical traffic flow and patterns. Another example is Reddit’s use of Apache Druid to deliver real-time ad placement within milliseconds of a new visitor arriving on the app. In this context, there is no data visualization to interpret; it has been replaced by automated decisions derived by inference. These performance requirements play particularly well to the capabilities offered by Druid.

    Across a growing variety of demanding use cases, devs are adopting Druid to build inference-based capabilities into their apps. From diagnostics, recommendations and automated decisions, today’s organizations need instant query responses of high cardinality, alongside highly dimensional event data at scale and in real-time. Delivering performance levels like this is becoming increasingly important for businesses focused on innovation, quality of service and competitive advantage.

  • Cribl Simplifies Telemetry Data Analytics

    Cribl Simplifies Telemetry Data Analytics

    Cribl today announced general availability of a search capability that makes it simpler to query observability data where it resides without having to first collect and centrally store it.

    Nick Heudecker, senior director for market strategy for Cribl, said Cribl Search makes it possible to analyze telemetry data at its point of origin or when it is stored in a low-cost object storage platform to minimize costs.

    As the volume of telemetry data being collected continues to grow, DevOps teams are struggling with ingesting it all. Cribl takes advantage of a platform it created to stream and normalize the collection of telemetry data. Cribl Search adds the ability to also query that data at the endpoint where it resides, said Heudecker.

    While observability has always been a core tenet of DevOps, achieving it has been a major challenge. In addition to deploying and managing agent software to instrument IT environments, there’s a significant amount of time and effort required to set up the pipelines necessary to transfer data to a platform for storage and analysis. The more data is collected, the greater storage costs become. Cribl is making a case for automating those tasks using a tier of software that abstracts data into a format that can be more easily collected and analyzed.

    In general, observability is emerging as the next logical evolution of continuous monitoring. Existing monitoring tools enable DevOps teams to track specific pre-defined metrics. Observability platforms are intended to make it easier to query telemetry data to discover the root cause of an issue that is not being tracked by a set of pre-defined metrics.

    It’s not clear yet whether IT organizations perceive observability to be an evolution of monitoring or a distinctly separate but complementary capability, but it’s apparent IT teams need a lot more context than they have historically been able to attain using legacy monitoring tools. Each platform used within an enterprise typically comes with its own monitoring tools that are used by the IT teams tasked with managing it. Whenever there is an issue, it’s not uncommon for DevOps teams to spend hours correlating data from multiple tools to ascertain the root cause of a problem. Observability platforms promise to reduce that time and effort by applying analytics to data collected from multiple platforms. The challenge is finding a way to efficiently collect all that data, which in the past has often required a data engineer to build a pipeline spanning multiple sources of telemetry data.

    One way or another, observability platforms should make it easier for DevOps teams to manage IT issues more proactively. The goal, as always, is to identify issues before they cause a major disruption. In that sense, it may be difficult to prove the ROI of deploying an observability platform. However, the best IT incident is always going to be the one that never happened or, at the very least, never escalated to a level of noticeable disruption.