Author: Sharon Florentine

  • Maximizing Uptime with AI: The Game-Changer in Meeting Service Level Objectives

    Maximizing Uptime with AI: The Game-Changer in Meeting Service Level Objectives

    Quiz #21 was:

    An organization’s critical online service has a Service Level Objective (SLO) of 99% uptime. Over a quarter, the service experienced several minor incidents exceeding the 1% error budget, triggering a comprehensive review by the service owner to identify and rectify the root causes. What does this scenario illustrate about the importance of addressing even minor errors in service management?

    1.  Minor errors are insignificant in the long term and can be ignored if the service generally meets its SLO.
    2. Only major outages need to be investigated and resolved since they are the primary contributors to SLO breaches.
    3. Every error, no matter how small, contributes to the cumulative error rate and can lead to an SLO breach if not debugged and addressed
    4. Service owners should only review errors at the end of each quarter to ensure efficient use of resources.

    Correct Answer: 3) Every error, no matter how small, contributes to the cumulative error rate and can lead to an SLO breach if not addressed, highlighting the importance of proactive debugging and continuous improvement.

    This scenario underscores the criticality of monitoring and addressing every error, regardless of its size. It illustrates that neglecting small errors can lead to cumulative effects that exceed the error budget, thereby breaching the SLO. It emphasizes the importance of a proactive approach in service management, where every potential issue is debugged and resolved promptly to prevent the accumulation of errors and ensure the reliability and availability of the service.

    104 people answered this question and only 2% got it right.

    In today’s digital-first world, the reliability of online services is more critical than ever. Organizations strive to maintain their Service Level Objectives (SLOs) to ensure customer satisfaction and trust. The conventional wisdom has been to focus on the big outages, the ones that grab headlines and demand immediate attention. However, an often overlooked aspect of service reliability is the cumulative impact of small errors. These are the errors that, on their own, might not seem significant but together can breach your SLOs and compromise service quality.

    The Cumulative Effect of Small Errors

    Imagine your online service has an SLO of 99% uptime. This figure is more than just a target; it’s a promise to your customers. But as we navigate through the quarter, minor incidents begin to pile up. Individually, they seem manageable. Yet, cumulatively, they push your error rate over the 1% threshold. It’s a slow burn, one that many don’t notice until it’s too late. This scenario isn’t just hypothetical; it’s a common pitfall for many organizations, underscoring a critical lesson: Every error counts.

    The Challenge of Debugging Every Small Error

    Addressing every small error is easier said than done. Human teams are exceptional at tackling complex problems, but they are constrained by time, priorities, and the sheer volume of data. Traditional debugging approaches, while effective for individual incidents, are not scalable when it comes to the granular level of error management needed to prevent cumulative SLO breaches.

    The AI-driven Solution

    Enter AI-driven systems. The advancement of artificial intelligence has brought about a paradigm shift in how we can approach error troubleshooting. An AI-driven system doesn’t get overwhelmed by volume, doesn’t get tired, and doesn’t prioritize incorrectly. It can troubleshoot every error no matter how small and provide recommendations for remediation.

    This constant vigilance means that the accumulation of small errors, which previously went unnoticed until they breached the error budget, can now be managed in real-time. AI-driven troubleshooting that is specific to each customer transforms SLO management from a reactive to a proactive discipline. It ensures that services not only meet but exceed their reliability promises, enhancing customer trust and satisfaction.

    Changing the SLO Management Game

    With AI at the helm of error management, organizations can shift their focus. Instead of allocating substantial resources to firefighting, teams can concentrate on innovation and improvement. AI-driven systems provide detailed insights into the root causes of errors, allowing human teams to understand and mitigate systemic issues rather than just symptoms. This synergy between human expertise and AI’s capabilities is the key to pushing service reliability into new frontiers.

    The Future is Proactive

    The journey towards AI-driven service management is not just about maintaining uptime; it’s about redefining what’s possible. It’s about turning the promise of 99% uptime from a goal into a baseline, and aiming for even higher standards of service reliability and customer satisfaction.

  • The Code Caveat: When Developer Credentials Become the Hacker’s Pickaxe

    Quiz #19 was:

    One morning, you receive an alert about unusual activity within your cloud environment. Upon investigation, you discover that a malicious actor has gained access to your company’s cloud resources and deployed a cryptocurrency mining script, siphoning off valuable computing power. After tracing the breach, you realize the attacker infiltrated the system using a compromised developer account.

    How could this have happened?

    1. A developer accidentally committed their credentials to a public Git repository, exposing them to anyone with access to the repository.
    2. A developer fell victim to a phishing campaign and entered their credentials into a fake login page, handing them over to the attacker.
    3. A developer using a weak password that is easily guessed
    4. A developer reused the same password for their cloud account and another online service that was breached, leading to credential theft.
    5. A developer stored their credentials in an unencrypted text file on their local machine, which was compromised by malware.

    Correct Answer: All

    78 people answered this question and they were all right. Let’s find out why.

    We’ve all heard the horror stories: cloud breaches, stolen data, and ransom demands. But sometimes, the weakest link in the security chain isn’t a firewall or a complex vulnerability. It’s the beating heart of innovation itself: the developer. Today, we delve into a chilling scenario where a developer’s code becomes the unwitting accomplice in a cloud heist.

    Imagine this: you’re an SRE or DevOps warrior, patrolling the vast digital landscape of your company’s cloud environment. Suddenly, alarms blare, and your blood runs cold. An unauthorized cryptocurrency mining script has burrowed deep into your precious resources, siphoning off processing power like a digital vampire. Tracing the origin, you discover the culprit: a compromised developer account. How did this happen? Let’s explore the suspects:

    1. The Public Git Gaffe (Our Most Likely Culprit):

    Version control is our friend, a digital safety net for our code. But sometimes, in the rush to push and pull, we accidentally commit things we shouldn’t. Imagine a developer, bleary-eyed after a late-night coding session, accidentally pushing their cloud credentials to a public Git repository. Boom! Their secret sauce is now a public recipe for disaster.

    2. The Phishing Phishing Trip:

    Phishing attacks are like the email equivalent of a pickpocket in a crowded marketplace. A developer, lured by a convincing email or message, clicks on a malicious link, landing on a fake login page. Unaware of the trap, they type in their credentials, handing the keys to the kingdom to the attacker.

    3. The Weak Password Woe:

    We all know the password mantra: strong, unique, and never reused. But sometimes, even the best intentions crumble under the pressure of deadlines. A developer, seeking a quick fix, chooses a weak password like “password123” or reuses the same one they use for their social media accounts. This makes them easy prey for brute-force attacks or credential stuffing.

    4. The Domino Effect of Reuse:

    Imagine a developer who, in a moment of convenience, uses the same password for their cloud account and another online service. If that service gets breached, their cloud credentials become collateral damage, granting the attacker access to your entire cloud fortress.

    5. The Unencrypted Textual Trap:

    Text files are handy, but for sensitive information, they’re like leaving your front door unlocked. A developer, unaware of the risks, stores their cloud credentials in a plain text file on their local machine. This makes them vulnerable to malware that can easily harvest the data and hand it to the bad guys.

    So, which scenario is the most likely culprit in our cloud heist? Statistical analysis of past breaches implies it’s the Git gaffe. In fact, a recent study found that 27% of organizations have experienced cloud breaches due to exposed credentials in Git repositories. This isn’t about pointing fingers or blaming the developer. It’s about understanding the vulnerabilities in our workflows and implementing safeguards. Here are some ways to avoid a Git-based credential heist:

    • Secret management tools: Use dedicated tools to securely store and manage cloud credentials, eliminating the need for developers to store them in code.
    • Code reviews and training: Train developers on secure coding practices and conduct thorough code reviews to catch accidental credential exposure before it’s too late.
    • Two-factor authentication: Implement two-factor authentication for all cloud accounts to add an extra layer of security.

    Remember, security is a shared responsibility. By understanding the risks and implementing best practices, we can transform our developers from unwitting accomplices to security champions, ensuring that our cloud environments remain fortresses, not feeding grounds for digital thieves.

    But just because historically this has been the #1 reason does not mean that it will remain so in the future. All other reasons are also very likely. So what can we do to minimize damage when a credential is leaked – becomes the all important question! Can there be a system that identifies all the changes in a cloud environment and identifies who made the change and why?

    Here’s how such a system that tracks all changes in a cloud environment and who makes them can help reduce the impact of breaches:

    1. Faster Breach Detection and Response:

    • Real-time visibility: By providing a comprehensive view of all changes, including configuration changes, code deployments, and user access modifications, such a system can help security teams quickly identify suspicious activity that might indicate a breach. This enables them to initiate investigation and containment measures sooner, limiting the damage caused by the attack.

    2. Root Cause Analysis and Attack Reconstruction:

    • Detailed audit trails: The system’s ability to track who made specific changes, when they were made, and what those changes entailed provides invaluable information for forensic analysis. Security teams can trace the attacker’s actions, understand their methods, and identify the root cause of the breach. This knowledge can be used to prevent similar attacks in the future and strengthen security measures.

    3. Accountability and Deterrence:

    • Enhanced accountability: Knowing that their actions are being logged and can be traced back to them can act as a deterrent for both malicious actors and well-intentioned users who might inadvertently make risky changes. This promotes a culture of security awareness and responsibility within the organization.

    4. Compliance and Auditing:

    • Regulatory compliance: Many industries have strict compliance requirements regarding change tracking and auditing in cloud environments. Having a system that automatically captures and logs all changes can help organizations meet these compliance obligations and demonstrate their commitment to security best practices.

    5. Faster Recovery and Restoration:

    • Precise rollbacks: In case of a breach, the detailed change history can guide recovery efforts. Security teams can quickly identify and revert malicious changes, restoring the system to a known good state. This can significantly reduce downtime and minimize the impact of the attack on business operations.

    6. Continuous Security Improvement:

    • Data-driven insights: By analyzing historical change data, security teams can identify patterns, trends, and common vulnerabilities that might have led to previous breaches. This information can be used to proactively address security weaknesses, implement preventive measures, and continuously improve the overall security posture of the cloud environment.

    In essence, a change tracking and auditing system acts as a vigilant guardian, providing a detailed record of activities within the cloud environment. This enhanced visibility empowers security teams to act swiftly and decisively in the face of breaches, ultimately protecting the integrity and confidentiality of sensitive data and systems.

  • Kubernetes Troubleshooting in GitOps: Dealing with Unexpected Helm Chart Modifications

    Quiz #17 was:
    You’re working in a GitOps environment where developers use Helm charts to manage Kubernetes deployments. One day, a developer makes a change to a Helm chart to adjust the replica count of a deployment. However, after the change is applied, you notice that the deployment’s pod template has also been unexpectedly modified, leading to errors. Which of the following is the most likely cause of this issue?

    1. Version control conflicts
    2. Incorrect values file usage
    3. Helm version incompatibility
    4. Namespace configuration error
    5. Insufficient RBAC permissions

    Correct Answer: 2) Incorrect values file usage

    99 people answered this question with 27% getting it right.

    Meta Description: Discover how to tackle Helm chart issues in GitOps environments. Learn about common pitfalls and find solutions to keep your Kubernetes deployments error-free.

    Are you managing Kubernetes deployments using GitOps and Helm charts? It’s an excellent approach to maintain infrastructure as code and ensure reproducible deployments. However, like any technology, it comes with its challenges. In this blog post, we’ll explore a scenario and guide you through Kubernetes troubleshooting in GitOps, specifically when unexpected Helm chart modifications occur.

    The Scenario

    Imagine a typical day in your GitOps environment. Developers are busy making changes to Helm charts to fine-tune Kubernetes deployments. One day, a developer makes a seemingly innocent adjustment to a Helm chart—changing the replica count of a deployment. But as you apply the change, something unexpected happens. The deployment’s pod template is also modified, leading to errors and chaos in your cluster.
    The Most Likely Cause
    The culprit in this scenario is often “Incorrect values file usage”. Helm charts rely on values files to customize deployments. When values files are used incorrectly or contain erroneous values, they can inadvertently modify various aspects of your Helm chart, including the pod template.

    How to Tackle It


    1. Review Values Files:

    Start by thoroughly reviewing the values files used in your Helm chart. Ensure that the values provided align with the intended changes. It’s crucial to understand how each value affects your deployment.

    1. Validate Chart Versions:

    Check that you are using the correct Helm chart version. Helm chart versions can evolve, and using an incompatible version may lead to unexpected behavior. Maintaining a well-documented Helm chart repository helps.

    1. Test Changes Locally:
      Before applying changes to your live environment, consider testing them in a development or staging cluster. This allows you to catch issues early and prevent unexpected modifications.

      1. Collaborate with Developers:

      Encourage close collaboration between developers and operations teams. Clear communication about changes and their potential impact is essential. Developers should provide detailed documentation for values files.

      1. Implement Access Controls:

      Utilize Kubernetes Role-Based Access Control (RBAC) to restrict who can make Helm chart modifications and deployments. This helps prevent unauthorized or inadvertent changes.

      Conclusion

      In the world of GitOps and Kubernetes, troubleshooting unexpected Helm chart modifications is a part of the journey. By understanding the most likely causes and following best practices, you can mitigate issues and maintain the integrity of your deployments.

      Remember, Kubernetes troubleshooting in GitOps is not just about fixing problems; it’s about preventing them in the first place. Embrace a proactive approach to ensure that your Kubernetes environment remains error-free and efficient.

      But when things do go wrong, issues like these can be time consuming to debug increasing downtime. In the last quiz we looked at a similar issue where, at times, it is essential to bypass best practices to address an urgent issue. When this happens, and it invariably does, Webb.ai leverages AI to automate troubleshooting to reduce downtime and make SRE and DevOps more productive. Similar to how Github Copilot is automating software development and making developers more productive, Webb.ai is automating troubleshooting to make Ops more productive! The goal should be for the machines to do the repetitive stuff so that we humans can think about the more fun and creative stuff!


      Ready to streamline your GitOps and Kubernetes troubleshooting efforts? Participate in our Early Access Program.

  • Service Upgrade Pods Quiz Results

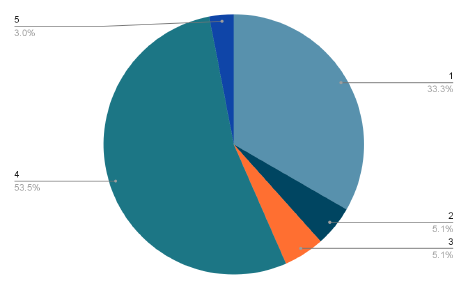
    After a service upgrade the pods are taking too long to serve traffic. What would you need to find out to debug?

    1. The validating webhook for pods has failed
    2. The cluster doesn’t have enough CPU/memory to schedule the pod to a node
    3. The new code added an init container and the init container is taking a long time to finish
    4. The new deployment changed the readiness probe
    5. There is a bug in the code

    100 people answered the question. And their answers are reflected in the chart below.

    Each of the provided choices is indeed a correct answer – meaning 16 people got the right answer. Let’s breakdown each of the choices in the context of troubleshooting slow pod response times after a service upgrade:

    The validating webhook for pods has failed: Validating webhooks in Kubernetes are responsible for ensuring that pods conform to certain policies before being created. If the validating webhook fails, it can prevent pod creation altogether, which would certainly impact the ability of new pods to serve traffic. Therefore, this is a correct choice to consider when debugging service issues.

    The cluster doesn’t have enough CPU/memory to schedule the pod to a node: When a service is upgraded, its resource requirements may change. If the cluster lacks the necessary CPU or memory resources to schedule the new pods, it can lead to delayed pod scheduling and slow response times. This is a common issue that SREs and DevOps need to investigate when traffic-serving problems arise after an upgrade.

    The new code added an init container, and the init container is taking a long time to finish: Init containers are executed before the main application containers in a pod. If a new init container is introduced during an upgrade and it takes an extended time to complete its tasks, it can indeed cause delays in the pod becoming ready to serve traffic. This is a relevant consideration when diagnosing slow response times post-upgrade.

    The new deployment changed the readiness probe: The readiness probe determines when a pod is ready to accept traffic. If the readiness probe is modified during an upgrade and is now misconfigured, it can delay the point at which the pod is considered ready to serve traffic.

    Therefore, this is an accurate choice for troubleshooting slow response times.

    One of our earlier quiz questions dealt with a similar issue which we discussed in the following blog: https://webb.ai/blog/quiz-1-aug-1-23-healthcheck-port-mismatch/

    There is a bug in the code: While the broadest option, it’s also valid. Code bugs can absolutely result in slow response times. However, it’s crucial to note that this choice doesn’t specify what type of bug or where in the code it might be. It highlights the importance of code review and debugging as part of the troubleshooting process.

    In summary, all the provided choices are correct because they represent various potential causes of slow pod response times after a service upgrade. Troubleshooting such issues often requires considering a combination of factors, from resource constraints to configuration changes and code-related problems. SREs and DevOps professionals must approach the problem with a holistic perspective to identify and address the root causes effectively.

    There are additional reasons, not included in the options provided, for slow pod response times after a service upgrade:

    Network Latency/Issues: Connectivity problems, network misconfigurations, or high network latency between pods and services can cause delays in serving traffic.

    Storage Latency: Slow storage I/O or inadequate storage resources can impact data retrieval and processing, affecting pod performance.

    Resource Contentions: Other resource-intensive workloads on the same nodes can lead to resource contentions, resulting in slow pod response times due to competition for CPU, memory, or disk resources.

    Analyzing each potential root cause for each failure is not possible in today’s highly dynamic environments. Leveraging software and the recent advancements in AI to automate root cause analysis is one way to reduce toil and increase productivity allowing SRE and DevOps to become proactive and focus on addressing more complex failure scenarios.

    –

    In a Kubernetes environment, a recent pod scheduling failure occurred due to a specific configuration. Which Kubernetes resource type, often associated with node constraints, might have caused this failure, especially if it wasn’t defined correctly?

    1. A) NodeSelector B) ResourceQuota C) PriorityClass D) Taint E) PodDisruptionBudget

    From an SRE perspective, let’s explain why “Taint” is the right answer in the context of a pod scheduling failure due to a specific configuration, and why the other choices are not as suitable:

    Taint (Correct Answer):

    Taints in Kubernetes are node-level attributes that can be applied to nodes to affect pod scheduling. When a node is tainted, it essentially broadcasts a constraint to pods that they should not be scheduled on that node unless they have a corresponding “toleration.” Here’s why taints are the correct answer:

    Node Constraints: Taints are directly related to node constraints. They allow you to specify criteria that restrict which pods can run on specific nodes based on attributes like hardware, software, or other node characteristics. This makes them a crucial resource for controlling where certain workloads are placed within the cluster.

    Pod Scheduling: When taints are applied to nodes and pods do not have matching tolerations, they will not be scheduled on those tainted nodes. If a pod is failing to schedule due to a node constraint issue, it’s likely because of taints.

    NodeSelector (Not the Best Choice):

    NodeSelector is a Kubernetes feature that allows you to set node affinity for your pods based on labels assigned to nodes. While it does influence pod scheduling, it is not primarily associated with node constraints set at the node level like taints.

    Node Affinity: NodeSelector is more about node affinity (i.e., preferring nodes with certain labels) rather than constraints. It doesn’t directly prevent pod scheduling but rather guides the scheduler’s preference.

    ResourceQuota (Not Related to Node Constraints):

    ResourceQuotas are Kubernetes objects that limit resource consumption (CPU, memory, etc.) within namespaces. They do not directly influence pod scheduling based on node constraints, making them less relevant to the given scenario.

    Resource Limitation: ResourceQuotas control resource usage within namespaces, but they do not define node-specific constraints or affect where pods can be scheduled within the cluster.

    PriorityClass (Not Related to Node Constraints):

    PriorityClasses are used to prioritize pods in scheduling order, but they do not define node constraints like taints. They affect the order in which pods are scheduled but do not directly relate to why a pod may fail to schedule due to node-specific constraints.

    Scheduling Priority: PriorityClasses are about setting scheduling priorities, not specifying where pods can or cannot run based on node characteristics.

    PodDisruptionBudget (Not Related to Node Constraints):

    PodDisruptionBudgets are used to control the disruption of pods during voluntary disruptions (e.g., draining a node). They are not associated with node constraints or pod scheduling based on node attributes.

    Disruption Control: PodDisruptionBudgets are for controlling disruptions during node maintenance or other planned events, but they do not deal with node constraints affecting pod scheduling.

    In summary, when debugging a pod scheduling failure due to a specific configuration, especially one related to node constraints, “Taint” is the most appropriate answer because taints directly influence pod scheduling based on node attributes, whereas the other options are not primarily associated with this aspect of Kubernetes resource management.

  • Container Image Tags

    In a Kubernetes environment, you encounter a situation where a service’s configuration is not consistent across multiple clusters. What common configuration element could be the source of this issue?

    1. Pod resource requests and limits
    2. Container image tags
    3. Ingress controller settings
    4. Service account permissions
    5. Node affinity rules

    Correct Answer: 2) Container image tags

    154 people answered this question with 20% getting it right.

    In a Kubernetes environment, maintaining consistency across multiple clusters is a vital component of reliable and efficient operations. When you encounter a situation where a service’s configuration is not uniform across these clusters, identifying the root cause is key. In this blog post, we’ll delve into the common configuration element that could be the source of this issue and explain how to address it.

    The Role of Configuration Consistency

    Consistency in configuration ensures that your applications behave predictably and reliably in any Kubernetes cluster, regardless of its location or characteristics. It simplifies management, monitoring, and scaling while reducing the likelihood of unexpected issues. When configuration discrepancies arise, they can result in erratic behavior and operational headaches.

    Container Image Tags: The Likely Culprit

    Container image tags (Answer 2) are a common source of configuration discrepancies. Image tags specify the version or specific build of a container image to use. They serve as a fundamental element in the deployment of applications in Kubernetes. When different clusters reference different image tags, it can lead to several issues:

    1. Version Mismatch: Each image tag represents a specific version of the application. If clusters use different tags, they might run different versions of the application, leading to inconsistent behavior.
    2. Security Concerns: Different image tags may have varying security vulnerabilities or updates, exposing your clusters to potential risks.
    3. Operational Complexity: Managing different image tags across clusters increases operational complexity, making it challenging to roll out updates and troubleshoot problems.

    Addressing the Issue: Container Image Tags

    Let’s explore how you can ensure consistency by addressing the container image tag issue. Below are some code samples and steps for clarification:

    Step 1: Define a Consistent Image Tag

     To achieve consistency, define a consistent image tag for your application across all clusters. This tag should represent the desired version of your application. For example, if you’re using a Docker image, here’s how you specify the image tag in your Kubernetes Deployment:

    Unset
    apiVersion: apps/v1 kind: Deployment
    metadata:
    name: my-app spec:
    template:
    spec:
    containers:
    - name: my-app-container
    image: my-app:v1.0.0 # Use a specific version tag

    Step 2: Automate Image Tag Updates

    To avoid manual updates and ensure that your clusters are always using the correct image tag, consider automation. You can utilize Continuous Integration/Continuous Deployment (CI/CD) pipelines to automate the image build and deployment process. In your CI/CD script, you can set the image tag dynamically based on your application version:

    Unset
    # Example CI/CD bash script APP_VERSION="1.0.0" # Your application version IMAGE_TAG="my-app:$APP_VERSION"
    docker build -t $IMAGE_TAG . docker push $IMAGE_TAG

    Step 3: Implement a Release Strategy

     Use a consistent release strategy that defines when and how new versions of your application are deployed to different clusters. For example, you can use rolling updates to minimize disruption during deployments. Here is an example of a yaml:

    Unset
    apiVersion: apps/v1 kind: Deployment
    metadata:
    name: my-app spec:
    strategy:
    type: RollingUpdate rollingUpdate:
    maxSurge: 25%
    maxUnavailable: 25% template:
    spec:
    containers:
    - name: my-app-container
    image: my-app:v1.0.0 # Consistent image tag

    By adhering to these best practices, you can ensure that your Kubernetes clusters remain consistent in terms of container image tags, preventing configuration discrepancies and promoting stability.

    Conclusion

    In the intricate world of Kubernetes, maintaining consistency is paramount. When a service’s configuration varies across multiple clusters, it’s often the container image tags that are the culprits. By establishing a consistent image tagging strategy, automating updates, and implementing a release strategy, you can ensure that your clusters operate smoothly and predictably, regardless of their location or size. This consistency ultimately paves the way for efficient management and scaling, reducing the likelihood of unexpected issues and contributing to the reliability of your Kubernetes environment.

    But there are always exceptions. And when there is a difference in config across clusters use Webb.ai to identify the difference(s). Make Webb.ai part of your runbooks.

  • RBAC

    While troubleshooting a production issue in your Kubernetes cluster, you notice that a critical application pod is repeatedly crashing. In the pod’s logs, you see an error message indicating “Permission Denied.” After further investigation, you discover that the issue is related to security authorization. What could be a likely cause of this problem?

    Correct Answer: 4) Modifying RBAC (Role-Based Access Control) rules

    99 people answered this question with 54% getting it right.

    In the realm of Site Reliability Engineering (SRE) and DevOps, maintaining a robust and secure Kubernetes cluster is crucial. When your production environment faces an issue like a critical application pod repeatedly crashing, it can be an alarming situation, particularly when the logs reveal a daunting “Permission Denied” error message. In this blog article, we’ll explore how proper Role-Based Access Control (RBAC) can address this issue and ensure a stable and secure environment.


    The “Permission Denied” Dilemma

    When you encounter the dreaded “Permission Denied” error in your pod’s logs, it’s essential to recognize that this error is often related to authorization and access control issues. Kubernetes relies on RBAC to manage these aspects, which is similar to user roles in an operating system but tailored for the unique requirements of containerized environments.


    The Importance of RBAC

    RBAC, in Kubernetes, allows you to define who (or which entities) can perform operations on cluster resources and what operations they can perform. These entities could be service accounts, users, or groups. Proper RBAC ensures that only authorized entities can access specific resources, limiting potential vulnerabilities and unauthorized access.


    Identifying the Cause

    The first step in addressing the “Permission Denied” issue is identifying the root cause. The error message typically appears when a pod lacks the necessary permissions to access a resource. This can include accessing the file system, interacting with another service, or making changes to a cluster configuration.


    Role-Based Access Control (RBAC)

    In the context of Kubernetes, RBAC is the primary mechanism for controlling authorization and access to resources. Roles and RoleBindings are used to define what actions a user, group, or service account can perform within a specific namespace.

    ClusterRoles and ClusterRoleBindings extend this to control access across namespaces within the entire cluster.


    Modifying RBAC Rules

    Once you’ve identified the issue as an RBAC problem, the next step is to modify the RBAC rules to rectify the situation. This process can include several actions:

    • Role Adjustment: Review the role associated with the pod’s service account.
    • Ensure it grants the necessary permissions for the actions the pod needs to perform. You may need to add or adjust permissions in the role to allow the pod to function correctly.
    • RoleBindings: Check the RoleBindings to ensure that the service account associated with the crashing pod is correctly bound to the role. If it isn’t, the service account won’t inherit the permissions defined in the role.
    • ClusterRole Modifications: In some cases, you may need to modify ClusterRoles for broader permissions across namespaces or cluster-wide resources. However, exercise caution when changing ClusterRoles, as this can impact the security of your entire cluster.
    • Resource Verification: Double-check that the “Permission Denied” issue relates to RBAC. Sometimes, other factors like file system permissions may be at play.
    • Ensure that you’re addressing the correct problem.

    Common Mistakes to Avoid

    When dealing with RBAC, it’s vital to avoid common mistakes that can lead to security vulnerabilities or disrupt your cluster’s operation:

    • Overly Permissive Roles: Granting excessive permissions through RBAC rules can introduce security risks. Ensure roles are appropriately scoped to limit access to only what’s necessary.
    • Neglecting to Review RBAC: RBAC is not a one-time setup. As your applications evolve, so do their requirements for permissions. Regularly review and update RBAC rules to ensure they align with your application’s needs.
    • Lacking RBAC Auditing: Monitoring and auditing RBAC is critical to identifying suspicious or unauthorized activities. Implement robust RBAC auditing tools to track access and changes.

    Conclusion

    In the world of SRE and DevOps, addressing “Permission Denied” errors in Kubernetes is a common challenge. By understanding the importance of Role-Based Access Control

    (RBAC) and how to modify RBAC rules effectively, you can resolve these issues,

    ensuring the stability and security of your cluster. Properly managing RBAC not only solves immediate problems but also contributes to a more secure and resilient production environment, which is essential for effective demand generation and business continuity.

  • Post service upgrade pods are taking too long to serve traffic – Answers

    After a service upgrade the pods are taking too long to serve traffic. What would you need to find out to debug?
    1. The validating webhook for pods has failed
    2. The cluster doesn’t have enough CPU/memory to schedule the pod to a node
    3. The new code added an init container and the init container is taking a long time to finish
    4. The new deployment changed the readiness probe
    5. There is a bug in the code

    100 people answered the question. And their answers are reflected in the chart below.

    Each of the provided choices is indeed a correct answer – meaning 16 people got the right answer. Let’s breakdown each of the choices in the context of troubleshooting slow pod response times after a service upgrade:

    The validating webhook for pods has failed: Validating webhooks in Kubernetes are responsible for ensuring that pods conform to certain policies before being created. If the validating webhook fails, it can prevent pod creation altogether, which would certainly impact the ability of new pods to serve traffic. Therefore, this is a correct choice to consider when debugging service issues.

    The cluster doesn’t have enough CPU/memory to schedule the pod to a node: When a service is upgraded, its resource requirements may change. If the cluster lacks the necessary CPU or memory resources to schedule the new pods, it can lead to delayed pod scheduling and slow response times. This is a common issue that SREs and DevOps need to investigate when traffic-serving problems arise after an upgrade.

    The new code added an init container, and the init container is taking a long time to finish: Init containers are executed before the main application containers in a pod. If a new init container is introduced during an upgrade and it takes an extended time to complete its tasks, it can indeed cause delays in the pod becoming ready to serve traffic. This is a relevant consideration when diagnosing slow response times post-upgrade.

    The new deployment changed the readiness probe: The readiness probe determines when a pod is ready to accept traffic. If the readiness probe is modified during an upgrade and is now misconfigured, it can delay the point at which the pod is considered ready to serve traffic.

    Therefore, this is an accurate choice for troubleshooting slow response times.

    One of our earlier quiz questions dealt with a similar issue which we discussed in the following blog: https://webb.ai/blog/quiz-1-aug-1-23-healthcheck-port-mismatch/

    There is a bug in the code: While the broadest option, it’s also valid. Code bugs can absolutely result in slow response times. However, it’s crucial to note that this choice doesn’t specify what type of bug or where in the code it might be. It highlights the importance of code review and debugging as part of the troubleshooting process.

    In summary, all the provided choices are correct because they represent various potential causes of slow pod response times after a service upgrade. Troubleshooting such issues often requires considering a combination of factors, from resource constraints to configuration changes and code-related problems. SREs and DevOps professionals must approach the problem with a holistic perspective to identify and address the root causes effectively.

    There are additional reasons, not included in the options provided, for slow pod response times after a service upgrade:

    Network Latency/Issues: Connectivity problems, network misconfigurations, or high network latency between pods and services can cause delays in serving traffic.

    Storage Latency: Slow storage I/O or inadequate storage resources can impact data retrieval and processing, affecting pod performance.

    Resource Contentions: Other resource-intensive workloads on the same nodes can lead to resource contentions, resulting in slow pod response times due to competition for CPU, memory, or disk resources.

    Analyzing each potential root cause for each failure is not possible in today’s highly dynamic environments. Leveraging software and the recent advancements in AI to automate root cause analysis is one way to reduce toil and increase productivity allowing SRE and DevOps to become proactive and focus on addressing more complex failure scenarios.

    –

    In a Kubernetes environment, a recent pod scheduling failure occurred due to a specific configuration. Which Kubernetes resource type, often associated with node constraints, might have caused this failure, especially if it wasn’t defined correctly?

    1. A) NodeSelector B) ResourceQuota C) PriorityClass D) Taint E) PodDisruptionBudget

    From an SRE perspective, let’s explain why “Taint” is the right answer in the context of a pod scheduling failure due to a specific configuration, and why the other choices are not as suitable:

    Taint (Correct Answer):

    Taints in Kubernetes are node-level attributes that can be applied to nodes to affect pod scheduling. When a node is tainted, it essentially broadcasts a constraint to pods that they should not be scheduled on that node unless they have a corresponding “toleration.” Here’s why taints are the correct answer:

    Node Constraints: Taints are directly related to node constraints. They allow you to specify criteria that restrict which pods can run on specific nodes based on attributes like hardware, software, or other node characteristics. This makes them a crucial resource for controlling where certain workloads are placed within the cluster.

    Pod Scheduling: When taints are applied to nodes and pods do not have matching tolerations, they will not be scheduled on those tainted nodes. If a pod is failing to schedule due to a node constraint issue, it’s likely because of taints.

    NodeSelector (Not the Best Choice):

    NodeSelector is a Kubernetes feature that allows you to set node affinity for your pods based on labels assigned to nodes. While it does influence pod scheduling, it is not primarily associated with node constraints set at the node level like taints.

    Node Affinity: NodeSelector is more about node affinity (i.e., preferring nodes with certain labels) rather than constraints. It doesn’t directly prevent pod scheduling but rather guides the scheduler’s preference.

    ResourceQuota (Not Related to Node Constraints):

    ResourceQuotas are Kubernetes objects that limit resource consumption (CPU, memory, etc.) within namespaces. They do not directly influence pod scheduling based on node constraints, making them less relevant to the given scenario.

    Resource Limitation: ResourceQuotas control resource usage within namespaces, but they do not define node-specific constraints or affect where pods can be scheduled within the cluster.

    PriorityClass (Not Related to Node Constraints):

    PriorityClasses are used to prioritize pods in scheduling order, but they do not define node constraints like taints. They affect the order in which pods are scheduled but do not directly relate to why a pod may fail to schedule due to node-specific constraints.

    Scheduling Priority: PriorityClasses are about setting scheduling priorities, not specifying where pods can or cannot run based on node characteristics.

    PodDisruptionBudget (Not Related to Node Constraints):

    PodDisruptionBudgets are used to control the disruption of pods during voluntary disruptions (e.g., draining a node). They are not associated with node constraints or pod scheduling based on node attributes.

    Disruption Control: PodDisruptionBudgets are for controlling disruptions during node maintenance or other planned events, but they do not deal with node constraints affecting pod scheduling.

    In summary, when debugging a pod scheduling failure due to a specific configuration, especially one related to node constraints, “Taint” is the most appropriate answer because taints directly influence pod scheduling based on node attributes, whereas the other options are not primarily associated with this aspect of Kubernetes resource management.

  • Elevated Resource Levels

    Elevated Resource Levels

    A microservice in your Kubernetes cluster has been exhibiting intermittent performance degradation after a recent code change. What could be potential root causes of this issue? (Select two correct answers)

    1. Incorrect Prometheus alerting rules
    2. Elevated resource limits for the microservice pods
    3. Inadequate PodDisruptionBudget configurations
    4. CPU and memory pressure on worker nodes
    5. A misconfigured HorizontalPodAutoscaler (HPA)

    Such an issue is challenging to debug with observability tools alone and requires a deeper understanding of the Kubernetes infrastructure. 123 people answered this question with 24% getting it right.

    Here’s a detailed explanation.

    Correct Answers:
    2. Elevated resource limits for the microservice pods:
    When dealing with intermittent performance degradation of a microservice in a Kubernetes cluster, elevated resource limits for the microservice pods can be a significant root cause. Resource limits for pods are defined in their YAML configurations using the resources field. This issue can lead to resource contention, causing performance bottlenecks.

    4. CPU and memory pressure on worker nodes:
    Worker nodes in a Kubernetes cluster can experience CPU and memory pressure when resource demands from pods exceed the available capacity. This can lead to performance degradation for all workloads running on the affected nodes. SREs and DevOps need to monitor node resource utilization and take corrective actions.

    If high resource usage is detected, it may be necessary to scale the cluster by adding more nodes, tune resource requests and limits for pods, or optimize applications to use resources more efficiently.

    Incorrect Answers:
    1. Incorrect Prometheus alerting rules:
    Prometheus is a powerful monitoring and alerting system used in Kubernetes, but issues with alerting rules are unlikely to directly cause intermittent performance degradation in a microservice. While it is crucial to have correct alerting rules set up to detect issues, issues with alerts are typically associated with visibility and observability, not the root cause of performance degradation.

    3. Inadequate PodDisruptionBudget configurations:
    PodDisruptionBudgets (PDBs) are used to control the disruption of pods during maintenance or updates. While they are essential for ensuring high availability, they are not directly related to performance degradation. Inadequate PDB configurations may lead to pod disruptions during updates, but this would result in unavailability rather than intermittent performance issues.

    5. A misconfigured HorizontalPodAutoscaler (HPA):
    A misconfigured HPA could potentially lead to over-scaling or under-scaling of pods, but it’s unlikely to be the root cause of intermittent performance degradation. HPAs primarily deal with pod scaling based on resource utilization, and their misconfiguration would affect scalability rather than performance degradation.

    In summary, when dealing with intermittent performance degradation in a microservice within a Kubernetes cluster, SREs and DevOps should focus on resource allocation (resource limits) for pods and monitoring node resource usage. Elevated resource limits for pods and CPU/memory pressure on worker nodes can directly impact performance. While observability and alerting (Prometheus) are essential for detecting issues, they are not typically the root cause of performance problems. Similarly, PDBs and HPAs are more related to availability and scaling but do not directly address performance degradation issues.

  • Intermittent Microservice Problem

    Intermittent Microservice Problem

    In a Kubernetes environment, a recent pod scheduling failure occurred due to a specific configuration. Which Kubernetes resource type, often associated with node constraints, might have caused this failure, especially if it wasn’t defined correctly?

    1. NodeSelector
    2. ResourceQuota
    3. PriorityClass
    4. Taint
    5. PodDisruptionBudget

    201 people answered the question. And their answers are reflected in the chart below.

    The wording of this question is deliberately tricky, especially the part about “often associated with node constraints”. The correct answer, therefore, is “Taint”. 46 people, 23% got it right. A very close, very likely, answer is “NodeSelector” but one that is not a “node constraint”. An additional 54,  28%, picked this option. Let’s discuss why “Taint” is the right answer in the context of a pod scheduling failure due to a specific configuration, and why the other choices are not as suitable.

    Taint (Correct Answer):

    Taints in Kubernetes are node-level attributes that can be applied to nodes to affect pod scheduling. When a node is tainted, it essentially broadcasts a constraint to pods that they should not be scheduled on that node unless they have a corresponding “toleration.” Here’s why taints are the correct answer:

    Node Constraints: Taints are directly related to node constraints. They allow you to specify criteria that restrict which pods can run on specific nodes based on attributes like hardware, software, or other node characteristics. This makes them a crucial resource for controlling where certain workloads are placed within the cluster.

    Pod Scheduling: When taints are applied to nodes and pods do not have matching tolerations, they will not be scheduled on those tainted nodes. If a pod is failing to schedule due to a node constraint issue, it’s likely because of taints.

    NodeSelector (Not the Best Choice):

    NodeSelector is a Kubernetes feature that allows you to set node affinity for your pods based on labels assigned to nodes. While it does influence pod scheduling, it is not primarily associated with node constraints set at the node level like taints.

    Node Affinity: NodeSelector is more about node affinity (i.e., preferring nodes with certain labels) rather than constraints. It doesn’t directly prevent pod scheduling but rather guides the scheduler’s preference.

    ResourceQuota (Not Related to Node Constraints):

    ResourceQuotas are Kubernetes objects that limit resource consumption (CPU, memory, etc.) within namespaces. They do not directly influence pod scheduling based on node constraints, making them less relevant to the given scenario.

    Resource Limitation: ResourceQuotas control resource usage within namespaces, but they do not define node-specific constraints or affect where pods can be scheduled within the cluster.

    PriorityClass (Not Related to Node Constraints): PriorityClasses are used to prioritize pods in scheduling order, but they do not define node constraints like taints. They affect the order in which pods are scheduled but do not directly relate to why a pod may fail to schedule due to node-specific constraints.

    Scheduling Priority: PriorityClasses are about setting scheduling priorities, not specifying where pods can or cannot run based on node characteristics.

    PodDisruptionBudget (Not Related to Node Constraints):

    PodDisruptionBudgets are used to control the disruption of pods during voluntary disruptions (e.g., draining a node). They are not associated with node constraints or pod scheduling based on node attributes.

    Disruption Control: PodDisruptionBudgets are for controlling disruptions during node maintenance or other planned events, but they do not deal with node constraints affecting pod scheduling.

    In summary, when debugging a pod scheduling failure due to a specific configuration, especially one related to node constraints, “Taint” is the most appropriate answer because taints directly influence pod scheduling based on node attributes, whereas the other options are not primarily associated with this aspect of Kubernetes resource management.

    DevOps/SRE run into these scenarios all the time. Troubleshooting these scenarios by analyzing each of the above options is time consuming. Coupled with the frequency of their occurrence makes debugging such failures prohibitively expensive unless there is an escalation and this prevents DevOps/SRE to be proactive. It’s the classical example of technical debt on which we never land up making a down payment. The usual answer is “hire more people”. Do you agree with this or have you found a way out of this dilemma? Please send us your thoughts to TheNeoQuiz@webb.ai.


  • Post service upgrade pods are taking too long to serve traffic

    Post service upgrade pods are taking too long to serve traffic

    After a service upgrade the pods are taking too long to serve traffic. What would you need to find out to debug?
    1. The validating webhook for pods has failed
    2. The cluster doesn’t have enough CPU/memory to schedule the pod to a node
    3. The new code added an init container and the init container is taking a long time to finish
    4. The new deployment changed the readiness probe
    5. There is a bug in the code

    Let’s break down why each of the provided choices is indeed a correct answer in the context of troubleshooting slow pod response times after a service upgrade:

    The validating webhook for pods has failed: Validating webhooks in Kubernetes are responsible for ensuring that pods conform to certain policies before being created. If the validating webhook fails, it can prevent pod creation altogether, which would certainly impact the ability of new pods to serve traffic. Therefore, this is a correct choice to consider when debugging service issues.

    The cluster doesn’t have enough CPU/memory to schedule the pod to a node: When a service is upgraded, its resource requirements may change. If the cluster lacks the necessary CPU or memory resources to schedule the new pods, it can lead to delayed pod scheduling and slow response times. This is a common issue that SREs and DevOps need to investigate when traffic-serving problems arise after an upgrade.

    The new code added an init container, and the init container is taking a long time to finish: Init containers are executed before the main application containers in a pod. If a new init container is introduced during an upgrade and it takes an extended time to complete its tasks, it can indeed cause delays in the pod becoming ready to serve traffic. This is a relevant consideration when diagnosing slow response times post-upgrade.

    The new deployment changed the readiness probe: The readiness probe determines when a pod is ready to accept traffic. If the readiness probe is modified during an upgrade and is now misconfigured, it can delay the point at which the pod is considered ready to serve traffic.
    Therefore, this is an accurate choice for troubleshooting slow response times.
    One of our earlier quiz questions dealt with a similar issue which we discussed in the following blog: https://webb.ai/blog/quiz-1-aug-1-23-healthcheck-port-mismatch/

    There is a bug in the code: While the broadest option, it’s also valid. Code bugs can absolutely result in slow response times. However, it’s crucial to note that this choice doesn’t specify what type of bug or where in the code it might be. It highlights the importance of code review and debugging as part of the troubleshooting process.

    In summary, all the provided choices are correct because they represent various potential causes of slow pod response times after a service upgrade. Troubleshooting such issues often requires considering a combination of factors, from resource constraints to configuration changes and code-related problems. SREs and DevOps professionals must approach the problem with a holistic perspective to identify and address the root causes effectively.

    There are additional reasons, not included in the options provided, for slow pod response times after a service upgrade:
    Network Latency/Issues: Connectivity problems, network misconfigurations, or high network latency between pods and services can cause delays in serving traffic.
    Storage Latency: Slow storage I/O or inadequate storage resources can impact data retrieval and processing, affecting pod performance.
    Resource Contentions: Other resource-intensive workloads on the same nodes can lead to resource contentions, resulting in slow pod response times due to competition for CPU, memory, or disk resources.

    Analyzing each potential root cause for each failure is not possible in today’s highly dynamic environments. Leveraging software and the recent advancements in AI to automate root cause analysis is one way to reduce toil and increase productivity allowing SRE and DevOps to become proactive and focus on addressing more complex failure scenarios.