
Author: payal_chakravarty

  • The DevOps Scorecard

    The DevOps Scorecard

    Mid-last year our team switched from doing Agile to doing DevOps. As we forayed into the journey trying to learn about DevOps and practice it at the same time,  a lot of questions arose in the team.  How was this different from agile and most importantly How were we going to be successful?

    That’s when we wrote down what would be the success criteria for our team: “Ship code frequently without causing a customer outage“.

    As the team matured we started evaluating a more granular way to track success.  Could the team mantra be broken down into quantifiable success metrics that could be represented in a scorecard? Based on our experience the DevOps scorecard should contain these 9 metrics to track DevOps team success:
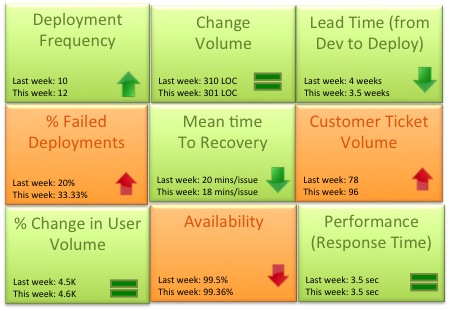
    DevOps Scorecrd

    1. Deployment frequency: How often were we deploying code and getting new code in the hands of our customers? This metric should trend up or remain stable from week to week. Example: Twice a week, 50 times a day
    2. Change volume: For each deployment how many user stories and new lines of code were we shipping?  Example: 3 new features per day, Average 500 lines of new code per week. Another parameter to consider in addition to volume is complexity of change.
    3. Lead Time (from Dev to Deploy): How long does it take on an average to get the code from development complete through a cycle of A/B testing to 100% deploy and upgrade on production? Lead time should reduce as the team gets a better hold of the lifecycle.
    4. Percentage of failed deployments: What percentage of deployments failed causing an outage or a negative user reaction? This metric should decrease over time. Example: 9% deployments failed this month as opposed to 15% last month. This metric should be reviewed in combination with the change volume. If the change volume is low or remained the same but the percent of failed deployments increased, then there maybe a disfunction somewhere.
    5. Mean time to recovery: When we did fail, how long did it take us to recover? This is a true indicator of how good we are getting with handling change and this should ideally reduce over time.  You can expect some spikes in this number due to complex issues not encountered before. Example: On an average it took the team 15 minutes to resolve each last week, 14 minutes this week.
    6. Customer Ticket Volume: Number of alerts generated by customers to indicate issues in the service. This is a basic indicator of customer satisfaction. Example: 54 tickets were generated this week as opposed to 38 while the user volume remained steady is not a good thing
    7. % Change in User Volume: Number of new users signing up, interacting with my service and generating traffic. As new users sign up is my infrastructure able to handle the demand? Example: This week the number of customers spiked by 30% due to an external event causing volume of requests to go up
    8. Availability: What is the overall uptime for my service and did I violate any SLAs? Example: 99.9% uptime consistently for the last 3 months even with change in user volume
    9. Performance (Response Time): Is my service performing within my predetermined thresholds? This metric should remain stable irrespective of % change in user volume or any new deployment. Example: Sub 5 second response time from all geographies and devices

    Would love to hear thoughts on what other critical metrics DevOps teams are using

  • 5 ways APM can solve your DevOps worries

    5 ways APM can solve your DevOps worries

    This week at the InterOp conference in New York I had the chance to talk to a lot of IT managers transforming their organizations to adopt a DevOps culture. One of the key questions I heard repeatedly was – are there some best practices to break down the wall between Dev and Ops?  How do you get to a point where we can deploy code multiple times a day like Facebook , Amazon and Netflix without impacting our users’ experience ? How do we minimize the risk of deployment failures and the blame game that ensues? With the need to innovate and close the customer feedback loop quickly Ops is being asked to deploy code more rapidly than ever before.  The complexity of hundreds of developers updating code makes it a very sensitive environment. The last thing Operations wants is an outage leading to financial loss and the last thing development wants is to get a call in the middle of the night to figure out what code change caused it.

    To have tight control over this fast paced environment we need Application Performance Management at every step. APM can help break down the Chinese wall between Dev and Ops and eliminate the finger pointing that happens during outages. Here are 5 APM best practices to enable a smooth DevOps working environment

    1. Use the same APM tool in Dev and Ops: APM should not be an afterthought , should not be a tool that only Operations looks at to monitor apps. APM is essential in every step along the way , from dev/test to staging to production. As a part of test deployment, developers should use the same APM tool as Ops to see the impact of the code deployment on the application’s performance and catch issues before hand. With the same tool everyone is on the same page and there is less confusion on the metrics being tracked. Developers can’t say “Sorry Ops, we are not seeing the problem”
    2. Isolate and fix performance problems sooner with Code Level Diagnostics:  Today’s APM tools come equipped with deep diagnostics that lets you drill down to the line of code that may be causing a performance slowdown. When code deployed in the Test or Staging environment results in a response time spike, developers can use deep dive code diagnostics to detect the line of code, the SQL query, the method call that may have caused the spike and fix the problem before it is deployed on production. For example, you can detect that a SQL query is taking way longer than it did last week for a specific mobile device platform.
    3. Detect changes with Deployment Detection: When new version of code is deployed in production, the change should be detected automatically without having to reconfigure the APM tool.
    4. Analyze Pre and Post Deployment Performance Trends: Get before and after snapshots of the end to end transactions from your APM tool and compare performance trends over time. With topological visualizations you can, at a glance, see if any particular business transaction slowed down post deployment. With historical data you can see how the application’s performance and resource consumption is evolving over time. This will help fine tune your apps’ resources as well. For example you can determine whether an AJAX call has been slowing down over the last 2 weeks due to the slow down of a third party API call or because a disk consumption is increasing over time.
    5. Automate actions on failures: Configure your APM tool to take actions on failures. For example configure an action to automatically increase memory if a memory spike alert is generated post-deployment while you take the time to diagnose the root cause.

    Using APM let your developers focus on writing code rather than spend time fighting deployment catastrophes and enable a healthy collaborative working environment between Dev and Ops.