Author: Kristian Nelson

  • Infrastructure-Testing Dominoes

    Infrastructure-Testing Dominoes

    Understanding the artifacts of a given technology component is critical to an enterprise-class DevOps service offering. Second-most critical is understanding the dependencies between given components. Testing helps illuminate those dependencies.

    For example, let’s assume I have a server running the previous version of the Windows operating system (OS) that I now want to upgrade to the latest version. The previous deployment package of this version of the OS would be an artifact. It should also include all of the test automation I run to validate that version of the OS is working after I install it. The artifact also might include configuration files I deploy when I install that version of the OS on this type of server in this class of environment. Having these bits of automation bundled together allows me to do a successful install of my OS (assuming no hardware errors) on perhaps many servers.

    As I create a new artifact for the latest Windows OS, I keep in mind all the things I had in my last version. I might include a newer config file and perhaps a set of tests (albeit new ones) to make sure it is working when I am done. Bundling all these bits gives me a new Windows OS artifact or package that I can use over and over on this kind of server in this class of environment. The idea is that I am creating a single kind of artifact or package to cover this kind of technology—in this case the latest version of the Windows OS operating system. All my artifacts should be version-controlled. So when I’m done I have an artifact for the previous Windows OS and one for the latest version. Each artifact version has embedded or included testing (pointers to, or discreet automation) to verify the validity of the install, and perhaps a little more to prove the OS works.

    Within my DevOps tooling, I likely have some sort of artifact management system. It may not be as formal as a full-on configuration management database (CMDB) system, but whichever tool I use will have some sort of database to manage my artifacts or packages by version. How long I retain these artifacts will be defined in my retention policies, but likely I will retain every version in use at my company today. This is step one, and it forms the foundation for my next effort in cataloging the dependencies that exist between artifacts.

    Enter the Spider’s Web

    Under the scenario I have described, when I deploy either the previous OS or the latest one, I would run a series of tests specific to that version to ensure the OS is working properly. As an infrastructure engineer, I tend to think my job is done at this point. But it isn’t. To truly validate that my OS is working, I really need to know what is running on the server I just deployed to. If my server was bare or new, then I am really done. But if my server has middleware running on it, then the job is not finished until I re-deploy the right version of the middleware on top of my new OS and verify it is still working properly.

    To pull this off, I will need a catalog of the technologies that depend on each other. The OS example is kind of simple, because it lives at the bottom of the stack where a server is concerned. But on top of the OS might reside a middleware platform (perhaps messaging or a database). On top of the middleware might reside an application or perhaps several applications, depending on the horsepower of the server in question. Upgrading the OS component implies I am redeploying the middleware layer and then the application layer on top of that.

    Enter full-stack engineering. It takes an application-centric view of the world, but this implies a single application-centric view. It looks at one app from top to bottom and treats the entire stack as a single version-controlled artifact. But if you have legacy environments that run multiple applications on the same physical box, perhaps on the same virtual instance, you have the makings of a spider web of dependencies. There are no full-stack solutions (to my knowledge) that have figured out how to incorporate multiple applications at the top of the same stack, varying middleware in the middle and “n” number of virtual instances that ride on one OS on one physical box. Instead, each piece of the technology tends to be treated separately. Thus the need for some sort of catalog that tracks the interdependencies between them all.

    Starting the Domino Testing

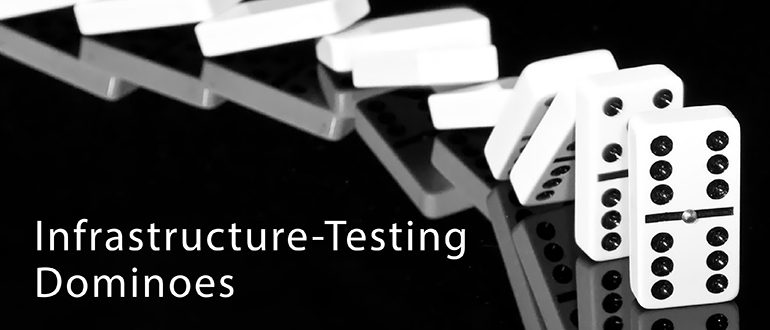
    So once I have discreet testing that is version-controlled (or associated with) each type of technology component, I will have to re-execute those tests if anything “under” me undergoes a change. For example, if the version of my WebSphere is upgraded, beyond just the core WebSphere testing that occurs, I really should execute the tests associated with each application to ensure “that app” is still working after the upgrade. You could apply this premise to a database layer (say, upgrading the current version of Oracle, as an example). To really know if the database upgrade was successful, you should run the testing of each dependent app and ensure “that app” still works after the upgrade. The results are likely to be surprising.

    To execute this kind of domino testing, even if you have the web of dependencies defined and the artifacts or packages managed, you can take one of two approaches: redeploy everything, although this method may not actually kick off tests if it detects the versions did not change from the last deployment (smart overwrite), or set up discreet testing jobs within your release orchestration software to execute the entire web of dependencies and track the results. In either case, you are going to need human oversight on whether it is better to keep the new version or roll back to the old one. Only a human can prioritize the impact of what might seem small or catastrophic (based on a human perspective) of a given app or series of apps.

    Impact to the Bottom Line

    True quality can be assessed only through testing. Part of breaking down silo-thinking is taking a holistic view of the technology your organization supports. Just because the OS support engineer’s testing passes does not mean the upgrade was a success. For an upgrade to be a success, the tests of everyone else who relies on that technology underpinning must pass to prove it worked. The entire team needs validation when the underlying infrastructure undergoes change. The dominoes of tests must pass from end to end. Only then can true quality or true success be measured.

    Of course, most engineers are reluctant to have “app software” guys influence whether they did their own jobs right. After all, most software quality problems are in the code, not due to infrastructure errors. However, if the applications upon which your business relies cannot work, no matter what the reason, after an infrastructure upgrade, it is a problem for the entire business, not just the software guys. To tear down the silos, we need to look at impacting events for change across boundaries and drive toward overall results, not just departmental ones. When this occurs, the cost of quality is significantly reduced.

    To continue the conversation, feel free to contact me.
  • Dashboards from Hell

    Dashboards from Hell

    Even organizations with a mature DevOps services model inevitably will hear from executive sponsors about the “need” for a dashboard for DevOps information. Organizations just starting to embrace DevOps won’t have the time to construct one yet, but over time will reach the same conclusion. The need is real, and the value is significant—it is how you get there that makes the difference. Vendors are keen to promote the idea that they already have a dashboard built into their respective products. And this is partially true.

    But the problem with dashboards is not a matter of information, it is a matter of perspective and scope. Ultimately, all of the information an audience wants can be found in the various DevOps tooling used in the continuum of services your organization created. However, locating some of it takes profound knowledge of how each tool operates, adequate security profiles and an elephant’s memory as you click on multiple windows to try to correlate the data you ultimately are seeking across the various tools.

    Before you know it, executives and perhaps even practitioners are calling for a consolidated dashboard that would present this information cleanly. The danger here, of course, is an attempt to consolidate every perspective from every individual audience into a single dashboard for your company. Instead, it is wiser to begin such an effort by breaking down the number of audiences into categories (by need, perhaps) and examining what is already available and what is missing to make a dashboard project effective, and not one originating from hell.

    Dashboards: The Practitioner Perspective

    There is a keen difference in what a typical engineer wants to see as it relates to DevOps from what the other audiences will be looking for: namely, detail. If you consider this part of a dashboard effort the foundational section (i.e. providing the right detail information to the engineers who ask), the remaining higher-level presentations can be built on top of this data. Most engineers are content to just “look into the given tool” to get what they want. But sometimes consolidating this information into a dashboard begins to make more sense.

    Ideally, your company has only one build tool and, again ideally, only one deploy tool. If you have multiple types of both kinds of tooling in these disciplines, you would be better served to pick a winner there than try to use a dashboard effort to consolidate build and deployment data across multiple build and deployment tools. Allowing multiple kinds of build and deployment tools across an enterprise usually winds up in the demand for multiple dashboards from multiple audiences, and before you know it, the dashboard project from Hades once again has infested your organization. A clear winner in build, deployment and release orchestration cuts out this kind of problem.

    Most of the time the need for a dashboard emerges when users are trying to see information in a way the native tooling did not plan for. For example, I want to look at a given server, or class of servers, and a list of everything that is on them (by version). Or as an example, I want to look at these technology components of this type and version and find out every server in my entire data center that they may have been deployed to.

    Some vendors offer internal reporting capability intended to meet these needs. However, using those reporting features should be labeled with “caveat emptor” signage. Typically, vendors apply their reporting directly against online or production data within their respective tools. So an engineer presses the report button on his build tool, and the build reporting function begins to look at its own data from a production viewpoint, instead of from an offline reporting copy of the data. When you start running reports against “live” tools, you get slowdowns, sometimes significant slowdowns.

    To avoid this issue, start with determining what data the engineers need, how often they need it and to where you can copy this information (to form the basis of your dashboard system). You also may wish to examine how the base data is inherently constructed and join some of it where it makes sense, so you are not issuing very large queries joining key data from many tiny tables together before anything sensible emerges for your new dashboard system. Speed of presentation will matter still, even though the data becomes only near-real-time instead of real-time.

    Dashboards: The Business Perspective

    Once you have ascertained the detailed information to satisfy your engineering or practitioner community, it usually needs to be married to your business segmentation to meet the needs of this audience perspective. For example, I may have 30 servers that I use regularly in my e-commerce products or line of business division. My engineers may care less about this designation, as they only care which servers are content servers or database servers or application servers. But my e-commerce business teams look at this information differently. They only want to see “their” servers, not every server in my company. So to accommodate the next perspective audience, I need a way to marry servers and technologies to the product lines or lines of business my company understands.

    This may require an outside or additional database that tracks the raw server name and marries it with the business unit that cares about it. It may also track the application names the same ways, marrying them with the appropriate business unit. But this marriage now offers the ability to pull reports (or dashboard screens) by line of business—it is nearly certain your basic build and deploy tools weren’t designed to show information in this way. This kind of business segmentation, or filtering (in some tools), provides an entirely new way to examine the data. The need to drill down to the details may still exist, but a picture of change relative to a product line or business line becomes a high value-add for the business community who looks at DevOps data.

    The business community looks at DevOps information to help it make decisions based on the state of change at any point in time. E-commerce customers, for example, might get special company notifications of upcoming changes or improvements in their capabilities, as the business community is made aware, and stays current with the planned release events and quality of testing underway. Or those same notifications might be delayed based on a quick look at the same information presented the same way.

    The point is, business users are an important community or audience of DevOps information, and the lens they use to examine data is from a product or line of business construct rather than the raw data aggregated by a practitioner.

    Dashboards: The Executive Perspective

    Executives, no matter the level, usually are more concerned about trends in the information than point-in-time data. For example, a given executive may want to know how many deployments per month are happening out of the development class environment for a given line of business. If you have constructed your dashboard with the architecture laid out above, you should be able to provide this kind of information. The discreet data is stored offline (copied from the build and deploy and other DevOps tools themselves), then married with the business segmentation data. Now it can be presented in trend-over-time manners that executives invariably want.

    It is much more likely that a business team member will use the drill-down features of your dashboard than your typical exec. But having it available up to the executive layer is a huge win when demonstrating the detail of what is going on where and potentially framing the why. The other significant win of having a single dashboard for presenting trending data is the consistency in the presentation across the enterprise. Consider for a moment how many Excel spreadsheets are sure to spring up around the company when execs task their people to produce reports that aren’t available in a dashboard at their fingertips. Each minion of the exec likely will grasp certain data in unique ways, often resulting in bar charts that never seem to line up.

    Having one dashboard—or, rather, one method of presentation of the same data—eliminates having multiple unique minion versions that lack context and often misrepresent the real story. In addition, without having a central dashboard you construct and control, minions will pull data requests against the production copies of build and deploy and release tooling, perhaps slowing these tools down to a crawl while data is gathered. The act of looking at a thing will certainly change the speed of that thing, in this instance.

    Impact to the Bottom Line

    Meeting the 80/20 needs of your primary audiences of DevOps data can be done without tying up programming resources forever. Once you have delivered a core dashboard system with mainline capabilities, your executive or business teams can decide how much more resources they are willing to fund to continue to update and enhance the dashboard. As long as they fund it, you can dedicate the resources you need to keep making it better (see agile). But for most shops, this kind of dashboard is a three-to-six-month effort from end to end.

    Once the dashboard is up and running, it becomes “the” tool in the arsenal of transparency for DevOps services. Granting access to this kind of tool (i.e., setting up user IDs) is significantly simpler than doing it in the multiple of underlying tools you have to administer without it. The cost of administration in a large firm can be substantial if a dashboard is not present. Imagine having to set up a typical user ID in your build tool, deploy tool, configuration management database, testing tool(s), release orchestration tool and monitoring tool—and that’s just to start. Within these types of tools that provide a real service or function are secondary concerns such as security or permission profiles, group memberships, etc. A dashboard only needs a valid company ID, and you are ready to “see” change in motion via DevOps.

    The work effort typical executives “task” their minions to produce reports is usually no small effort, either. While this work effort is rarely captured or understood by the executives who request it, it definitively puts a drain on company resources (both man and machine). A functional dashboard can eliminate this work nearly altogether, and produce a consistent work-product output. Your DevOps strategies should be created to reduce costs and facilitate innovation at every turn. If you need help feel free to contact me, I am still looking at the moment 🙂 .

    To continue the conversation, feel free to contact me.

  • Embedding Predictive Analytics

    Embedding Predictive Analytics

    For an enterprise with a deep DevOps maturity model, the initial “wow” factor of automation has worn off. At this point, the sexier concepts involve proving continuous improvement. As an example, our first baseline of metrics might have taken the pre-DevOps timings of a typical build and deployment of a given application. We can measure this time against our post-implementation of DevOps automation and show a significant savings in time. This is opportunity time, meaning an employee must be ready to turn around the decision cycle faster to take advantage of the time saved (not be playing solitaire, for example). But once DevOps automation is old hat, the difference between our initial post-DevOps typical build and deployment time and our current one still using DevOps may not be all that significant. But is there more hidden there than meets the eye?

    Establishing Context & Baselines

    At this point context may be a more meaningful measurement. As an example, if my first version of DevOps automation for a deployment contained 35 steps and my current one contains 160 steps it would stand to reason I am “doing more” now in my deployments than I used to do. These additional steps may involve executing more tests than I originally thought to do. They may be interacting with monitoring systems (turning them on and off as appropriate), which reduces “noise” in the alerts my monitoring teams have to respond to. In short, over time, my deployment processes may become “longer” because I am increasing the capabilities or the sophistication of what I do during these deployments. While from a pure timing perspective this may make them longer, it also makes them more powerful and, so, is worth measuring. To know the delta, however, I must have retained older versions of automation to compare against, not just throw away the old every time I update with new steps.

    So let us assume the context of my automation is now fairly stable. I do the same things, more or less, the same way every time I deploy my application. At this point, measuring the functionality of what I do becomes more meaningful. As an example, my deployment automation may complete four main functional tasks to complete, I deploy the code (the app), I deploy the dataset, I deploy the config files and, finally, I run a series of tests on the above. While I may not ever incorporate too many new kinds of things to do in this automation, understanding how long each function takes to complete is relevant to proving continuous improvement. For instance, if my code takes roughly the same amount of time each deployment, as does my config files, but all of the sudden my dataset begins to grow in each deployment (from normal usage), my overall deployments may be getting slower. This is not due to hardware inefficiency or network inefficiency; it is simply due to a larger dataset that keeps growing.

    If on the other hand, it is my test set that is getting progressively longer to execute, that is an indicator of test script inefficiency (given same code, same config and same dataset). If the number of tests being executed has not increased, but the length of time it takes to run them has, there likely is inefficiency in “how” the testing is being constructed or executed. Understanding the context for what is going on in a deployment or similar kinds of automation must occur before introducing predictive analytics can occur.

    Historical Trends Extended

    Predictively evaluating automation is nothing more than taking the data from a historical perspective and extending the trend lines into the immediate future. If for example, my deployment automation is getting four seconds longer each month for the last 12 months, I can reasonably infer the trend will continue, and I can predict the length of time it takes to execute a deployment in the coming months. Understanding “why” this occurs requires a contextual investigation, but predicting its occurrence does not. This may seem inconsequential as we talk about the length of deployment processes of a given app, particularly if my portfolio of apps is small. But if the trend holds true for a portfolio of thousands of applications, the impacts become more consequential. Or if the phenomenon is directly connected to a particular cloud provider and not seen elsewhere, again, the consequences become meaningful.

    Where having “ground-up” predictive analytics (build and/or deployment automation) becomes much more useful is in the construction of release events. Often, release managers are asked to supply an estimated time duration for a given event to factor into the construction of a new release. If a vendor were to integrate more predictive analytical tooling into the release orchestration (RO) toolsets, “random” or “best guess” timing estimates could be replaced by extending historical data into the timing estimation fields. The RO tooling could provide a default timing estimation based on examining historical trends for a period defined by the user. Estimation defaults could always be replaced by a user (assuming discreet knowledge of other impacting events), but at least the new overall lengths of releases then could become significantly more accurate.

    This has special significance for manual tasks. Let’s say our database admin team traditionally takes 40 minutes to perform a given release event update, but now is running significantly longer than that. Having the RO software aware of the historical trends could alert the release manager, as well as the database team manager, during the event to check out why this is occurring. For manual tasks in particular it may be hard for anyone besides a predictive analytics module to determine what timings “should” be, as compared with what they are in a given release.

    Impacts to the Bottom Line 

    The real questions are, Why should a customer care about this kind of feature set? Why should we be looking at the vendors of our tooling to incorporate forward-thinking architectures such as predictive analytics into the tooling they sell us? Because the efficiency it can bring to our DevOps set of services lowers the costs of administration and increases the speed at which we can deliver innovation in general. Over time, trending combined with context can statistically prove continuous improvement of our DevOps services, which is the promise we made to the executive teams that sponsored and made the investment in DevOps to begin with.

    Metrics analysis can occur (usually with a dedicated investment on our part) without a predictive view of the impacts. But this changes the perspective of our analysis to hindsight thinking instead of forward thinking. In essence, we then are simply “reacting” to what has occurred instead of tailoring our environment to alter the picture of future predicted events to be better than the software predicts it to be. We start tweaking the variables to instantly impact future predictions, instead of only examining them in a post mortem.

    This perspective is yet another cultural catalyst for change your business needs. When I talk about changing how an organization “thinks” about innovation, this is one of the key objectives. We take an enterprise from knowing little about the costs of innovation, to having an extensive knowledge, to having a forward view of what is—or what should be, possible. All of this is possible despite the loss of waterfall controls and in the midst of an agile construction model. All it takes is the integration of forward-thinking architectures into the products we select. If our vendor does not offer them, we begin to enlighten our vendors on the value they would bring to us in cost reduction and to them in market capture. If you need help in these areas, feel free to contact me, I am looking at the moment 🙂 .

    To continue the conversation, feel free to contact me.

  • The Automation of Compliance

    The Automation of Compliance

    Consider how much money your enterprise spends on audits. Smaller firms not subject to external regulation should consider how much money is spent on quality assurance—or the lack of it. A business that suffers from a customer-facing quality incident will, at minimum tarnish the brand of its services or at the high end, lose market share altogether. Larger firms that fail audits can suffer from brand tarnishing as well as high fees, not to mention further scrutiny by regulatory agencies.

    Failure to perform or failure to follow proscribed processes inevitably leads to a black eye in front of customers. The entire discipline of governance is premised on avoiding both. Whether your governance practices are efficient or not—and whether your “process” as it sits today leads to quality or not—is not the subject of this review; it is how DevOps and automation can shine a spotlight on both and radically reduce the costs you spend today to achieve them.

    The Spotlight of DevOps

    The spotlight of DevOps begins with consistency that leads to predictability. Automating any given kind of process or technology the same way every time begins to give insight on any “holes” from things that do not work (or work well). If all that changes in your deployment process, for example, are pointers inside a configuration file and the kind of testing executed against this version of the code, you have achieved a build-once, deploy-many state of deployment automation. Operations staff who support the deployment of change or maintain the environments in the software development life cycle (SDLC) begin to  isolate any issues faster because they become familiar with “how” a given kind of technology is automated to deploy. This reduces the total number of deployment errors and, in tandem, reduces the length of time it takes to fix them. Any “process” problems or weaknesses in your governance model become apparent quickly and can be fixed quickly. Limiting variation is the medicine to keep them away in future.

    The spotlight of DevOps next turns to transparency. Offering your entire enterprise visibility or “read only” access to your entire DevOps tooling suite has a profound impact on the transparency of change. As an example, consider that I am a humble accountant in your firm who has submitted an agile story to improve our billing system. I may or may not, given the nature of my job, be co-located near the programming team who will fulfill this request. If our firm specializes in accounting software then perhaps I will co-locate, but if I am only requesting a change to an ancillary or support system, likely not. Without direct access to the programmers through traditional agile co-location, my visibility into the progress of change is limited to the tracking system I submitted the request within (assuming you have one, and don’t use email to do this).

    If I know a programmer in MIS, perhaps I ask him at lunch how my change is coming along. But if I have read-only access to the testing systems, or to the release orchestration (RO) tooling, I may get a much better up-to-the-minute view of exactly where my change is, how it is doing from a quality assurance (QA) perspective, and when it is scheduled for release into production. Based on this news, I may make decisions about how we bill our customers in what time frame to increase overall revenue to the company. I would notify my boss of same (who also has access, but pays less attention), and of any changes that impact the new timeline I create. The marketing team (who also has access) begins to work with public relations (PR) and the advertising guys on customer announcements, etc. etc.

    The net impact of having universal transparency is that audiences who are not traditionally notified or interested in the inner workings of change movement now make decisions based on it. Consider that prior to this systemic access, and the reliability of DevOps to ensure delivery, the only news you got before was from “the IT guy,” who was often wrong. It does not take long before IT loses credibility from being wrong about delivery timelines, and these other audiences begin to pay less attention (if at all). At that point, an “I’ll believe it when I see it,” attitude emerges. And this same attitude infects internal auditors because of what they hear and see from disaffected internal customers who have been misled repeatedly by the failed manual methods of the past (pre-DevOps).

    Processes that are disinfected over time by the consistency of DevOps begin to change the internal company thinking about the delivery of innovation—namely that it can be counted on as accurate. Transparency offered to all audiences of a company increases the visibility into all aspects of innovation delivery and better ideas emerge, both about what to do with completed efforts and how to improve the innovation process itself. And before you know it, your governance and QA processes become efficient, reliable and predictable. Variation is eliminated or greatly reduced, and the costs of operation and innovation begin to decline.

    The Forgotten Stepchild of Automation

    What is rarely a matter of focus in most companies is the secondary ability to automate the compliance history of a given application. Most firms are content (translate, only able to) work with their testing tools to produce logs about a given version of an application now residing in production. A test log does show an auditor the majority of the quality related information about a given version of an application. But the log is a highly limited view of what has taken place. What is needed is the full context of innovation. Enter compliance automation.

    Consider for a moment, that requirements drive the train. Why are we doing the innovation we are doing? Is this a bug-fix, a new feature, a client request, a regulatory requirement? Being able to trace the code itself back to the requirements system that drove the need adds significantly more context than is possible from mere test logs. Next, think about the number of attempts that finally resulted in this version of the application. An automated build tool (part of our DevOps suite) has this information. At this point you could evaluate how many builds and deployments took place in development before a worthwhile candidate emerged to traverse the remainder of the SDLC. An automated deployment tool (part of our DevOps suite) can trace the number of environments this version of the app was deployed into for testing and how long the overall process took to get something moved from development to production.

    And finally, testing is often done from a variety of tools, with results compiled in a variety of result repositories. This information may be available from a solid RO tool that tracks the gated progress of this version of the application, but if it’s not, it still should be sitting in each of the testing tools used throughout the process. Depending on the level of inherent DevOps tool integration (i.e., using a vendor suite) much of this information may “flow” from one tool to the next. But if not, the information does still exist in the logs produced by each of the DevOps tools.

    It may be well worth the application of internal programming resources to put together a tool that gathers all this information (automates the collection and presentation of) for audit purposes. Imagine the reduction in cost of supporting an audit that can gather a simple push-button report (or dashboard) of the entire life cycle of a given version of change. At that point, you have the entire context for a piece of innovation. You know what drove it (requirements). You know what it took to create it (build and deploy). You know the entire history of testing it (testing tools). And, finally, you have the entire governance process used in its deployment to production (RO tooling). But instead of examining multiple tools to collect and present it, you have created a push-button system to do so.

    Impacts to the Bottom Line

    The investment in adding automation to the compliance history of innovation pays off in more than one way. It is not just the ease with which history can be recited. It follows the same principles as DevOps itself. Automation introduces consistency in how audit information is gathered and presented (reducing variability from one audit to the next). Automation introduces transparency if the entire company is given “read only” access to this new system. Automation shows auditors we are not afraid to learn from our mistakes and proud of our accomplishments. And in effect, it reduces the need for audit altogether.

    Typically, regulatory bodies investigate and audit firms where they are uncertain of how the results were obtained. An automated system like this one fully eliminates that need. Transparency as could be offered here, may convince auditors that attention is not warranted here. Keeping in mind the spotlight of DevOps has already improved quality and streamlined process, add to that full transparency of audit materials and the confidence of auditors regarding your company may increase significantly. Routine becomes the only reason to audit, rather than suspicion.

    Invariably the “new” will sometimes result in an error that your current systems and processes (automated or not) will not catch. But this truism is recognized, and accounted for, in how DevOps enables innovation. And if you have this kind of automation in place, it can be demonstrated in how we fixed what we fixed (whether governance or QA). Your strategies in DevOps should help you achieve this level of confidence. (If you need help, feel free to contact me, I am currently looking.)

    To continue the conversation, feel free to contact me.

  • The War with Human Nature

    The War with Human Nature

    What is the difference between “leading” edge and “bleeding” edge? Being the first human being to advocate change.

    It is a virtual war with human nature to accept change. For all the innovation introduced into our society, most of it is a product of invention over evolution. Don’t get me wrong: Once we find something that works, we inherently work tirelessly to make it better, thus evolving it over time. But the genesis of the “new” is easier to accept as creation—a new idea, a new innovation of our own—than a change in direction, a forced acceptance of the ideas or creations that were “not invented here.”

    In the workplace, most employees are looking for personal security, for a feeling derived from consistency and predictability in the day-to-day work activities. Anything that threatens an employee’s ability to continue to secure compensation becomes something that inherently meets our resistance. The No. 1 culprit: you guessed it … “change.” As long as what I do remains the same, over time I will get better and better at it. Practice makes perfect. But when something “new” is introduced in the actions I am supposed to perform, there is a risk that my value, my expertise, will be reset to zero and perhaps I will not be valued as I once was. This threat to my compensation is real; therefore, my resistance to it is equally real.

    Programmers Found Guilty

    You would think that engineers and those working in the software industry would be exempt from this phenomenon. But most are not. Finding an ex-Cobol, ex-Clipper, ex-Windows, current mobile Apple iOS programmer is like finding a unicorn in Central Park. Most successful Cobol programmers are still Cobol programmers, looking for jobs in mainframe shops, content to see the new generation of programmers not competing for their declining job markets. The early generation of programmers minted after the adoption of the PC computer tend to know less about Cobol and RPG-3 and more about PC-based programming languages such as GW-Basic and Pascal (at least the older ones). Programmers minted after the Windows graphical adoption know more about that generation of coding languages, and so on, and so on.

    The basics of coding have remained the same since the advent of this discipline. We create a list of instructions, in sequential order, that the computer must execute to produce a desired result. There are nuances to this, and an explosion of capability in this, but the basic principles remain much the same. Yet, programmers well-versed in a particular language are shy about learning a new one, unless the platform is similar, the features are similar (albeit improved) and the belief is high that they will be successful in the new language quickly. There is no reason why a Cobol programmer could not be successful creating mobile apps. Or, for that matter, a mobile app developer could try his hand at Cobol. But it seems neither do, at least not very often.

    What happens instead is that each programmer begins to establish his/her own ecosystem of support: simulation models that imitate the platform responses, highly evolved text entry tools that auto-format code and check for omissions such as missing parenthesis and scripted tools that perform the mundane tasks we need to build (or construct) new versions of code or deploy a build into a new environment. This same ecosystem of support will exist for database, network and middleware engineers as well. The tools will be decidedly different, but the reasoning for them tends to be identical: to make things easier to do.

    Looking for a Magic Bullet

    There is no cure for breaking down the resistance to change, except constant exposure to it. However, forcing employees to face perceived threats to their value—and their compensation—will, at a minimum, produce exorbitant stress at work—or, worse, an employee turnover rate that would rival donuts next to a police station. The goal is to introduce change that will ultimately increase the value of an employee, as well as potentially increase the compensation they worry about. This is where the DevOps value proposition must be created for each impacted audience. A generic value statement is not enough, nor is a mandate by top company executives. You cannot “force” people to adopt something new, anything new.

    Creating the right value proposition must be specific to the audience you seek to adopt the “new” system, tooling or process. DevOps is a continuum of all three (people, process, technology). So for the database team, for example, changing out the ecosystem it has evolved into a new set of tools and processes, may seem like a hard sell at first. The advocate of DevOps (whether the exec teams or the service teams delivering it) must be able to articulate the value proposition clearly to the database teams.

    “Why” should they move to a newer ecosystem? A stubborn engineer can always point out the holes in your tool and the beauty of his own. He/she will likely have evolved his/her own support ecosystem to a state of near utopia … but only for himself. Usually the processes and tooling engineers use to make their own lives better do not scale to others in the department. And God forbid some other engineer updates “their” scripts or makes changes to “their” process. While this is wonderful for the engineer who creates it, it is miserable for anyone else attempting to use it.

    Constructing a Value Proposition

    The value statement must trade prima donna utopia for scale. Using common DevOps tooling, it is possible to support many more task requests than most individually constructed ecosystems can handle in a given day. And believe me, those task request increases in volume are coming. For example, an Ops engineer may be able to handle provisioning five systems a day with his own tooling, but when requests come in to provision 50 or 100, he is dead in the water. Having the Ops engineer help manage the deployment template or framework allows users to self-serve on provisioning requests and keeps him from having to do everything for everybody. His job is different but every bit as important.

    The value statement must trade current skills proficiency for next-generation, market-valued skills. In effect, a database guy is valuable, but a DevOps database guy is considerably more valuable, or a “big data” database guy, or a IoT database guy … pick your poison. Whatever you are today, whatever skill set you have, the jobs that pay more money are the jobs that fewer people know how to do. At some point, a lack of DevOps proficiency will relegate an engineer to the pages of history. On the other hand, adopting and embracing DevOps will allow engineers to get the training they so desperately need to keep their career “fresh.”

    Finally, the value statement must trade today’s earnings for tomorrow’s increase in earnings. Companies that embrace DevOps are going to either save extreme amounts of overhead by staff reduction remaining at the same level of innovation productivity. Or, they are going to increase innovation productivity levels radically, making them leaders in their respective space by meeting customer demand much faster with higher quality (the path most taken). Either option should translate into higher compensation for employees who embrace DevOps. If companies do nothing to increase employee comp, choosing only to increase profits, competing firms will be happy to poach them and pay them more instead. This forces more costs in recruiting, training and employee turnover when it happens again.

    A Human Strategy that Works

    Your strategy for training employees to embrace change should be particular to the kind of work they do, and reflect the things that will matter to them. If you need help crafting a strategy let me know, I am looking at the moment 🙂 . Not every team will be as critical to the overall success of DevOps as perhaps your engineers are, but the value proposition should adjust for this fact. Keep in mind, if the change is less, then the resistance will be less as well. Your accounting, HR and legal teams, for example, may not feel the impact of DevOps as rapidly or as severely (in terms of change); thus, their resistance may be less, but it is likely more than zero.

    DevOps is about people, process and technology. It is in that order, with a heavy emphasis on people and a relatively light impact from tooling. And it will succeed or fail based on the embrace of people, process and technology. Process and technology do not care about change. People do. Since people are the largest priority or component of DevOps, it is their fears that must be addressed and their value that must be enumerated to succeed.

    To continue the conversation, feel free to contact me.

  • Dying for Intelligent Calendar Awareness

    Dying for Intelligent Calendar Awareness

    What would we die for in an integrated DevOps tooling solution—something that would make our operations partners stand up and cheer? Intelligent calendar awareness.

    The most fundamental construct of any release orchestrations (RO) tooling software is the calendar. RO software, no matter who the vendor is, uses a form of the calendar, to outline what tasks will get performed in what order from beginning to end. Better RO software allows for parallel tasking, but all RO software uses a calendar. So the most fundamental use of a calendar construct is focused on “when” tasks are performed and completed. Adding intelligence to a calendar construct adds three more dimensions or characteristics to this baseline feature.

    The Intelligence of Ownership

    First is the concept of ownership. Instead of just marking a calendar with the dates of specific tasks, or clusters of tasks, the addition of ownership marks the calendar with “events” that are “owned” by specific teams of people intended to perform groups of actions or tasks. As an example, instead of just marking the calendar that on April 27 this year, with the specific tasks we need to run a mini-release to upgrade our Oracle database from version “x” to version “y.” With the addition of ownership, we could mark this date as running an “event” of an Oracle database platform upgrade. This new event would be “owned” by the database update team.

    The block of time the team outlines for the Oracle upgrade “event” would then take on two additional characteristics for teams in general: inclusionary and exclusionary implications. As an example, the time set aside for the tasks to upgrade the Oracle platform becomes inclusionary for the owning team. Members of this team would be allowed to schedule tasks during this block of time, ideally intended to facilitate this goal of upgrading the platform.

    Other teams are (by default) excluded from performing actions during this block of time so they don’t impact what the database team is attempting to accomplish. When other teams pull up their respective calendars to schedule some new task or event, the April 27 block of time is greyed out or presented as unavailable because the database team owns an event listed in that block of time. For the database team the time is inclusionary, for all the other teams the block of time is considered exclusionary.

    The benefits to you the customer are immediately visible. By adding ownership to the calendar construct, events could be scheduled in such a way that teams do not inadvertently “step on” each other (i.e., attempt to schedule tasks during the same window of time that would adversely affect the other). It also allows you the customer, to view a dashboard that shows the “kinds” of events that are scheduled throughout the week, month or quarter, and who is doing what.

    To avoid being too strict with this idea, the RO tooling vendor need only add concept of granting exceptions to requesting teams by the owning team for events that would not impact their efforts. So as an example, if a different team wanted to work on tooling the SQL Server platform during the same block of time that Oracle platform was being updated, and the servers were different anyway, there is no reason why that team could not schedule a similar event of its own at the same time. If ownership is the only concept added in the RO tool, an exception would have to be granted by the Oracle team, but this would be costly in terms of administration. It is for this reason we introduce the second main construct in the intelligence of calendar management.

    The Intelligence of Component Awareness

    The second main concept of intelligent calendar management is component level awareness. This dimension of awareness is based on identifying specific “technologies” as resources or components that are part of the environment you operate at your company. It doesn’t have to be a ground-up exercise, and if you prefer one of those, you could use a standard discovery tool to keep it up to date. But the more basic idea is to simply identify the fundamental technology components you use in your world.

    So as an example, I could identify that this company uses Oracle databases (perhaps also tracking the version if there are multiples of it), SQL Server databases, the type of servers it uses, the operating systems, the middleware, perhaps a mainframe platform and the network fundamental technologies, etc. It is highly likely that there are groups of people who are uniquely identified in this company that manage these specific types of technologies. This makes the associations easy for event ownership. The Oracle guys become associated with the Oracle technology components but not with the SQL databases, etc.

    Having teams associated with the components they manage allows for better parallel event scheduling. But this is only the first level of intelligence. The next level is to track, by application, the underlying technology components they utilize. This process is done during the build and deploy automation anyway, so the effort is nothing more than what is done today. The beauty of having this spider web map, or this map of technology component dependencies, is that it adds a new level of capability to scheduling in our calendar.

    At this point, scheduling an Oracle event does not preclude the SQL team from scheduling another one during the same time window, since those two technology types don’t conflict with each other. Both teams would see open calendars on the same day due to this intelligent calendar awareness of component interdependency, or lack thereof. This dimension of intelligence precludes having to grant needless exceptions to owned events. The only requests for exceptions would come from users or teams that actually would impact the upgrade event, and they could be evaluated for legitimate need and potential real impact.

    Let’s return to our Oracle platform upgrade event our mythical company scheduled for April 27. With the addition of component-level awareness, when this event is scheduled by the Oracle database team, every application that uses Oracle is “automatically” notified that this time window is now off-limits for its development or usage activities. This limitation could include automatic notification to application development teams that they could not deploy new code during this window. Or the notification could be expanded to notify users of the impacted application(s) that this list would be down during this window of time. Applications that do not use Oracle would remain unaffected and not notified.

    Imagine what this kind of automatic notification could do for both development and the user base of the technologies you operate, all coordinated automatically through the RO tooling you use today in DevOps. Then think about the possibilities from here. The Oracle team could look at a block of time again and examine whether scheduling on April 27 would have a high impact on other teams, or not, before it finalizes it. If the impact to others is high, perhaps the team picks a different date. The possibilities become endless.

    The Intelligence of Scope

    The third and final architectural dimension to add to calendar intelligence is the concept of scope. Scope is a simple hierarchy that you could define about your company by logical business subdefinition. As an example, you could outline the scope you define as: global (entire company), business unit (listed by name), product unit (listed by name) or departments (listed by name). Just using these kinds of simple scope definitions begins to insert an impact assessment into the event scheduling that takes place.

    As an example, events could be scheduled with a global scope, owned by the change management governance body, that excludes a 10-day window because of a corporate audit by outside regulators. Now, when any development team attempts to schedule deployments or releases, for example, their calendars are automatically greyed out during this 10-day window because of the corporate governance event. Exceptions would only be granted by that governance body. In this case, this prevents accidental changes occurring during the middle of an audit.

    If the example cited above is too broad, and the mythical company only needs to limit an event to a particular product line or further down to a particular department, the “scope” characteristic allows them to do so. This final dimension to intelligent calendar management does require a higher level of sophistication from the RO tooling vendor and a higher upfront investment in the administrative costs of providing DevOps services. But for an enterprise-class installation, this is an investment that can take the chaos of corporate communication where it comes to the impact of change to a systemic nirvana of communication on demand.

    The Impact to Your Bottom Line

    So why outline an architecture that most RO vendors have yet to implement? If it is candy I created that you can’t have yet, why discuss it? Two reasons: First, when you begin to examine the cost of running your DevOps set of services, you will find that, like many other enterprise-class efforts, it is the administration costs that are heavy at the outset and increase over time. The effort it takes to manage “communication” and avoid having interdependent technologies “step on” each other is no easy task, particularly when we have moved from weekly deployment windows to potentially daily deploys to production across large app portfolios or complex legacy hardware architectures.

    Second, for those of you who still maintain data centers, consider how much time you “waste” if your Ops teams continue to require a 12-hour to 48-hour window over the weekends to make updates to their own platforms. Going to an external cloud provider is a way out of this, but for organizations that are unable to fully do so, the weekend downtime remains a significant issue. DevOps will create desire in the Dev teams to want to use this traditionally Ops window for their own purposes as well. Once DevOps has been fully embraced, there is as much a need to automate communications and intelligently ensure we do not step on each other as there ever was. DevOps accelerates this need, as it accelerates the speed of innovation itself.

    The proper tooling, or rather the tooling that is thinking about intelligent architectures that will greatly reduce your costs and your overhead and ensure consistency in your world—these are the features (and the thinking) you need your tooling vendor to embrace. The alternative is having to pay your labor base to manage it another way. If your leadership and your vendor partners are not considering these issues, they should be. If you need help, feel free to contact me (I am still looking at the moment). The goal of DevOps to automate process should not just be about moving code; it should extend to how we administer, communicate and inject governance as well. Intelligent architectures accomplish these goals, and any vendor could be there first, if they wanted to.

    To continue the conversation, feel free to contact me.

  • The Beauty of Inheritance Architectures

    The Beauty of Inheritance Architectures

    Spoiler alert: This article is not about inheriting your great-grandparent’s estate. It is rather about how embedding the principles of inheritance into the architecture of your chosen DevOps toolset can yield exponential results. And yes, I realize that you, the customer, have little to do with what a vendor builds its tooling architecture upon. However, you, the customer, can vote with your feet, to search out products that offer features such as inheritance, rewarding vendors that have it and punishing those that do not. The simple question to address here is, Why should the customer care?

    Like anything that can grow, sustainability on scale is a key concern. How much will it cost me when I am maintaining 6,000 applications on this particular DevOps toolset, as opposed to the six applications I started with? You can also infer maintaining a higher number of technologies as having the same need. For example, if I need to maintain three different types of databases, two different middleware, four different hardware platforms on “x” different versions of operating systems … you get the idea. The larger the application portfolio (in sheer numbers of apps), or the more technically complex the portfolio (in sheer numbers of technology components in an app), eventually will drive you to worry about how easy it is to maintain these applications within your chosen DevOps toolset.

    The capabilities of your chosen set of DevOps tooling will govern the costs of both the initial adoption of your services as well as the ongoing maintenance of the application portfolios you serve. It is hard to sell the value of DevOps to the business when it begins to see a one-for-one increase in DevOps engineering staff for every new application or technology venture under consideration. However, one of the chief culprits in driving large DevOps support staff organizations boils down to the lack of an inheritance architecture in the tooling that was originally selected.

    Setting a Common Language

    So before we discuss how inheritance will benefit us, first let’s agree on a common vernacular of what an “application” is. When you say the word “app” to someone, you get a wide variety of responses on what that means—from something that sits on your phone to a cluster of things that sit on the mainframe. Let’s begin by examining what an “app” is by the effort it takes to onboard and then maintain it on our DevOps sets of services (regardless of platform).

    Consider for a moment the hierarchies by which we could describe software constructs. It is relatively easy to discuss how software works in terms of hierarchy. First, at the lowest layer, we could describe having multiple technology components (or the lowest level of a particular piece of technology that must be addressed in a build). Next, assembling these components together forms the picture of what a single application looks like. Finally, assembling multiple applications that have a common symmetry or common purpose together form a system or series of apps.

    An imperfect but quick example could be the Microsoft Org Chart component of its Office application(s). For purposes of example we will argue that Org Chart, Clip Art Manager and Equation Editor are all components of the application Microsoft Excel. To build a new version of the application Excel, we would have to deal with each of these individual components that, once assembled in our build, would create a new version of Excel. When you combine more of the apps—Excel, Word, Outlook and PowerPoint—you get the system, or series, called MS Office. (And, yes, I know this is a less than ideal example, but it is meant only to illustrate a point.)

    Assessing the Work Effort

    The reason for discussing software in this way allows us to begin to discuss the level of effort to automate it. By addressing the work effort to automate each component (by type), we can begin to estimate how long it will take to complete “the automation of software.” For example, if my homegrown application has a source code component, a configuration file component, a database component and a middleware component, then I have four components I must automate (or include in the build and deploy process) to assemble a new version of my application.

    This gives us a “least common denominator” language for assessing how much effort it takes to automate a given app. I have seen most common applications have only two to three components. But I have also seen several apps that, due to their unique architecture and construction, have 30 to 50 components a piece. Obviously, it is easier to automate an application with only three components than one with 50 components. The other factor we need to apply on the ease of automation is whether I have encountered this particular component technology before in my prior automation efforts.

    Let’s say, for example, that the application I am estimating contains Java component(s). If I have encountered Java automation prior to this, I should have constructed a template for Java type component automation that I can use for a situation just like this one. In this situation a familiar technology component is far easier to automate than a new one (or, rather, new to me). However, if this is the first time I have ever seen Java, then it may take me a bit longer to construct the template I want for this app, and for future apps I encounter, that also use this technology type.

    The Beauty of Inheritance

    Here is where inheritance begins to play its critical role. If my DevOps-build construction tooling includes inheritance, then I could construct a “master” template or framework for each type of technology as I encounter it. A master template for SQL databases or Oracle or DB2, as an example. Or, I could make a master template for WebSphere or SharePoint types of technologies—one master for each kind of programming language we have in my shop. You get the idea.

    Having done this allows me to have a limited number of master templates, in which I can maintain all the critical steps and processes my company wants me to do for a given technology type. If different business organizations or development organizations need a variation, they can create a “child” of my master and vary it according to their own needs. As long as the linkage is maintained to my parent/master template, I can make the big, overarching changes driven by corporate mandate, and the business unit can continue to vary items to their unique needs.

    Having inheritance in this instance allows me to roll out changes to an entire organization, such as, for example, a security patch or process, for a given technology by simply adjusting the master template of that component. Inheritance automatically flows my change down to all the “children” of my master and possibly to all their “children,” should the need arise. The alternative is having to go through the specific automation of each application that has the targeted technology component and updating it manually, hoping I don’t miss one, and hoping the steps I may need to adjust do not break the old automation instead of alter it the way I needed.

    Imagine having a WebSphere subject matter expert able to adjust every client application that uses your corporate installation of WebSphere by simply adjusting one master template. Or having a network guru, or database expert, be able to do the same for all applications that use their particular technology component all at once. Inheritance preserves the real-world need of having limited alterations of the same technology type within the same company, flowing down changes from parent to child.

    Having a one-size-fits-all is simply not practical. Using copy/paste requires repeating updates to each impacted template or framework manually. But having the ability to create offshoots from a main, and not lose the connection to the main, allows corporatewide alteration from a central point of control. The costs of maintenance or administration are formidable; inheritance can reduce them. This allows a much higher ratio of applications or technology components supported by a much lower number of engineering staff.

    A Wider Impact for Inheritance

    Inheritance is keenly useful in release orchestration software as well. Most vendors offer the cut-and-paste approach: you copy the last the release you did, alter it slightly and use it again. That might work for some organizations. But having an inheritance feature creates entirely new dynamics on how a release is constructed for a given line of business and how corporate governance can be implemented with minimal effort. In this case, a corporate master release template can be constructed, and child releases can inherit from the master all the main governance required without risk of omission.

    I realize inheritance architectures might not be at the top of your list when evaluating DevOps tooling solutions. But I would submit it is a strategist’s job (if you need one, let me know, I am looking 🙂 ) to point out how long-term sustainability can be greatly benefited by this architectural feature—even if the vendor would love nothing more than to steer you away from it. If you already have committed to a tooling solution, you may want to bring this up at your next vendor features performance meeting. If not, you should at least consider what having it means to your internal cost structure, and what not having it will add to the true cost of ownership of any proposed solution.

    To continue the conversation, feel free to contact me.
  • Humans in the Machine of Release Orchestration

    Humans in the Machine of Release Orchestration

    Let’s face it: Most organizations are still struggling to achieve the Nirvana of full gated automation. At first, we automate the core of our DevOps services, the build and the deployment disciplines. Over time, we realize that a templated or framework (or pick your similar terminology) approach toward automation allows for scale as well as predictability, lowering costs. It is here where the lion’s share of variability can be reduced and scalability achieved.

    The next culprit to hit the radar is usually test automation, but this tends to be where the rubber meets the road for the level of work it takes to automate process. So generally minimal work gets done, ascribing to the 80:20 rule that 80 percent is quickly attainable and should be sufficient, the remaining 20 percent is just too hard. But having gotten this deep in the DevOps maturity scale, release orchestration (RO) is usually next up in our continuum of services.

    The automation of release orchestration is a different animal than the core of build, deployment or even test automation. Release orchestration is more about automating our process of change management. Invariably the spreadsheets or SharePoints of yesteryear are intended to give way to our preferred vendor’s methodology of reinventing the release wheel in their proprietary toolset (albeit with better results expected). But usually this is the wrong approach as well.

    Changing Human Thinking About RO Construction

    As I continually repeat, DevOps is about thinking differently about “how we innovate.” (If you need more strategic leadership help in this regard let me know, I am looking.) Consider that our spreadsheets and SharePoints, while impressive, constricted us to thinking about release and change management within the architectural constructs or limitations of the spreadsheet and SharePoint tools. They were task-oriented, less interactive, top-to-bottom lists of what we thought we needed to do in any given release. If we were to truly go back to the drawing board and thought about creating a release without those constraints, or just with the idea of parallel tracking, what might we accomplish?

    Digesting the release process with a lean mentality breaks down large sections into more manageable subsections. This reduces risk, and increases speed, particularly if it is coupled with parallel execution. If there truly is a sequential dependency in our tasks, let’s call it out, but when we do, we must ask ourselves whether that dependency is a go/no-go for all activities, or for only some of them. If it is the former, so be it; if it is the latter, then perhaps we can adjust our sections to account for this and run more of them in parallel. Just implementing a parallel mindset can radically reduce the time it takes to run a release from end to end. But we must also ask ourselves, What other key features of any preferred release orchestration toolset can alter how we think?

    Changing Human Thinking About RO Execution

    The other axis upon which to digest release orchestration is in its real-time interactivity. Consider for a moment that some tasks either cannot or will not ever be fully automated. Some tasks will remain in the province of a human to fulfill. For example, (and I cannot imagine why, but humor me), if we needed to install additional hard drives in bare metal servers during a release, the physical installation would always require a human to do so. With old release orchestration technology we must wait for shared spreadsheet files to be updated by the engineer when he/she completes this task (or any other manual task example you can think of).

    With new mobile release orchestration technologies, the engineer could mark them complete (or percentage complete) in real time on his/her mobile device while still in the data center, standing in front of the hard drives/server. How much time does this save, in pure walking to his terminal, logging in and updating a file, emailing it to the change manager, merging it with the current one, etc.. A simple swipe and done. The engineer is now able to provide a great deal more information to the team in real time, and with minimal effort. This gives real-time visibility to the release manager such as has never existed before.

    It can also grant them a level of direct interactivity. Imagine the hard drives’ physical installation has been completed, but manual testing is failing. If the engineer has no good way to share the information with the team, risk for overall on-time completion cannot be properly assessed. Proper tooling avoids the scenario where change and release managers are waiting on a task, and drill-down activity is unavailable (picture a spinning icon, rather than a percentage complete on specific task item). Add the dimension of red-yellow-green to track the completion of tasks, whether parallel or not, and we have a dashboard that calls our attention to the problems impacting a release in real time. This is far less possible with older RO technologies until somebody checked their watch and started making phone calls.

    Changing Human Thinking About RO Valuation

    Now every organization dreams of a release containing nothing but virtualized full-stack deployment for every app (even the legacy ones), where everything from bottom to top is automated during the deployment process. However, some of us living in the real world, still have a few database scripts that must be run manually during a production deploy (don’t ask me why). Or pick your poison in the real world you are contending with, often infrastructure and platform tasks are the last to be fully automated.

    So during a release, engineers need to be on hand and ready to go when called upon. If however, we now all subscribe to a tooling solution that acts as a common backbone for our release orchestration … the engineers know exactly when to do something, if they can do it early, and when they can go home afterwards. There is the value proposition for the engineer, less time spent doing tedious work during a weekend, when they would otherwise prefer to be at home.

    The value proposition to the release manager is real-time insights into all this activity during a release. The automated tasks flow through just as you would expect them to, with up-to-the-minute status of their progress until completion is reached. The remaining manual tasks provide as-good-as-it-gets status updates, also in real time, and serve as the next target of opportunity for automation prior to future release(s).

    Changing Human Thinking About RO Perspective

    One thing that always seems to be missing from a number of vendor’s offerings I have reviewed in the release orchestration marketplace, is a view from human centricity. Most release orchestration tooling is obsessed with task management, integrating it with calendar scheduling and designing it for maximum efficiency in getting the next step done. If however, our vendor community would embrace the idea of intelligent calendaring a bit more (a future article will discuss this characteristic more in detail), the offerings could form a more human-centric view of the release orchestration process.

    Imagine what it would be like for either an engineer or a change manager to log in to the release orchestration toolset and have a personalized dashboard outlining the tasks that need to be approved, worked on or completed to support the all pending releases for that user (based on integrated workflow and intelligent scheduling). An automated red-yellow-green attention draw, for work that may be behind, on schedule or completed early, would greatly improve the human experience of release orchestration. And an integrated departmental or team-focused view of the work effort from manager or employee-centric views would add to job performance critiques—proof of superior, or inferior performances over time.

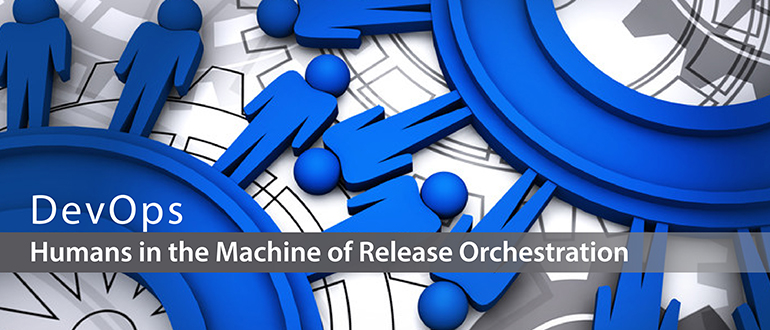
    This represents only a simple recognition that humans should not be stuck in the machine of release orchestration tooling, slave-to-a-machine-centric view of actions to be completed. Instead, a vendor could recalibrate a more human perspective—a subtle alteration in perspective adds an exponential lift to the value of this release orchestration toolset, and it seems to me, any vendor could be there first … if they wanted to.

    To continue the conversation, feel free to contact me …

  • The Nirvana of Gated Progression

    The Nirvana of Gated Progression

    A highly functioning enterprise-class DevOps set of services has a fundamental goal of full automation. To be honest, having the right DevOps strategist (or visionary) leading this effort is as important to achieving this goal as the combination of all the challenges and topics that must be addressed. So for the sake of argument, will we assume you have one (if not, feel free to contact me—I am looking at the moment 🙂 ).

    With key leadership in place, the first target is always the automation of the build and deploy process. This could easily be considered the core of DevOps or its heart. But once this automation has been achieved, the trickier topic of release orchestration begins to emerge. Strategy is to release orchestration what taste is to food: Having the right one does make all the difference.

    To progress our code to production, the inherent assumption is that all testing has been completed successfully. Sounds like common sense. But then, how much of that testing occurs with human hands on it? The user acceptance testing (UAT) discipline inherently requires a human at the wheel. But the reality is, for every time a human must interact with the progression of code from the development-class environment through all the testing environments (integration, performance, user acceptance and QA) on its way to production, the momentum of innovation is slowed down—all the way down to human levels.

    The Complexity of Testing Types

    The first automated testing begins to occur in development or (DEV) class environments, where the programmer is under strict instructions to implement test-driven development. This requires new feature/functional testing as part of the build or deployment automation into DEV. Either the build or the deployment cannot be said to be successful “if” the accompanying tests are not “passed.” This also represents our first “gate.” Sophisticated release orchestration (RO) software can examine “flags” set during the build or deployment process to see if the testing has been completed successfully. If so, the code can progress to the next testing level environment within the software development life cycle (SDLC).

    Another useful type of testing completed early in the SDLC (most often in DEV) is the examination of code coverage. Development organizations can begin to examine how much of their code is put to the test, and set arbitrary percentages as a minimum standard before the target application is able to progress. The addition of alternate types of testing occurring in DEV class environments does add to the quality of the innovation effort. However, it brings with it an increased labor effort to automate both progression—and audit—of the version under test.

    For instance, feature/function testing may use a single repository to store the results for a given version of the code. I go to my testing repository and I can look up the results from version 1.4 of my application, or version 1.5 of my app, as many as I desire. Should a regulatory official or internal auditor ever ask me to prove the quality of version 1.5 of my app, I need only consult my testing repository and show them how many tests were executed, and how many passed or failed before this version of my app was ever deployed into production.

    When you add code coverage testing to the process, I now need to consult two different testing repositories, producing two separate reports to assess the quality of this same version of my app. There is nothing wrong with this, but it does create more work or effort to produce than it would if a single testing repository was used. The problem only increases as we keep increasing the types of tools we use to prove quality. Security testing, for example, (ensuring code does not have inherent security holes) tends to use different tools, or, worse, processes that require human peer observation, which again can add effort to create the automation and the traceability for audit. These are critical types of testing (and/or processes) so they must be done, but they also come with an inherent cost in automation effort.

    Small shops may not worry about these kinds of concerns, but large organizations will, particularly if they are still in the process of transitioning from legacy waterfall methods (where controls were high) to new agile methods (where it feels to auditors like the wild, wild west). Compiling a test log that matches the version of code under scrutiny such that it can be reproduced automatically will restore the faith of both internal auditors and regulatory officials who come asking. But the addition of each new type of testing tool will require more effort to maintain the ability to compile those test logs.

    The Complexity of Testing Responses

    Next, consider the impact of non-binary responses to automation efforts for gated code progression. Does my feature work (yes/no)? This is a binary evaluation, a true/false or yes/no that is easy to set my progression flag for testing response. It is another matter to evaluate the results of my code coverage and ensure this app is above 70 percent or between 70 percent and 90 percent. These kinds of questions are not binary (in other words, there is a real result to compare to, not just a pass/fail), and require further effort to set a binary flag for the gated pass/fail. When the evaluation question does not intend a binary answer at all, such as a grading of 1 to 5 where 1 equals horrible and 5 equals outstanding, I am now most often forcing a human to make an intelligent decision as to whether this code should progress.

    Multiple testing repositories require additional automation effort. Multiple kinds of responses require additional automation effort, and the standards by which the gates pass or fail also may change over time, requiring tracking of the goals at the time the tests were taken. Creating independent test automation that can be called from the build process or the deployment process is wise. Associating this test automation (whether scripts or simulations, etc.) with the version of the application code is wise. And working to reduce the number of repositories to examine is wise. Having de-coupled test automation strictly from a build allows it to be re-executed in more advanced testing environments when the need arises.

    Charting the Course to Nirvana

    RO benefits from as full a level of automation as possible. I will discuss the RO topic more fully in another article, but the foundation of automated change progression relies on a gated history of proving quality. As long as the code under review continues to pass testing, setting progression flags to green or yes or pass, the RO software can continue to progress it along its way to production. Failing code must be sent back to the DEV environments where development teams can address the issues before making its way back through the automated process once again from beginning to end.

    If the organization has made the intentional decision to keep humans substantially involved in the testing and evaluation cycle, it must realize a few impacts of that decision. Daily movement to production becomes less likely—most often it takes a week or two for changes to undergo significant human scrutiny (depending on the level of testing automation). The results of human intelligent decisions also must be chronicled in the testing repository to preserve the history for audit. This can lead to a “blame game” kind of thinking when something goes wrong, as it is immediately attached to “who” approved it, instead of to “why” they did so. And obviously the cost of labor is always the highest cost element in any innovation cycle, so buyer beware in this scenario.

    On the other hand, “Nirvana” is the state when all testing (except UAT) is fully automated and gated, and provides the foundation for RO software to move code into production as often as it can prove quality. This could mean fully automated releases instead of release weekends. This could mean multiple releases per day into production. This could mean that releases themselves are no longer considered “events,” but by default are now “non-events.” Nirvana does not endanger the lives of change and release managers—it actually gives them one. For a “change” (pardon the pun), they get to discover something they vaguely remember … a life outside of work.

    To continue the conversation, feel free to contact me.

  • The Transience or Permanence of Provisioning

    The Transience or Permanence of Provisioning

    I realize the title of this article may conjure up ideas about the impacts of entanglement from quantum computing, but no, we are not there yet. Instead, I am referring to the benefits an organization can achieve from determining which environments in its software development life cycle (SDLC) should remain permanent and which are better candidates to be transient to understand the discreet costs of innovation (ideally if virtualized).

    First, to keep an even playing field, make sure your DevOps services are using the “build once, deploy many” philosophy. Under this thinking there is a single build constructed that is deployed unilaterally into each class of SDLC environment (not a unique build for each class). Uniformity under test eliminates variability of results. Uniformity of the basic process of deployment, builds consistency and predictability also will reduce errors and the time it takes to resolve them.

    Second, the actual computing capacity you deliver any environment on may be virtualized, whether you provide your own bare metal assets (private cloud foundation) or if you use a public cloud entirely is less the issue. Understanding whether a class of environment is transient or permanent only affects how you plan for the costs and policies of operating it, and it leads back to the discreet cost of innovation as a result.

    The Cost of Creation

    When this topic is usually considered the first and immediate point of view is usually R&D, or the development class environment. And yes, the ability to provision a DEV class environment and then tear it down when the effort has completed is the normal use-case to justify virtual infrastructure at all (public, private or hybrid cloud usage). The obvious benefits include having no “throttle” on how many concurrent efforts might be spun up.

    Transient DEV environments also build in a concept of failure, or elongated “playing,” not intended to produce a specific result but intended to dabble with innovation to see what “might” be possible. All of this without the capital investment it would take to build and maintain an R&D lab to accommodate it, or set aside fixed computing capacity for it. DEV efforts with intent (i.e., part of a formal project) can be tracked for costs discreetly with that planned innovation. DEV efforts without intent (i.e., more like what used to occur in R&D labs) can be associated to the overhead costs of all innovation.

    The Cost of Evaluation

    But beyond DEV, the next major class of environment to consider is the integration (INT) class. If your company has more than one application, has apps that work together or has applications with upstream or downstream dependencies, you likely need an INT class environment. The major responsibility of this class environment is to provide “something to point to.” Your app (undergoing change) has an environment where it can point to all the other applications to test how the interconnections work. Logically, this class of environment is a better candidate for permanence. This is because you can rarely predict which apps may need this service at which time across the entire portfolio. Many apps undergoing change may be using this at one time to insure they all work with each other (i.e., assessing their interoperability with future versions, early, or prior to production).

    Another reason for maintaining a permanent INT class environment may involve your interaction as a vendor to other companies who “point” their apps at yours as a service provider. Even organizations who have little interaction between their own apps, may well be a significant provider to a wide swath of customer applications. If your customers need a place to point to, the INT class environment is typically the one you want. So in this instance permanence is the logical need.

    Next up, becomes the performance test (PT) class of environments. Emulating production, or being able to project differences between the platform you use, and what production provides is key to success. However, this class of environment is a perfect candidate for transience (especially if your development and production environments are already virtual). Why maintain expensive hardware on the floor, only to conduct periodic testing, which requires massive reconfiguration and preplanning. Dump it. Instead, use a virtualized platform where provisioning is near instant and can exactly mimic both development and production – remember: build once, deploy many.

    Another significant class of environment in the SDLC to examine is the User Acceptance Testing (UAT). Logically, this class environment may get a lot of usage, but ideally only after the app has passed testing in development, INT and PT. Because of this, the UAT should be transient as well. A good candidate to tear down when not in use. You may wish to plan for a setup and tear down of this class to mimic what happens in formal development efforts.

    Finally, the quality assurance (QA) or preproduction (PreProd) class environments, if in use, are designed to emulate the current state of production completely, allowing the app-under-change to run against a more sophisticated type of INT class environment (with possibly copied production data, etc.). This happens more often when the earlier INT class environment contains a great number of other applications under change. This one provide a “cleaner” place to point to, only production operating apps. The QA environment may also be used as an after action, when an error is discovered in production for debugging or more extensive monitoring. Obviously, if your organization finds a need for this class of environment, it will carry the permanence characteristic.

    The Cost of Operations

    Production is by nature permanent. Virtualizing production offers the ability to scale on demand. But a scalable production solution benefits from more mature DevOps services (whether you own the data center or not). Consider for a moment, the number of errors attributed to code post a DevOps embrace. The number of errors goes down, the time to resolve them goes down, the size of the effort gets smaller for less risk, and higher speed. This combination means production is going to suffer far less from aberrant code running amok (asking for tons of memory, CPU or disk due to error). Those kinds of problems get detected earlier (because of DevOps) in the SDLC process and hardly ever reach production after DevOps is engaged.

    With a mature use of DevOps, it means that any kind of scalable solution of capacity-on-demand will get engaged for only two reasons: a dramatic increase from customer demand (the ideal solution) or a denial of service attack attempting to drive your costs higher without real customer use. The monitoring solution you employ will help decipher the difference. If your application has logging features built into it (i.e., you produce a log detailing what customer is performing what key feature in your app and when) you should be able to avoid the latter scenario with an automated monitoring detection effort.

    New Abilities to Measure the Cost of Innovation

    Understanding the cost delta of transient and permanent environments is worth examining. It will help you understand better the cost of innovation on an annualized basis. And it may also reveal how much real effort goes into testing of each kind of class. If user adoption is suffering for example, and you determine that UAT class environments are largely unused or torn down, you know better where to address the problems earlier in the cycle. The same can be said for PT as well, how much test, for what kind of scaled performance in production.

    If your organization maintains INT or QA class environments you may want to allocate their costs to SDLC overhead as they tend to be permanent, and value shared. The development, PT, and UAT environments, if transient, represent the variable cost of a particular innovation effort and can be tracked with good discretion. When considering the timing, value, and benefits of virtualization, you may wish to factor in where you are on the DevOps continuum. If you have had DevOps running for a while, the timing for virtualization and scalable capacity on demand may be better, than if you are just starting out.

    Keep in mind that most organizations who have transitioned away from waterfall and into agile, will lose a good deal of the former financial controls that worked in waterfall, and do not work as well in agile. DevOps delivery is also capable of moving change at orders of magnitude higher speeds than former manual methods. This combination makes trying to cost innovation discreetly more difficult. Being able to associated transient environment costs with formal development efforts (ones with intent) may restore some of that financial discretion. It may also help identify the true overhead costs of innovation located in the operation of environments classed better as permanent.

    To continue the conversation, feel free to contact me.