AI-generated infrastructure code is arriving faster than most organizations can absorb it. The organizations that invested in platform quality first are the ones pulling ahead.
Every few years, someone declares that Infrastructure as Code is dead. The arguments tend to “sidecar” the hype cycle. First, complexity, then containers, then Kubernetes, then serverless. Now it’s AI’s turn; supposedly, generative AI tools will make declarative configuration files obsolete, and natural-language prompts will replace Terraform modules and policy-as-code guardrails.
This latest narrative probably drives clicks and hallway conversations. But it’s wrong.
What’s actually happening is more interesting and more consequential for infrastructure leaders:
- IaC is becoming the system of record inside a larger platform architecture, one that AI both depends on and generates code for.
- Enterprise infrastructure remains stubbornly hybrid, spanning on-prem and cloud, with GPU clusters emerging as a critical compute layer for AI workloads.
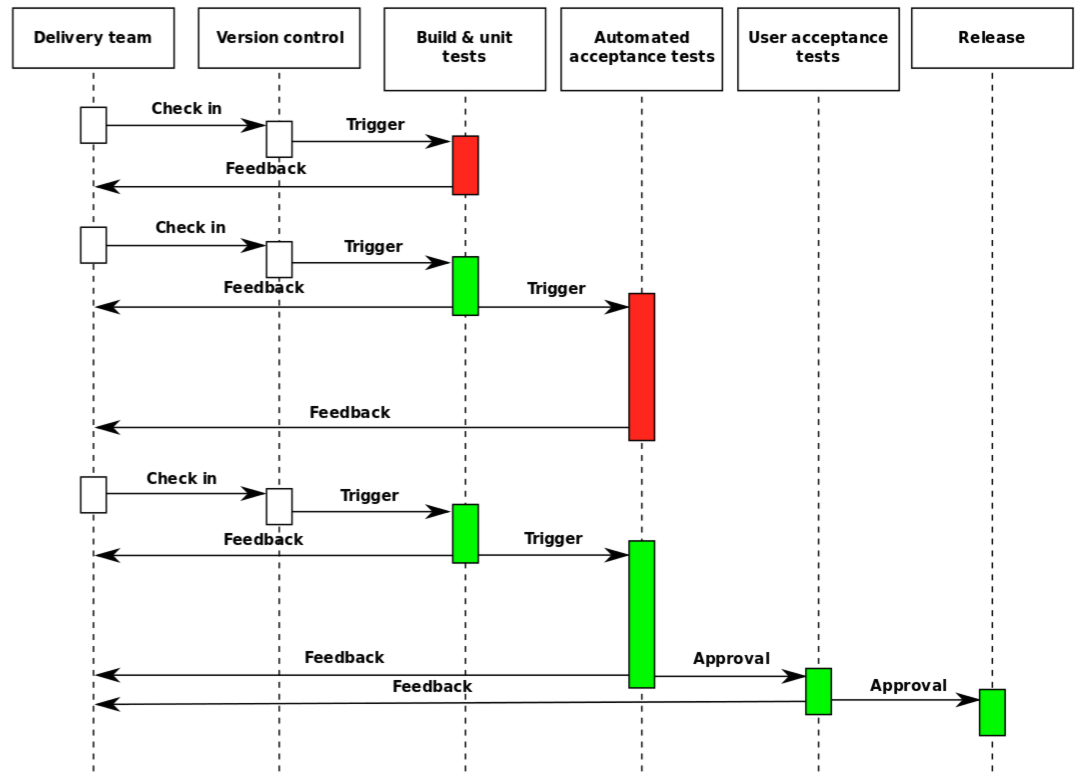
- AI tooling is pushing more infrastructure changes through delivery pipelines than those pipelines were built to absorb.
- And because generative output is non-deterministic, every one of those changes carries a governance cost that manual review cannot scale to meet.
All of these pressures point in the same direction: the challenge is no longer simply how infrastructure code gets written. It is whether the platform around that code can validate, govern, and deploy change fast enough to keep up without increasing operational risk or overloading your systems and vendors.
The best example of this is the strain GitHub is under, and it’s a key component of most organizations’ delivery processes. When every developer and every AI assistant is pushing more pull requests through the same review and merge infrastructure, the bottleneck shifts from code production to code absorption. This is a platform problem and a scalability problem.
The Amplifier Problem
Google Cloud’s 2025 DORA research, based on responses from nearly 5,000 technology professionals worldwide, offers useful framing here. The headline finding: AI is an amplifier. It magnifies the strengths of high-performing organizations and the dysfunctions of struggling ones. When internal platform quality is high, AI adoption drives strong organizational performance. When platform quality is low, the effect is negligible.
According to DORA research, 90% of organizations now report using AI in software development, a 14% jump from the prior year. More than 80% believe it has increased their productivity. But individual productivity and organizational delivery are different measurements, and the gap between them is where the problems live.
DORA calls this “downstream disorder.” Individual coding gains, including 21% more tasks completed and 98% more pull requests merged, get swallowed by bottlenecks in testing, security review, and deployment. The code ships faster from the developer’s laptop. It does not ship faster to production. Anyone who has watched a monitoring dashboard light up after a deployment spike will recognize the pattern: more throughput into a pipeline that was already the constraint just creates a bigger queue.
We are seeing the downstream pressure directly with customers. The output of engineering organizations is increasing rapidly, which strains every system it touches. The output genuinely is higher. But it also breaks things and creates challenges in pipelines and in getting changes safely into production.
We’ll Always Need a Bridge
Throughout my career in observability and infrastructure, the bigger organizations I work with always maintain a significant footprint on premises. They bridge traditional and cloud-native environments constantly. That balancing act is not going away. We need to be able to support both the old and the new. In fact, in the world of AI, there is actually accelerating investment in physical infrastructure: GPU clusters, private data centers, edge deployments. The enterprise is hybrid, and it will stay hybrid. Deployments will continue to span the legacy and the cloud-native.
IaC is what bridges these two worlds. For most organizations, IaC sits between a pure Kubernetes play and legacy infrastructure management, providing a declarative specification layer that gives teams auditability, reproducibility, and version control across environments that behave very differently under the hood. That foundation matters even more as AI enters the picture, because the platform managing this complexity is now the primary constraint on how fast and safely change can move.
AI-generated infrastructure code makes this layer more important. The output of generative AI models is non-deterministic. Two prompts that mean the same thing can produce configurations that behave differently. Without IaC serving as the authoritative system of record, organizations lose the very properties that governance depends on. You cannot audit what was never declared. You cannot reproduce what was never versioned.
The Platform Is the Bottleneck
What defines a high-quality platform in practice? It is a matter of assembling the right tooling that gives teams some flexibility while also enforcing the standards that make them productive and safe. It does not look the same for every team or every organization. There are components that should be shared across the company, and there are components that should be customized for individual teams. As you move into larger companies and regulated industries, platform choices have to enforce compliance requirements, which changes the equation. A public company’s platform needs are different from a startup’s.
The common thread is that the platform must be the governed path, and the governed path must be visible and low-friction enough that engineers default to it rather than route around it. Governance will always carry some overhead. That’s not a flaw; it’s the mechanism. The goal is not to make compliance faster than cutting corners. It is to reduce the perceived cost of following the right path enough that bypassing it doesn’t feel worth the risk. When that bar is met, AI-generated code flows through the same guardrails as everything else. When it isn’t, AI just accelerates the sprawl.
Agentic AI Still Needs Humans in the Loop
There is a narrative emerging that treats agentic AI as the final step toward removing humans entirely from infrastructure decisions. I do not agree with that framing. If anything, humans need to guide agents down the right path, provide feedback, and review output. What changes is that each human is managing multiple agents rather than doing the work directly. Humans are not removed from the loop; that is clearly not what organizations want or what people want. We hear this loud and clear from our customers who are happy to use our AI solution in read-only mode or what we call “Ask” mode, but hesitant to use the read/write or what we call “Build” mode.
Does that mean organizations need as many humans? That remains to be seen. But there will always be new problems to solve and new things for people to work on to drive the business forward. Managing agents, curating the data they operate on, and verifying that their work meets governance standards is real, skilled labor. The job may change shape, and people will do new things, but the need for judgment, the need for people, will never go away. The question for infrastructure leaders is not whether to keep humans in the loop, but rather how to build the platforms and practices that make human oversight practical at scale.
Where Next?
The DORA data makes the sequencing clear: platform quality first, then AI adoption. Organizations that build the foundation before scaling saw strong returns, whereas organizations that scaled AI adoption without that foundation saw negligible improvement. The order matters, and it points to a few concrete priorities for infrastructure leaders today:
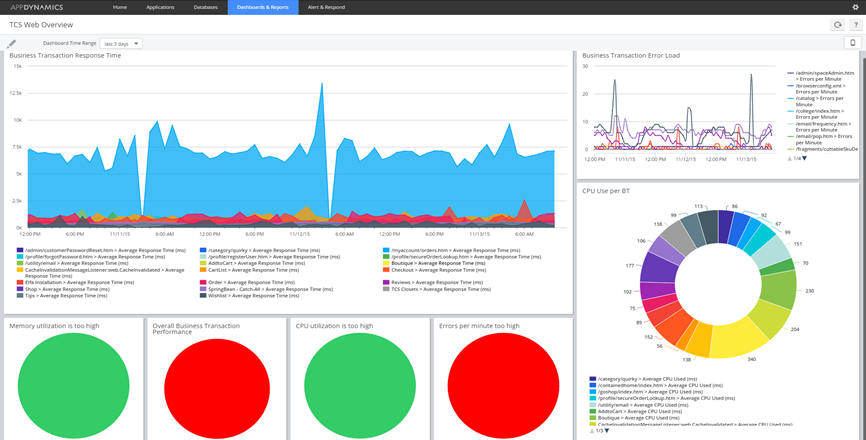
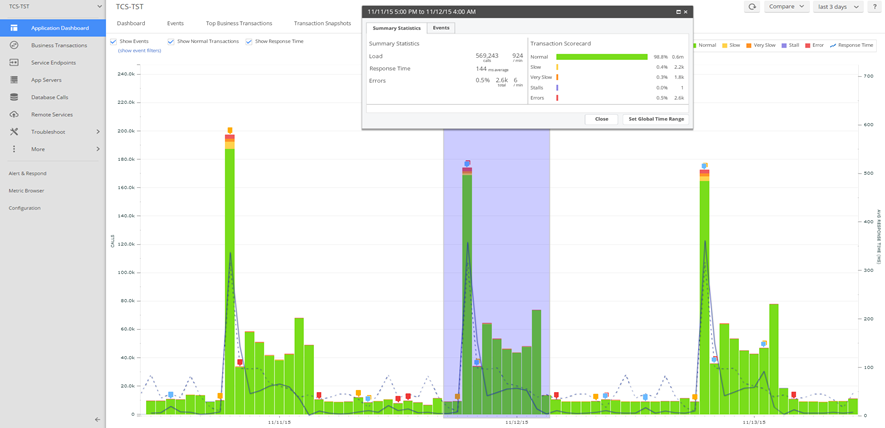
First, instrument your delivery pipeline for AI-specific signals. The downstream disorder DORA describes — where individual productivity gains stall out in the pipeline — is not visible with traditional delivery metrics. You need observability within the pipeline itself to see where AI-generated volume is creating new failure modes, not just where throughput is high. The GitHub strain problem does not fix itself; you have to be able to see it first.
Second, embed governance into the platform workflow. This is the direct application of the platform visibility argument: guardrails against AI hallucinations and configuration drift have to live inside the developer’s natural path to production, not bolted on at the end. A manual review step that adds friction without adding value is the thing engineers route around. Governance embedded in the workflow is governance that actually holds.
Third, invest in people who are curious about these tools and willing to adapt. Most organizations are comfortable letting AI assist in read-only mode. The harder and more consequential move is giving agents the ability to act. That transition requires (1) people who understand the failure modes well enough to know when agent output is trustworthy and (2) platforms with enough observability and governance that the move from Ask to Build does not mean trading control for speed. Investing in both is how you get there without increasing risk.
The future of infrastructure management is platform-shaped: a governed, observable and scalable system that treats IaC as the foundation and AI as a powerful yet non-deterministic contributor. Get the foundation right, and AI will amplify what your team can do. Skip it, and you are building on sand.